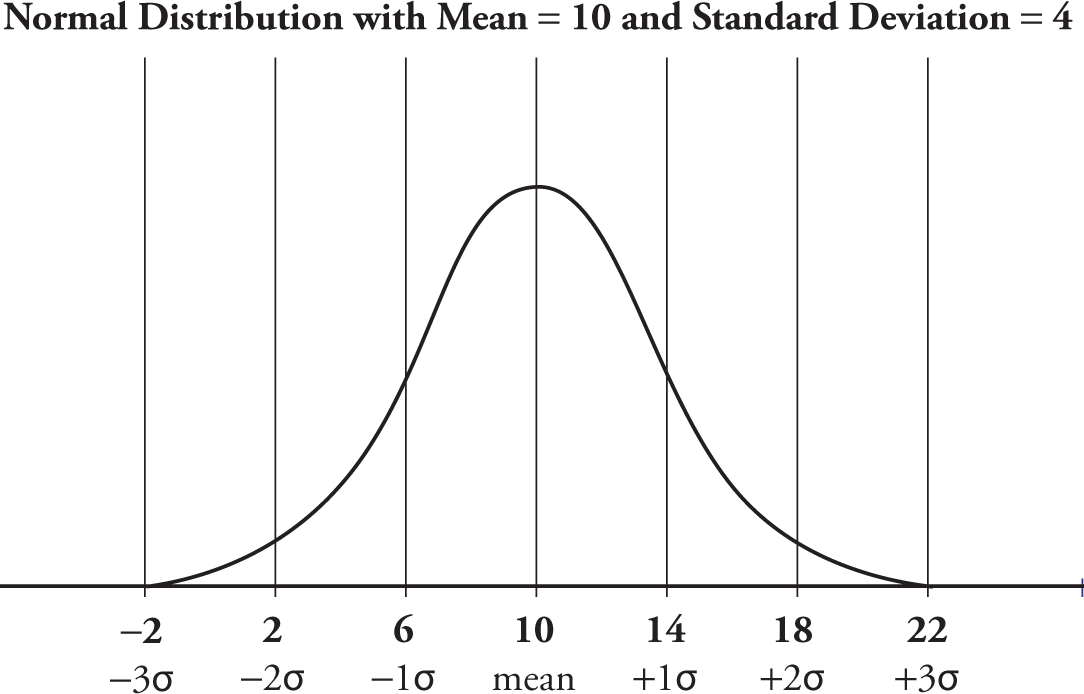
One of the most important distributions for random variables is the Normal Distribution (also known as the Gaussian Distribution). The Normal Distribution looks like the classic “bell curve,” rounded in the middle with long tails, and symmetric around the mean (which equals the median).
The GRE tests on distributions that are both normal and approximately normal. These distributions have the following characteristics:
 , or the 17th percentile. A value of 14 is at roughly
 , or the 83rd percentile.
 , or the 2nd percentile. A value of 18 will be at
 , or the 98th percentile.
 of the curve is 3 or more standard deviations below the mean; the same is true above the mean.
The GRE typically will only test these concepts in a general way, and it will not distinguish between random variables that are normally distributed versus ones that are nearly normally distributed. However, it is important to note that distributions that are not normal or nearly normal do not necessarily share the characteristics above. It is possible, for example, to construct distributions where the mean and median are substantially different, or where 100 percent of the observations fall within 2 standard deviations, or where more than 1 percent of the observations fall more than 3 standard deviations from the mean.
For questions #12–15, variable X is nearly normally distributed, with a mean of 6 and a standard deviation of 2.
Approximately what percent of the observations in X will be smaller than 4?
Approximately what percent of the observations in X will be greater than 12?
For variable X, approximately what percentile corresponds to a value of 2?
Would the answers to questions #12–14, be the same if variable X were not nearly normally distributed?