Chrome has some great tools for debugging JavaScript, but is still pretty raw when it comes to debugging WebAssembly. After you have built the app, open it up in Chrome, and then open up Chrome Developer Tools:

You can open it up using the menu in the top left of the browser, as seen in the preceding screenshot, or you can open the developer tools by pressing Ctrl + Shift + I on your keyboard. When you load up your debug.html file in Chrome, you need to click on the Sources tab in the developer window. This is what this should look like if you are on the Sources tab:

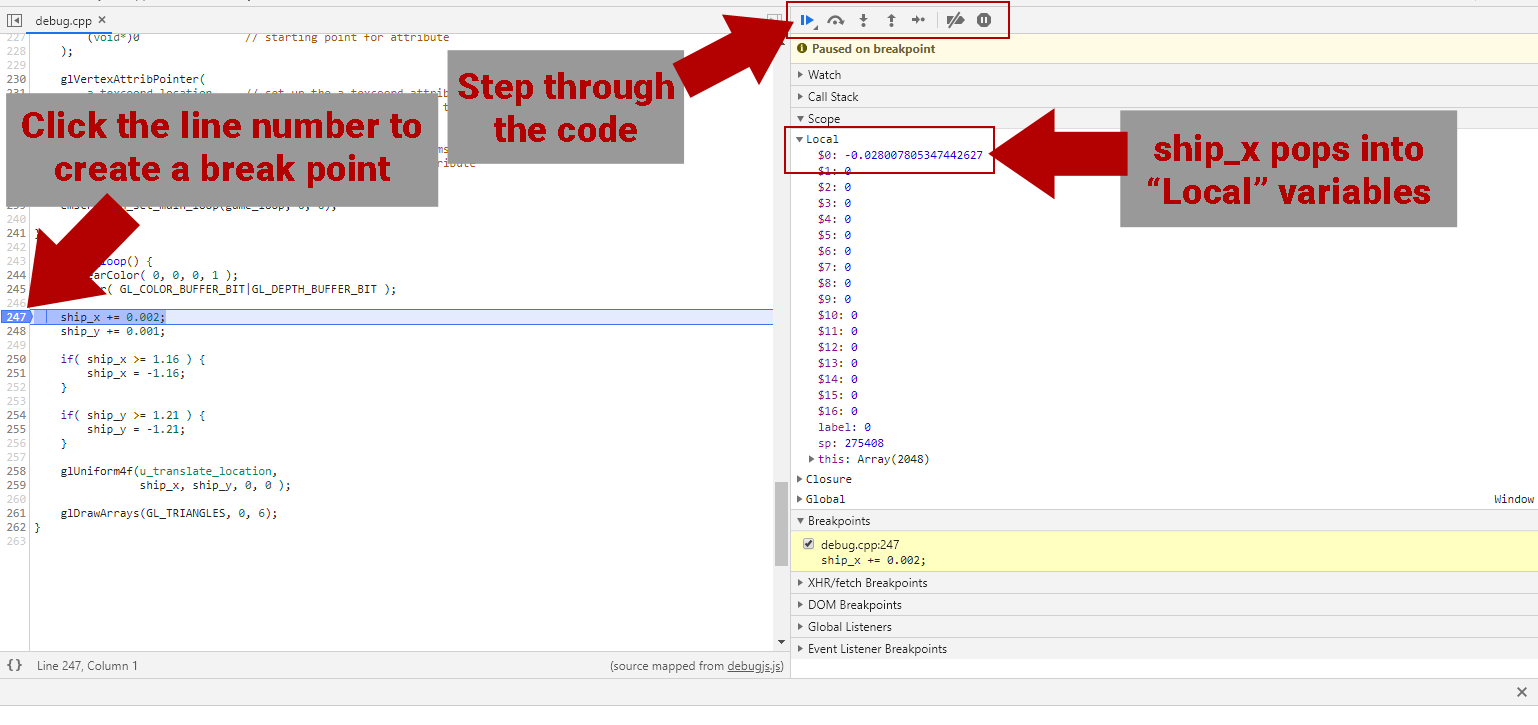
If you don't see debug.cpp in the Sources tab, you may need to click the browser's reload button next to the URL at the top to reload the page. As I stated earlier, the interface feels a little buggy, and sometimes the CPP file doesn't load on the first try. Hopefully, this will have changed by the time you read this. Once you select the CPP file, you should be able to see the C++ code from our debug.cpp file in the code window in the center of the Developer Tools window. You can set breakpoints in the C++ code by clicking on the line number next to the line of code where you would like a breakpoint. You can then step through the code using the buttons above the Watch variables. Although the watch variables don't work at the time of writing, you may want to try it anyway. WebAssembly is improving on an almost daily basis, and bug fixes are constantly happening, so by the time you read this, things may have changed. If not, you may use the Local variables to get some idea of what values are changing.
You can watch these variables get populated as you step through the source code, and you can frequently determine which variables are updated by watching these values change. Take a look at the following screenshot:
At the time of writing, you need to click the step over button more than once to get the line to advance in the C++ code window. In Chrome, the step over button is advancing one WebAssembly instruction per click instead of one C++ instruction. This may have changed by the time you read this, but don't be surprised if you need to click step over more than once to advance through the code.