Profiling is the best way to determine what bottlenecks exist in your source code. When you are profiling WebAssembly modules, I recommend that you use the --profiling flag when compiling. You can profile without it, but all of the module functions you call will be labeled wasm-function, which can make your life more difficult than it needs to be. After compiling your code with the --profile flag, open up a new Incognito window in Chrome.
You can do this by either pressing the CTRL + SHIFT + N keys, or through the menu in the top right corner of the browser:

Opening an Incognito window will prevent any Chrome extensions from running when profiling your app. This will prevent you from having to wade through the code in those extensions to get to the code in your app. Once you have opened an Incognito window, press Ctrl + Shift + I to inspect the page. This will open up Chrome Developer Tools at the bottom of the browser window. Inside Chrome Developer Tools, select the Performance tab, as you can see in the following screenshot:

Now, click the Record button and let it run for a few seconds. After you have recorded for five or six seconds, click the Stop button to stop profiling:

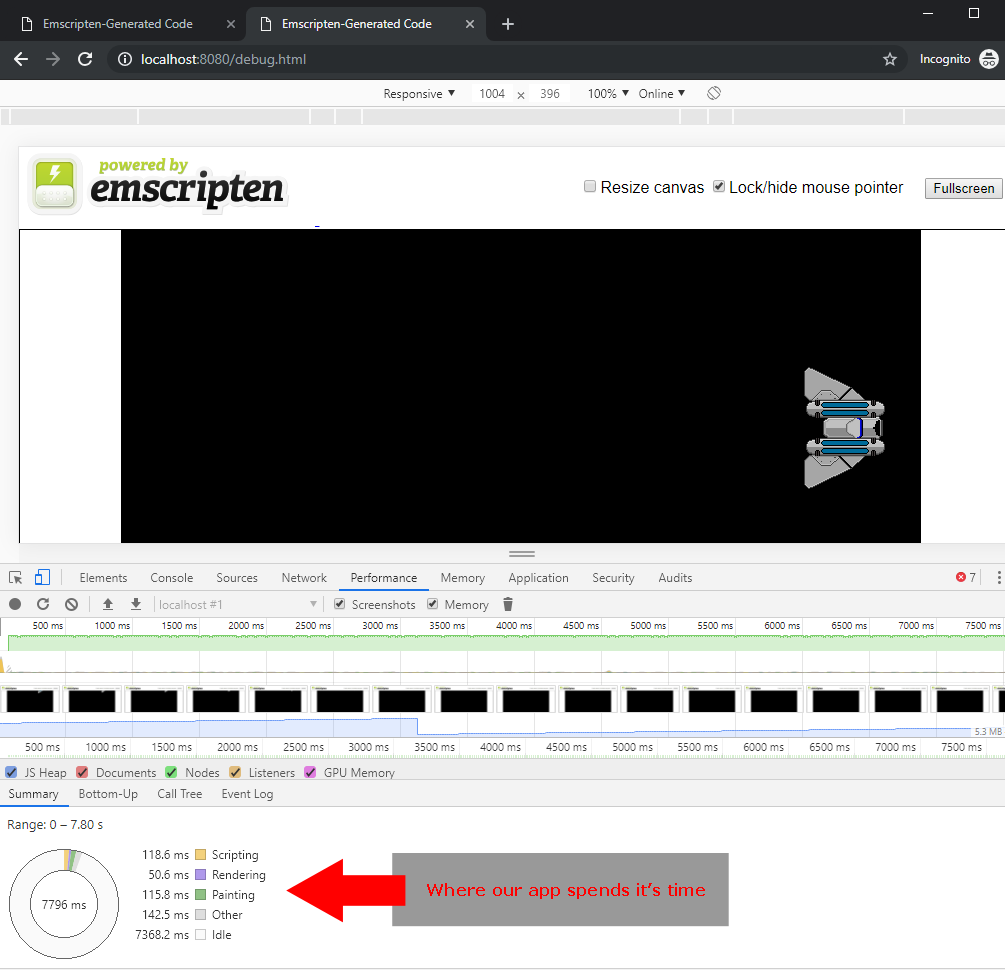
After you stop profiling, you will see data within the performance window. This is called the Summary tab, and displays data in the form of a pie chart that breaks down the number of milliseconds your app is spending on various tasks.
As you can see, the vast majority of the time, our app is idle:
The summary is interesting. It can tell you where your bottleneck is on a very high level, but to evaluate our WebAssembly, we will need to look in the Call Tree tab. Click on the Call Tree tab, and you will see the following window:

Because our game_loop function is being called every frame, we can find the call inside the Animation Frame Fired tree. Drill down, looking for game_loop. When we find the function, it is mangled because it is a C++ function. So, instead of seeing _game_loop, we see _Z9game_loopv, although you may see something mangled differently. If you would like to prevent this mangling, you can wrap this function in an extern "C" block.
You can see that the execution of this function took a total of 3.2% of the browser's CPU time. You can also look at each of the OpenGL calls from within this function. If you take a look at our game loop, more than half of the CPU time is spent in _glClear. This is not a problem for this application, because the vast majority of the browser CPU time is spent idle. If, however, our game loop function was taking up a large percentage of the CPU time, we would need to see where in that function we were spending it.