
Before you can make a plan or even think about a benchmark—whether you’re going it alone or working with a professional—you must know what your goals are.
The good news for most individual investors is their goals can be stated fairly simply. That doesn’t mean achieving them is simple! (It probably won’t be.) But your goals should be easy to state and easy to understand.
But have you ever tried articulating them? Does it take you a PowerPoint presentation with fancy graphics and piles of jargon? Or can you articulate them clearly to your spouse or your 90-year-old mother? And are you confident anyone you work with will clearly understand your goals? And nothing will get lost in translation?
This chapter covers:
Why do some investors find simply stating their goals so difficult? My guess is, in part, the financial services industry itself hasn’t always been exactly helpful.
The industry is often much maligned. I have my own gripes with it, but for all its faults (every industry has them), it does provide a vital service. Done right, investment professionals help investors increase the odds they reach their long-term goals.
There is, however, a dizzying array of financial products—for every need, real or imagined. And more every year! Financial innovation is a non-stop process. And overall, a good one. Over time, it has provided wider access to global capital markets, increased liquidity, more transparency, better price discovery, speedy online trading, cheaper transactions, etc.—which, overall, benefit more and more people. Good things! But with so many more products coming to market and with so many people selling those products, it’s no wonder folks often see themselves as having hugely multifaceted and sometimes conflicting goals.
Not everyone needs a professional. Maybe some investors have smaller pools of money right now, making professional help less cost efficient. And many investors have the knowledge, experience and fortitude to do it on their own. They know what’s appropriate for them, do research, go online, buy some decent securities and don’t jigger much unless jiggering seems appropriate. They have ice water in their veins and don’t get swayed by the vagaries of near-term performance, which can vary a fair bit depending on the strategy.
Plus, over long periods, few professional money managers beat their chosen indexes. Some long-term legends have done it. I’m proud my firm has a long-term record of beating its benchmark (though not in every short-term period).* But even if money managers don’t meet or beat their benchmarks, good professionals can provide an exceedingly valuable but all-too-often underestimated service—helping their clients stick with an appropriate strategy.
There are myriad mistakes investors make. Many of the books I write focus at least in part on common investing errors and how to better avoid them. My view is investing well is at least two-thirds about not making mistakes. If you can avoid common errors most investors make, you can lower your error rate on average and get better results over the long term.
Said another way: If you invest long term, you will make mistakes. You should expect it. The goal should be identifying errors you’re likely to make and trying to avoid those. And failing to stick with an appropriate strategy is a major error many investors make. Repeatedly. Maybe you’ve already made this mistake. Maybe a few times! And maybe you don’t even realize it. (Many folks don’t.)
Why don’t investors stick with a strategy? Your brain and the way it reacts to problems evolved long ago when we didn’t have fast Internet connections with stock prices flashing in our faces (or grocery stores, indoor plumbing, etc.). Our brains were hardwired through millennia to deal with problems of survival—not with something as counter-intuitive as capital markets.
Folks who study behavioral finance have identified many cognitive errors—instinctual behaviors learned from our cavemen ancestors—that plague investors. And often, multiple ones are at work at any one time. For example, investors often suffer from myopic loss aversion.This is hypersensitivity to near-term losses or even just fear of losses in general. This can cause investors to take action to avoid the near-term possibility of pain—even if taking that action might cause much greater pain down the road. You might think of this like the “flight” instinct, and it’s deeply ingrained—no one wants to get mauled by saber-toothed tigers.
Also at work in investors’ brains (often the same investor, and sometimes following rapidly after the myopic loss aversion) is overconfidence. That saber-toothed tiger might be scary, but darn it, one kill will feed your family for two months, and its coat is nice and warm. That might seem worth the risk of facing down the beast, armed with just a flimsy, stone-tipped stick. Big risk can mean big reward.
A bit simplistic but perhaps useful way to think of those (and many other) cognitive errors is they tend to fall into the broad buckets of “greed” and “fear.” Which one is motivating you now? And why? Just because you feel fearful doesn’t mean the flight instinct is right and won’t cost you later. And just because you feel greedy doesn’t mean that instinct is right, either. Thousands of years ago, running when fearful probably served early humans well. In investing, the reverse is often true. After all, Warren Buffett popularized the (very often true) statement, “You should be greedy when others are fearful and fearful when others are greedy.”
And investors aren’t prone to just feel fearful forever or greedy forever. A strategy investors view as smart and appropriate might seem like snoozeville after a couple or three years of big, back-to-back double-digit returns—as can happen in bull markets. Then, getting big positive returns can seem easy to some. Too easy, so they may be tempted to amp up risk to juice portfolio returns by going heavily into a hot category or two.
This often happens right before that hot category cools (like Energy in 1980, Tech in 2000 or Financials in 2008). After the hot category crashes—and with it, maybe the entire market—those same investors who thought their strategy too staid may now decide they’re done with stocks forever and want nothing but (presumed) low-risk instruments.
But after every bear market comes a bull market, world without end, Amen. And then those investors who thought they’d never buy another stock may eventually think their so-called low-risk strategy is for the birds, and now they want to ratchet up risk again.
This can happen over and over again as investors in-and-out of various vehicles—chasing heat and getting burned—flip-flopping between greed and fear. The truth is, if a strategy (done right) is appropriate for your long-term goals (which we’ll get to in a bit), that strategy should remain appropriate for you no matter the market condition.
Sure, the tactics can change depending on market conditions, and a good strategy allows for flexibility. But wholesale changing your entire strategy (i.e., your benchmark) every few years is a recipe for disaster.
How can you know? Each year, Dalbar, Inc., a Boston-based financial services market research firm, releases a report on a variety of investor behaviors. Its research shows over the last 20 years (through year-end 2011), the average equity mutual fund investor held his funds on average 3.3 years—which means not even a full market cycle. Not even close to a full cycle!
But who cares if the results are good, right? Except they’re not good—just the reverse. Over that period, the average equity fund investor averaged just 3.5% annualized returns,1 while the S&P 500 (the benchmark for the funds they measured) over that time annualized 7.8%2—a big 4.3% annualized lag to the benchmark over 20 years.
Now, that’s not to say the mutual funds investors inned-and-outed matched the performance of the S&P 500 on average. They probably didn’t! But on average, those funds likely did much better than the investors themselves. Myriad studies have shown funds do better—usually much better—than their individual investors because investors in-and-out. An average 3.3 year holding period likely hurts much more than it helps.
It’s not just equity fund investors who do this. Bond fund investors hold their funds on average 3.1 years. And they lagged their benchmark by a very big average annualized 5.6% over the last 20 years.3
No, not every money manager you hire will beat its stated benchmark—whether you buy funds or hire a discretionary manager. And maybe your goal isn’t beating a certain index, whether it’s equity, fixed income or a blended index. But just staying disciplined to an appropriate strategy and not inning-and-outing can materially improve your long-term results. And having a third party can help.
In my view, for most individual investors, your high-level goals can be expressed very simply. When you boil it down for the vast majority of individual investors, they typically have one of the following four goals:
Straightforward. Simple! Again, that doesn’t mean achieving them is simple. But by determining what your goals are, you’re one big step down the road of building an appropriate retirement investing plan. That’s perhaps your most important job as an investor: Clearly define reasonable goals, then determine periodically if the road you’re on can get there.
We’ll go over these goals more in later chapters to help you better understand what’s reasonable to expect, whether your current portfolio size and current savings plan are sufficient and, perhaps more important, how to make sure your plan (whether you devise it or someone else does) increases the likelihood you achieve your goals. But let’s briefly review each goal.
Growth is growth. Seems easy—growth! You have something now; later, you have more. But how much growth is appropriate for your objectives and needs?
For example, equity-like growth might be appropriate for your goals. (We talk more about what’s reasonable to expect from equities in Chapter 5. It’s critical to consider what’s reasonable because con artists often prey on those with unrealistic growth goals. And if you’re taken in by a scam, your loss can be total. Beware unreasonable growth goals.) Or you might think you want to just keep pace with inflation. You may not think of that as growth, but even just keeping pace with inflation requires some growth.
A common statement folks make about their investments is, “I need this to provide for me in retirement.” They want their portfolio to kick off enough cash to cover living expenses—now or in the future, partially or wholly. Maybe those are your living expenses (when I say “your,” I’m including your spouse, if you have one). Maybe they’re yours and/or living expenses of a loved one—a parent, a child still living with you.
Whatever happens to the absolute value of your portfolio—whether it grows, shrinks or depletes—this goal is about aiming for the portfolio to survive long enough to kick off whatever cash flow is needed.
Also, I say cash flow instead of income for a reason—there is a difference, which we’ll cover more in Chapter 6.
Then there’s the growth-and-income goal—a not unusual goal for investors. Folks want their portfolio to kick off some degree of cash flow, and they want their portfolio to stretch to allow for that. Maybe they want a lot of stretching and prefer their absolute (or inflation-adjusted) portfolio size to grow over time, too. Maybe they’re more indifferent to portfolio growth and just want to increase the likelihood their cash flow source doesn’t run out before they do.
We’ll cover this more in later chapters, but, like the pure growth goal, it’s critical to understand what’s reasonable to expect. If you’re taking 20% of your portfolio each year and expect the portfolio to grow above and beyond that on average, your expectations are likely hugely out of whack. (More in Chapters 5 and 6.)
The fourth goal, capital preservation, is one that can be a source of confusion for folks. Misperceptions here are common. Capital preservation means preserving the nominal value of your assets. For investors with long time horizons, this is rarely appropriate.
Sure, at points in their lives, many may have shorter term cash-flow needs for one-time large purchases. For example, if you plan to buy a new home sometime in the period ahead—a few months or even a few years—you don’t want your down payment to take a near-term whack thanks to stock- or bond-market volatility. And you certainly don’t want to tie that money up in something illiquid.
But as a longer-term goal, true capital preservation can mean watching your purchasing power diminish—for reasons that follow.
Even among professionals, there’s often confusion about what capital preservation means. Often you hear or read about products, strategies or tactics that allegedly offer “capital preservation and growth.” However, these are two utterly conflicting goals. You can’t do them both at the same time—not as a goal.
And if you believe capital preservation is your goal, ask yourself why? Capital preservation means your portfolio value should never lose value—not even on a daily basis—which requires the absence of volatility risk. That may sound nice at first blush, but volatility goes both ways—up and down. You can’t get growth without volatility.
Investors, particularly those new to the game but even some grizzled veterans, mistakenly presume bonds protect against downside volatility. Not so!
Bonds are traditionally less volatile shorter-term than stocks. But risks exist. First and most obviously, bond investors do face default risk—and losses can be total. In bankruptcy proceedings, bond holders can sometimes recoup something—but that process can be long and often fruitless.
Some bonds are deemed riskier than others—like so-called junk bonds. Historically, junk bonds pay higher yields, but the risk the firm goes kaput and fails to return principal or reneges on interest payments is higher. But even firms with pristine ratings can and do go bankrupt. Lehman Brothers enjoyed an “A” credit rating right up until the moment it collapsed. The highest rating is “AAA,” but “A” is pretty darn good—any CEO would be thrilled. AIG was rated “A,” too—right before the US government nationalized it in 2008. Those high ratings didn’t guarantee investors anything.
Remember Enron—poster child for corporate malfeasance? It was AAA-rated until CEO Jeff Skilling suddenly and mysteriously stepped down in August 2001. A few months later, the scandal was out, the company bankrupt and shareholder value obliterated—bondholders, too. Credit raters were hoodwinked—as was most everyone else.
Muni bonds also can be worthless if a municipality defaults. Defaults in major municipalities are rare—but they happen. New York City in 1975, Cleveland in 1978, Orange County in 1994. Still, a US muni default rarely means investors have a total loss. It can mean investors receive interest payments at a delayed schedule, but utter wipeouts are rare. From 1929 to 1937—the worst period for US municipality defaults (not shockingly, during the Great Depression)—the muni recovery rate was still 99.5%.4 Pretty darn good.
Complete loss in munis has been rare historically, but munis and all bonds experience day-to-day price volatility. Even Treasurys have daily price volatility—and can and have had negative annual returns. True capital preservation would mean holding cash or very near-cash vehicles.
Whereas growth—even mild growth—requires some volatility risk. Can’t get upside volatility without the downside. “Capital preservation and growth” sounds phenomenal. Grow your portfolio and never lose value! Who doesn’t want that? Except it’s like fat-free steak—near-universally appealing but not possible.
Let me reverse myself for a moment. Capital preservation is possible as a very long-term result of a long-term growth goal. If your goal is growth and you have a portfolio of all stocks, odds are, after 20 or 30 years, your portfolio will have grown. Maybe a lot! Maybe it will have doubled a few times! Then, yes, you’ve preserved your initial capital and experienced growth over that very long period.
But in shorter spurts, because your portfolio included volatile assets, there were periods the portfolio was down—on a daily, weekly, monthly and even yearly basis. But you were ok with that because your goal was growth, and you (presumably) understood growth required some degree of volatility.
So anyone who tells you your goal can be capital preservation and growth at the same time is providing you a service by unwittingly warning you off. He’s either telling you he doesn’t know much about capital markets, or he’s trying to deceive you. Either way, run.
Now, some readers may say, “But wait, I could just hold Treasurys to maturity, and that would be some growth. Not a lot of growth—but growth!” True! If you looked at your portfolio value daily (which I don’t recommend for anyone who isn’t a professional), monthly or even yearly, you will see some price fluctuation—yes, even to the downside. Which means if you must liquidate, you can lose money even holding Treasurys. However, if you can and do hold to maturity, then that won’t matter—and that could be one capital preservation strategy.
However, that’s also a strategy that may lag inflation over time. As I write, 10-year Treasurys yield about 1.6%.5 Long term, inflation has averaged about 3%.6 A strategy where you lend the US government money for 10 years and it pays you 1.6% annually still loses you money at a slow, steady clip if inflation is anywhere near average in the period ahead. It loses money slower than the mattress-stash strategy, but it still loses money.
The 30-year Treasury now yields just 2.7%—just under inflation’s long-term average! And to prevent any near-term price volatility, you must hold to maturity. Thirty years is a long time to lock up assets for the high probability of just breaking even or even losing a bit of value after adjusting for inflation.
Now, it’s true bond prices are historically low, and odds are they rise at some point. And inflation has been historically low, too. But if bond yields rise, it’s likely inflation also rises. And if bond yields rise, that makes the prices of bonds you currently hold fall. If something happens and you must liquidate, again, you could end up with a loss—not the idea behind a capital preservation strategy.
Capital preservation often doesn’t end up yielding the results folks want because of that silent killer—inflation. But inflation can also get folks who plan for some growth—just not enough.
First, a few words about inflation, because folks often confuse what inflation is and what it isn’t.
Milton Friedman famously said, “Inflation is always and everywhere a monetary phenomenon.” What he meant was inflation is about money supply—nothing else. Not gold. Not debt. Not trade deficits. Not oil prices. Not any of the other things headlines scream cause inflation. Money supply. If money supply increases faster than economic activity can mop up the excess, prices rise—and prices rising on average is inflation. This is often described as “too much money chasing too few goods.”
Folks often don’t think about money supply, but they should. Irving Fisher’s (no relation) famous equation (which Milton Friedman ascribed to) described the relationship between money supply and prices as:
M is money supply—how much money is out there. Central banks globally control money supply (in part) by raising and lowering key central banking rates (in America, the fed funds target rate). Effectively, when a central bank raises rates, it’s reducing money supply. When it lowers rates, it increases money supply. Then, too, when a commercial bank makes a loan to you—for a house, a car or even through a credit card—that lent money is like money newly minted out of thin air, and that adds to different calculations of M.
V is velocity—how fast money moves through the economy. It’s like this: You get a car loan from a bank—which is effectively new money introduced to the economy. You give that lent money to the car salesperson. The car salesperson gives a chunk of that money to the car company, but keeps some as a sales commission. He uses that commission to pay his mortgage, buy groceries, buy clothes for his kids and pay insurance premiums. The car company uses the money it received to pay employees but also pays the different firms that produce the microchips, tires, steel, fabric for the car seats, etc. Everyone who receives a bit of money turns around and does another transaction. Or maybe they save it! But how fast that money changes hands and then changes hands again is the velocity. Sometimes it’s faster. Sometimes, like during a recession, economic activity slows, and so does velocity.
P is prices, and Q is quantity of goods and services sold—both straightforward.
Don’t try to input real numbers. You couldn’t if you tried. The equation is meant to be illustrative, but it does show well how money supply and velocity impact prices.
For example, if money supply rises a bunch—because a central bank has slashed rates and is pumping it out and/or banks are lending a bunch—and economic activity (i.e., velocity) stays relatively static, that naturally makes prices rise on average because the equation wants to balance—and that’s inflation. If money supply and economic activity both rise, that can really juice prices. When prices are rising very fast on average, that’s often called “hyperinflation.” (A condition which has no technical definition and happens much less often than histrionic headlines purport.)
If money supply falls and/or velocity falls, that could cause disinflation—which is a slowing rate of inflation. If either or both fall a lot, that could cause deflation—falling prices on average.
Falling prices might sound grand at first, but they’re not. And in fact, if you had to choose between mild deflation and mild inflation, you want the mild inflation every day of the week and twice on Sunday—no question.
If prices are in a steadily falling trend, that tends to exacerbate what is likely an already slowing economy. If you know prices will be lower next month, you probably won’t make any large ticket-item purchases. You wait for the lower prices later. Firms are the same way. Non-essential economic activity gets put off, so economic activity slows still more.
But prices don’t just fall on the things you want to buy, they fall for labor, too—i.e., incomes tend to fall in a deflationary environment. Prices are falling, firms are producing less, you’re earning less and the economy is slowing—probably contracting. Firms probably start cutting costs, which means cutting head count. That’s deflation, and it’s not good.
Periods of true, sustained deflation are fortunately rare, at least in major economies like the US. We had some deflation during the 2007–2009 recession, which contributed to and exacerbated the recession. It’s a bit chicken-and-egg when you talk about deflation and recessions, but it’s safe to say without deflation, recessions are usually milder.
Central banks often fight deflation by pumping up money supply. If V falls, you can keep P from falling (or falling as much) by raising M. The aim is to “balance” the equation. And hopefully, the rising M gets the V going again, too.
Lots of folks disliked the Fed’s and US government’s responses to the 2007–2009 recession—lowering rates, quantitative easing (i.e., “printing money”) and enacting government stimulus. (Moves that were largely mirrored globally—America wasn’t the only doing them.) I’m not a huge fan of big government spending, either—I think you’re a vastly better and smarter spender of your own money. But technically, increasing M (which both monetary and fiscal stimulus do) can be an appropriate response if V is falling. Falling P (i.e., deflation) usually just exacerbates your economic problems.
That’s not to say I think the Bush and then Obama administrations handled it perfectly. They didn’t! I’d say they both did pretty lousy jobs—they’re politicians, after all. But sitting idly by and not doing anything to increase M when V is falling likely yields much worse results.
On the flip side, when V starts cooking and P starts rising, too, the proper response to prevent overheating inflation (i.e., hyperinflation) is often to rein in M—usually by the central bank’s raising rates or some other central bank action (or combination of actions) that can mop up excess money supply.
This isn’t to say central banks are perfect—they’re not. Far from it. They make lots of errors—central banking isn’t a perfect science. And major central bank policy errors have often been a key cause or exacerbating factor for past recessions. However, central banks in developed countries have gotten better in recent years thanks to improved technology and data gathering, as well as just having more past data points to study.
Another important point about inflation: Inflation isn’t when prices of things you buy rise. Inflation is an averaging. In a world of 0% inflation, all prices wouldn’t be static. About half would be rising (some faster, some slower) and half falling (some faster, some slower). You may or may not experience the average of all prices, so if the prices of the things you buy most are rising, you may feel that as higher inflation—though overall inflation may be tame.
Figure 2.1 demonstrates this—showing changes in common expense categories over the last 20 years relative to the Consumer Price Index (CPI)—a common measure of inflation. No surprise, college tuition has skyrocketed. Myriad health care categories, too. (Folks like to assign blame for that, and politicians try to solve it, but to my view, their trying to solve things just makes things worse.)
Figure 2.1 Inflation’s Impact
Source: Thomson Reuters, price changes in CPI components, from 12/15/1989 to 12/15/2011.
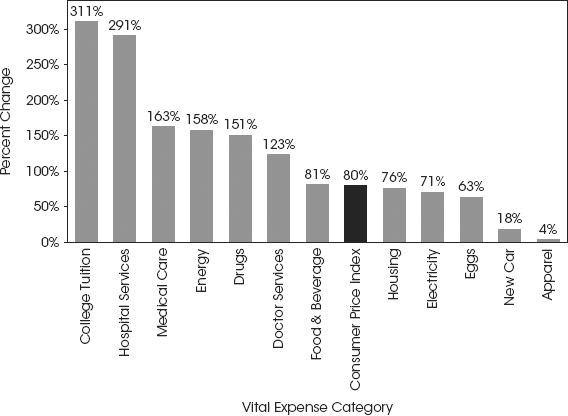
Energy has also risen more than average inflation. Food and beverages have been about the same. Housing has lagged inflation on average during this period, tied to the housing downturn starting about 2006 or 2007 (depending on where you live). Eggs are darn cheap! (Why eggs are measured here is beyond me. These are government data, and government wonks can be wonkish.) Cars have really lagged inflation, as has apparel.
Mind you, CPI isn’t perfect either. It’s a measure of a basket of goods—over 200 item categories (which roughly fall into the major categories shown in Figure 2.1) with hundreds more specific items within each. The aim is to capture the average consumption experience of average Americans. (Good luck with that.) It doesn’t include income taxes or property taxes—they’re not associated with the purchase of consumer goods. Nor does it include investments like stocks or bonds—they aren’t day-to-day expenses.
And the items included change from time to time—8-track tapes get swapped out for CDs and then for whatever the next thing is. And you always get folks griping that CPI is out of whack or too jimmied with or governmentally produced, so it’s not reliable. Well, yes, all government data should be taken with a grain of salt. But CPI isn’t much better or worse than any other way of measuring inflation, and it has a long, consistent history. So for measurement purposes, it’s fine, though it may not feel like the kind of inflation you’re experiencing personally.
Which goes back to my point that investors planning for retirement—whether aged 23 or 63—must remember that as you get older, you may consume from those categories that tend to inflate faster. And it’s later in life that you likely want the comforts money can buy.
As mentioned, inflation’s long-term annual average is about 3%.7 Sometimes it’s been much higher (1970s and early 1980s), and sometimes much lower. Hard to know where it will go in the future, but a safe place to start for a projection is the long-term historical average, knowing you will go through spurts of higher and maybe lower levels in the future.
Three percent may not seem like much. But don’t forget the power of compounding! Long term, inflation can take a serious whack at your purchasing power.
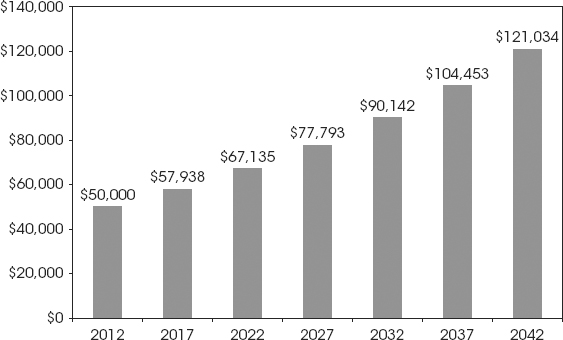
Say you’re 65 and retiring in 2012 and need about $50,000 a year to cover living expenses. If, over the long future ahead, inflation continues at that average rate, in 20 years when you’re 85, you’ll need over $90,000 to maintain your quality of life. In 30 years, you’ll need over $120,000. Figure 2.2 shows the insidious impact inflation has on purchasing power and how much more you need to just maintain the status quo.
Figure 2.2 Maintaining Purchasing Power
Source: Global Financial Data, Inc., as of 05/22/2012, CPI annualized rate of return from 12/31/1925 to 12/31/2011 was 3.0%.
Said another way, if you stashed $1 million under your mattress, in 30 years, that money would be worth around $400,000. You did nothing—you experienced no market-like volatility. Yet you still lost huge purchasing power!
Now, maybe your cost of living falls—you aren’t taking annual ski trips at age 85. But is it possible, as you age, you have other expenses? Pricier ones from those faster-inflating categories like medical care, pharmaceuticals, etc.? This is a major reason many investors do need some growth and true capital preservation often isn’t an appropriate goal for folks with long-term time horizons (i.e., most folks reading this book).
Now you have an idea of a clear way to articulate your goals, even if we haven’t gotten specific yet. The next chapter covers why having clear goals is so important—because they aid in making the most critical decision of all.
Notes
1. Dalbar, Inc., “2012 Quantitative Analysis of Investor Behavior,” April 2012.
2. Global Financial Data, Inc., as of 05/22/2012, S&P 500 Total Return Index from 12/31/1991 to 12/31/2011. The S&P 500 Total Return Index is based upon GFD calculations of total returns before 1971. These are estimates by GFD to calculate the values of the S&P Composite before 1971 and are not official values. GFD used data from the Cowles Commission and from S&P itself to calculate total returns for the S&P Composite using the S&P Composite Price Index and dividend yields through 1970, official monthly numbers from 1971 to 1987 and official daily data from 1988 on.
3. See note 1.
4. George H. Hemple, The Postwar Quality of State and Local Debt (Washington, DC: National Bureau of Economic Research, 1971), www.nber.org/books/hemp71-1. (accessed 06/19/2012).
5. Bloomberg Finance L.P., as of 06/19/2012.
6. Global Financial Data, Inc., as of 05/22/2012, Consumer Price Index return from 12/31/1925 to 12/31/2011.
7. Ibid.
* The Fisher Investments Private Client Group (FI PCG) Global Total Return (GTR) strategy was incepted on January 1, 1995, and is managed against the MSCI World Index. For the period from inception through June 30, 2012, performance returns (net of advisory fees, commissions and other expenses, and reflecting reinvestment of dividends and other earnings) of the FI PCG GTR composite exceeded total returns of the MSCI World Index. Past performance is no guarantee of future returns. Investing in stock markets involves the risk of loss.