Figure 3.1 The Asset Allocation Impact—70/20/10
Note: Forward-looking return attribution is an approximation intended for illustrative purposes and should not be considered a forecast of future returns or return attribution.

Why is being as specific as possible about goals so critical for investors? Because goals play a crucial part in determining benchmark.
Many argue (correctly, in my view) the asset allocation decision is the most important driver of investment returns. (For relative newbies, asset allocation is the selection of stocks, bonds, cash and/or other securities, and in what percentages.) And it is! Very important!
But my view is the benchmark effectively is your long-term asset allocation decision. It will drive and guide tactical asset allocation decisions and any other later investing decisions you make. Picking the appropriate benchmark can mean the difference between increasing the odds of having the retirement you plan for and being unpleasantly surprised far too late to do much about it. That’s no way to plan your prosperity.
This chapter covers:
What exactly is a benchmark? A benchmark is your portfolio road map, but it’s also a measuring stick for telling you what’s reasonable to expect and how good a job you’re doing getting there.
But more simply, a benchmark is any well-constructed index. By “well constructed,” I mean market capitalization-weighted (like the S&P 500 index or the MSCI World or ACWI indexes) and not price weighted (like the Dow).
The Dow is a popular but near-useless stock index that survives mostly out of tradition. I’ve written extensively on why you should ignore the Dow in my other books, and if you care to read more, I direct you to The Only Three Questions That Still Count or Appendix A (which reprints the pertinent chapter from my 2010 book, Debunkery). But briefly, the price-weighted construction means a stock with a higher price per share has more influence on index performance than a stock with a lower price per share—even if the lower-price-per-share stock is from a firm that’s vastly larger in size (i.e., market capitalization). And year to year, index performance can get heavily skewed—even be arbitrary—based on which stocks split versus which don’t and/or whether high- or low-priced stocks do better. Priced-weighted indexes don’t reflect economic reality. And you want a benchmark that reflects reality.
Instead, use a market cap-weighted index—there are plenty. (Most major indexes now are market cap weighted. The industry has largely moved away from price weighting, recognizing the major drawbacks.) What’s more, the benchmark can be all stock, all fixed income or blended—60% stocks/40% fixed income or any other mix. It can be all US or all global or all Denmark or all Djibouti. (Though the all-Denmark or all-Djibouti benchmarks will be much narrower and therefore likely much more volatile on average—Djibouti more than Denmark.)
The S&P 500 Total Return Index is a fine all-US equity benchmark. I believe broader is better—allows for more diversification, which finance theory tells us mitigates risk. And broader allows for more opportunities to enhance performance, if you care to. You can’t get broader than a global index, so a good benchmark might be the MSCI World Index, which includes developed economies. Or the MSCI All-Country World Index (ACWI), which adds in developing countries and is even broader.
Once you select a benchmark, it’s yours unless something material changes about your situation or goals. Which is why it’s critical you select carefully. (Hence, the purpose of this book.)
How is the benchmark a road map? It tells you from a high level what to include in your portfolio. If you have an all-equity global benchmark, then your asset allocation should be 100% global stocks—most of the time. If the benchmark is 50% US/50% non-US, your portfolio should be close to that—usually. (We get to exceptions later.) Just as you wouldn’t get into your car to drive cross-country without a map or a GPS, you don’t want to start managing a portfolio (or let someone else do it) without a benchmark—you can end up lost either way.
The benchmark also is a measuring stick. First, if your index has a long enough history (a good one should), it can give you a reasonable framework for shaping forward-looking return expectations.
Which means if your benchmark has a long history of annualizing about 6% (as a blended benchmark might), you probably shouldn’t count on its annualizing 10% over the 30 years ahead. Now, that doesn’t mean a benchmark that has annualized 10% over very long past periods (like many broad stock indexes have) will annualize 10% over the long period ahead. Far from it! But again, it’s about setting reasonable expectations. (More on this in Chapter 5.)
Second, the benchmark lets you measure how you’re doing. If your benchmark is the MSCI World Index because your goals indicate you need something close to equity-like returns, and for the last five years you’ve annualized an 8% lag, something about your portfolio execution is probably off.
By the same token, if you beat your index by a wide margin, that may feel great! But it’s a major sign you’re taking on vastly more than benchmark-like risk. If your benchmark is up 20% in one year (as can happen in a bull market), but you’re up 40%—enjoy it! But reassess your strategy—fast. You might have made some big bets—maybe by concentrating heavily in just a few narrow categories or even a few stocks—and been right but also very, very lucky. If you beat your benchmark by a wide margin, remember luck goes the other way, too, and you can just as easily lag it by the same amount. That you won’t like.
The benchmark can be your leash, keeping you disciplined. Be very similar to your benchmark and you’ll likely get similar-to-benchmark returns. This means you’ll endure whatever volatility your benchmark doles out (and yes, bond indexes experience price volatility, too). You should expect it. But as long as you stay disciplined to your benchmark, over time, it should get you where you need to go (provided you pick the right one). The more you deviate from your benchmark, the more your returns will differ. And that can be fine! That’s how you can outperform it over time, if that’s your goal (and if it’s done right). But you don’t want to aim to beat your benchmark by any more than you’re prepared to lag it in a given year.
If the benchmark is so important, how do you pick it? Your benchmark is determined by your return expectations and cash flow needs (i.e., the goals we discussed in Chapter 2 and will discuss more in Chapters 5 and 6) but also your time horizon—which is how long you need your assets to work for you (discussed more in Chapter 4).
Then, too, you must consider if you have any particular peculiarities unique to you. For example, many people don’t want to invest in tobacco or other so-called sin stocks like gambling, alcohol, etc. For that, you need a benchmark ex-sin, which is easy to do and very common. Or maybe there’s some other category of stock you just can’t abide—whatever it is, you can have a benchmark that allows for your personal preferences.
Or maybe you’re on the board of directors or a senior manager for a publicly traded firm. Often, those folks have certain rules governing when they can and can’t sell their firm’s stock. If this is you, you may decide to just not hold the stock at all—or maybe hold it and never sell it. That would require a slight benchmark tweak.
Also, you must ultimately be comfortable with your benchmark. For example, if the thought of investing in foreign stocks gives you incurable hives, then fortunately for Americans, we have a very deep and broad stock market—a US-only equity benchmark would be fine. (On the flip side, plenty of US investors fret about America’s direction and the state of America’s economy. If this is you, that’s yet another reason to diversify and invest globally!)
If my view is global is better, why is a US-only equity benchmark ok? Because finance theory is clear: All major equity categories, if well-constructed and accounted for properly, should yield similar returns over very long time periods.
However, over shorter periods, index performance can vary wildly. Really wildly! A narrow category like a single country or single sector can be much more volatile year to year than broader markets. For example, many investors remember well the 2000 Tech bubble crash. The Tech-heavy Nasdaq fell −77.9% top to bottom—much more than the S&P 500 (down −47.4% top to bottom) and the MSCI World (down −49.4%).1 But given longer periods, performance discrepancies start fading away—and differences in annualized returns can be attributed to weird, unpredictable statistical quirks, not any inherent category superiority or lack thereof. Fundamentally, no one category is superior to another long term, which means no one category should be expected to have superior return characteristics.
However, finance theory is also clear: The broader the category, the lower the expected volatility. Which is why, all else being equal, you should prefer global for the equity portion of a benchmark. You can’t get broader than global.
This doesn’t mean you won’t experience market-like volatility in a global portfolio. You will! There’s no avoiding that if you own stocks. But the much wilder swings inherent in narrow categories do get mitigated. (Again, think Tech in 2000.)
Still, if long-term performance should be similar, who cares if your path is especially bumpy? Right? Maybe, except market-like volatility can be trying enough. If you want to increase the odds you stick with an appropriate strategy, amping up volatility probably isn’t a good strategy. If broad markets are down 30% in any given year (as can happen during a bear market) and you’re down 70% or more because you’re more concentrated, it can be hard to say to yourself, “Self, I know I’m down much more than the broad market, but I can rest assured that all well-constructed categories should, over long periods, net similar returns.” I’ve been in the business a long time, and I know some cool-as-cucumber characters, but I don’t know anyone who’s that cool.
That’s one side of a broad benchmark. The other side is it gives you more opportunities to enhance performance, if you so choose, via active management—which we’ll get to in a bit. So, sure, you can use a US-only benchmark—the S&P 500 or MSCI USA is sufficiently broad, and US capital markets are very diversified. But if you can handle foreign investing, the benefits of an even broader benchmark can more than outweigh any initial jitters you might have if you’ve never gone global before.
So the benchmark is, effectively, your long-term asset allocation decision, which is indeed the biggest driver of portfolio returns, long term. How big of an impact is debatable. An academic study by Gary Brinson, Randolph Hood and Gilbert Beebower posits 90% of your portfolio return is driven by asset allocation—the mix of stocks, bonds, cash or other securities.
At my firm, we get a bit more granular. We believe about 70% of portfolio return is determined by the high-level stocks/bonds/cash/other securities decision and about 20% is driven by sub-asset allocation decisions—that is, what kinds of securities you are holding. (See Figure 3.1.) Are you holding more big-cap stocks or small? Growth or value? What is your weighting in the major sectors—Energy, Industrials, Materials, Financials, etc.? What about sub-industry selection? For bonds, are you holding Treasurys, munis or corporates? What credit rating? What duration? And so on.
Figure 3.1 The Asset Allocation Impact—70/20/10
Note: Forward-looking return attribution is an approximation intended for illustrative purposes and should not be considered a forecast of future returns or return attribution.
But most modern practitioners agree only a relatively small amount of performance over time is driven by the individual security decision—i.e., whether you hold Merck or Pfizer, Coke or Pepsi, a Bank of America or Citigroup bond, etc.
Does that mean stock selection doesn’t matter? No—stock selection does matter, but it’s a less critical factor over time than many believe. In short spurts, stock selection can certainly detract from or add to performance. But in a year stocks are down big—like 2001 or 2008—you might be the world’s best stock picker, but knowing that Stock ABC would edge out Stock DEF didn’t help much if they were both down big.
What’s more, over long periods, stocks tend to act relatively similar to their peer group. Figure 3.2 shows the performance of Merck and GlaxoSmithKline—both big pharmaceutical firms—one US, one UK. During the entirety of the 1990s, these two tracked closely to one another—deviating now and then. But over those 10 years, Merck returned 552% and Glaxo 546%.2 Agonizing over which one to hold didn’t add much to performance.
Figure 3.2 Same Sector, Similar Performance
Source: Thomson Reuters, MRK and GSK total return from 12/29/1989 to 12/31/1999.
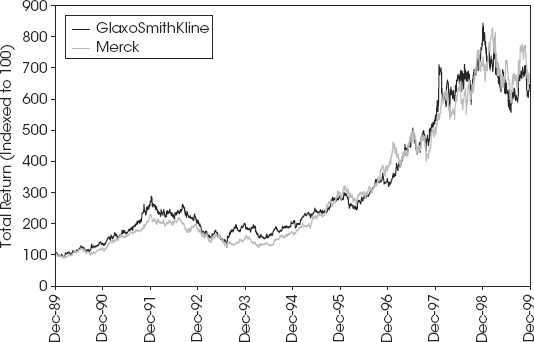
Stock peers don’t always track so closely—there can be huge divergences tied to firm-specific issues, good or bad. But if you lack the time, skill and/or inclination to do in-depth stock research, know that the bigger decisions on asset allocation and sub-asset allocation will likely pack more wallop over time. And in my view, it’s easier to pick a selection of stocks that are good representations of the categories you’re trying to capture (what’s known as “top-down” investing) than sifting through the entire universe of stocks trying to find potential gems (known as “bottom up”).
What’s more, if you have a relatively smaller pool of assets, it may not make much sense to hold individual stocks anyway—not yet. A well-diversified portfolio might mean anywhere between 50 and 70 holdings if you’re global—give or take, depending on market conditions. But if you’re just starting to invest—even if you have as much as $100,000—you may get diversified, but you can spend a massive chunk on transaction fees.
By the time you get closer to $500,000 or so, my view is individual securities are much more efficient. They’re cheap to buy and sell, and free to hold. In a taxable account, those gains and losses are yours. You can carry forward losses forever to offset gains and mitigate your tax bill. But when you buy funds, the costs are typically higher—often much higher. And you could very well have an unrealized loss in a calendar year but still get a bill from the fund manager for capital gains taxes. Why? You have no control over when other fund holders buy and sell—and that can mean increased costs for you.
But for smaller pools, the benefit of diversification can far outweigh the relatively higher cost (on average) of a fund. Or you can buy exchange-traded funds (ETFs), which are typically a cheap way to diversify. And they trade like stocks, so you get the same individual security tax advantages.
Another way to consider the importance of stock selection? If you’re well diversified and holding 50 or 70 stocks, if a single stock crashes overnight for some issue unique to that stock—major scandal, hugely surprising earnings miss, whatever—the relative impact on your portfolio is limited. If a position that’s 2% of your portfolio goes to zero (pretty rare), that’s not disaster.
Many folks tend to like the concept that single-stock performance gets muted on the downside, but then see diversification as a hindrance to getting grand slams on the upside. But they’re two sides of the same coin. If you want the opportunity for a stock to go on a wild tear, you must accept that same stock can crater.
With a well-diversified portfolio, you won’t experience the giddy highs of putting it all in a stock that pops 1,000% fast (also pretty rare). But you won’t utterly be crushed, either. Stocks are volatile enough without dealing with that kind of potential hyper-volatility. Stocks can and do flat line. That’s why the bigger, high-level asset allocation decisions are much more impactful over time.
Since asset allocation is so important, advice on what’s the “right” asset allocation abounds. Something you commonly read (or hear): Simply take 100 (sometimes it’s 120), subtract your age and that’s how much you should have in stocks. Adherents of this rule of thumb believe, if you’re 60, you should have 40% stocks, 60% fixed income. If you’re 80, it’s 20/80. If you’re 20, it’s 80/20.
Sounds easy! It’s a concrete prescription, which a lot of people like. Eliminates any guesswork. Except this rule of thumb presumes the only thing that matters is your age. Not your goals. Not your cash flow needs. Not your time horizon. Not your intended purpose for your money. Not your spouse! One input and only one input matters—your birth year.
You can’t get much more cookie cutter than that.
See it another way. There are two investors, Jim and Bob, both age 60, each with $2 million saved. The subtract-your-age crew would say, definitively, both should have 40% stocks and 60% fixed income. Identical portfolios!
But hang on! Jim is in excellent health. His wife, Mary, is 10 years younger and also in excellent health—they both love skiing with the kids and play tennis twice a week. They own their own consulting firm, and just now, the business is really taking off. Neither Jim nor his wife plans on retiring for another 10 years. Love what they do! Jim’s and Mary’s parents are all still alive—Jim’s in their 90s and Mary’s in their 80s. Mary’s dad still golfs six days a week. In 10 years, Mary and Jim plan on selling the business and traveling. They hope the business sale proceeds (which could be sizable) plus portfolio growth and any additional savings will fund their lifestyle. Then, too, it’s very important to them they leave sizable legacies for their grandkids.
Bob is a widower. His parents died in their early 70s of natural causes. He’s not very active, likes just spending time with his grandchildren and recently moved to be closer to them. He’s already had two heart attacks and a quadruple bypass. The doctor told him stress was no good for him, so he retired last year. He lives off his portfolio and plans on taking about $100,000 a year in cash flow—the home close to his kids is pricey but worth it, in his view. And he’s helping out with private school tuition for the grandkids. He also might need more cash flow in the future for medical costs. His kids do fine, so if there’s any money left over for them, that’s gravy. He’s focused on not being a burden on them and helping out where he can.
Bob and Jim should have identical portfolios?
Jim is planning on at least a 40-year time horizon—the odds Mary lives to her 90s are good. And they don’t need cash flow for at least 10 years—and cash flow they take likely funds mostly discretionary spending. And they’re very focused on growth. Bob isn’t—he’s focused much more on cash flow now to fund life’s necessities. And while he could certainly live another 20 years, he is realistic about his health condition and knows his time horizon is likely shorter.
Is it possible investors with very different goals and time horizons have the same benchmark? Of course! But the driving factor isn’t and shouldn’t be age alone. It’s a factor—it figures into time horizon. But it’s just one factor.
You may read this chapter and think, “What’s the big difference between benchmark and asset allocation? Aren’t they the same thing?”
Depends on which kind of asset allocation you mean! Effectively, your benchmark is your long-term asset allocation. You can think of them interchangeably if you like. But whereas your benchmark (and long-term asset allocation) shouldn’t change much (if at all), your tactical asset allocation can be more flexible.
Why doesn’t benchmark change much? The primary determinants of your benchmark are, of course, your return expectations, cash flow needs, time horizon and any other additional personal preference. These things likely won’t change very much or very often.
They can change, of course. You might discover later on you need more (or less) income than you previously thought. A 70-year-old widower might remarry a 50-year-old—that would likely change the time horizon. Every year, you should review your goals and time horizon to make sure your benchmark remains the right one for you. But it should take a fairly material change in your circumstances to alter your benchmark.
Why is sticking with your benchmark so critical? Changing it too often could be simple heat chasing—and heat chasing isn’t a great way to run a disciplined investment strategy.
Suppose your benchmark is the global MSCI World Index. Maybe you go through a few years where US stocks hugely outperform foreign, so your global index underperforms the S&P 500. Your caveman brain may tell you that you picked wrong and you’re missing out. (Kill saber-toothed tiger! Feed family for months!) After all, don’t the past few years of US outperformance tell you US stocks are inherently better than foreign? (Answer: No.) Then, you switch your benchmark—just in time for leadership to rotate to non-US stocks. Leadership of major categories rotates—always and irregularly. Now, your S&P 500 benchmark goes through a long period of underperforming most major foreign and global indexes. And then you might be tempted to switch again, just for that relatively hotter index to go cool again. Flip, flop, flip—meanwhile, you’re overall underperforming how you would have done had you sat tight with a benchmark that was appropriate for you.
This isn’t just hypothetical—for much of the 1980s, non-US stocks hugely beat US stocks, only for US stocks to dominate in the 1990s. Then, during the 2000s, foreign overall led again. Within, there were shorter spurts when performance flip-flopped irregularly, but neither category has been nor will be permanently superior—nor are outperformance patterns predictive of future patterns.
Know this: Whatever your benchmark, there will be one (or many) that beats it over the course of a year or even a few years or even a decade! But recall—if given enough time, all well-constructed equity categories should net similar returns, though traveling different paths.
Which is why, once you pick a benchmark, you want to stick with it unless something material happens to your circumstances or goals that would make a change appropriate.
So your benchmark shouldn’t change much, but your tactical asset allocation may. For investors who actively manage their portfolios (or have someone else do it for them), in my view, a flexible asset allocation is appropriate.
Many people fall into a trap of having a static asset allocation. They may get (hear or read) advice that you should always have fixed allocations of whatever categories—big- and small-cap growth, big- and small-cap value. Or maybe they focus on sectors. Or always 60% stocks and 30% fixed income and 10% cash. Or maybe they focus on categorizing some other way. And they always try to match that static asset allocation, rebalancing occasionally if one category gets out of whack.
This is problematic in a few ways.
First, your benchmark isn’t static! It’s fluid—changing with market conditions. Sometimes growth is in favor, and those categories increase in relative proportion of the benchmark. Sometimes one or a few sectors outperform for a long time, while others underperform—and their relative weights shift.
If you insist on maintaining static allocations, you could end up holding a huge allocation of a sector that underperforms, which would unnecessarily ding your returns. Or you may be unwittingly underweighting a top-performing sector and miss returns that way.
Figures 3.3, 3.4 and 3.5 show sector allocation weights of the MSCI World Index as of January 1, 2000, 2005 and 2010. Some sectors didn’t shift much; others changed a fair bit.
Figure 3.3 MSCI World Sector Weights: 2000
Source: Thomson Reuters, MSCI World Index3 sector weights as of 12/31/1999.
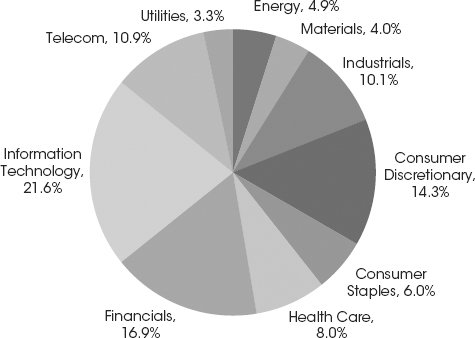
Figure 3.4 MSCI World Sector Weights: 2005
Source: Thomson Reuters, MSCI World Index4 sector weights as of 12/31/2004.
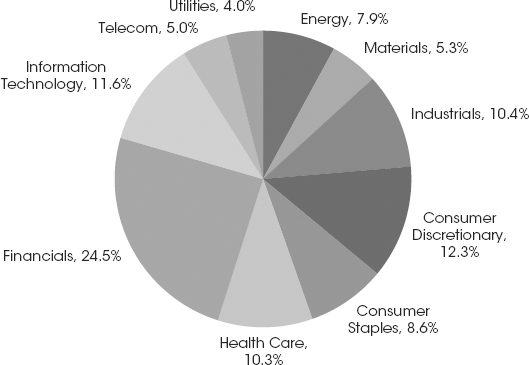
Figure 3.5 MSCI World Sector Weights: 2010
Source: Thomson Reuters, MSCI World Index5 sector weights as of 12/31/2009.

In 2000, near the top of the Tech bubble, Technology was almost 22% of the global stock market (by market cap). By 2005, it had cratered and come back a bit, but relatively was still just 11.6% of the global market—increasing (with volatility) to 12.0% by 2010.
Financials was 16.9% of the global stock market in 2000—growing to 24.5% in 2005 before it got hit hard in the 2008 Financials-led bear market. It sprang back in the early stages of the new bull market in 2009—as the sector punished most in the bear often does—then lagged the broader market thereafter. As of 2010, it was 20.6% of the global market.
It might seem obvious sectors that led bear markets would shift—but other not-so-directly-involved sectors shifted over the decade, too. Telecom more than halved its relative weight from 2000 to 2005 and shrank still further relatively by 2010—it also got beat up in the Tech bubble. Consumer Staples went from 6% of the world market to 10.2% in 2010. Materials grew substantially in relative weight from 2000 to 2010, too.
So your benchmark changes—and if you’re static, you can inadvertently expose yourself to additional benchmark risk. What’s more, if you pick static allocations, what’s behind those decisions? Are you holding big allocations of categories that have performed well in recent years and, thereby, unintentionally chasing heat?
Being flexible lets you more closely reflect your benchmark. The more closely you resemble your benchmark, the lower the odds your performance will deviate and you’ll lag. Yes, if your benchmark is down, you’ll likely be down, too. But if you have a long time horizon and pick an appropriate benchmark based on your goals, again, the benchmark should, over time, get you where you want to go.
The flipside of that is being static also takes away opportunities to enhance performance. If you, like many investors, want to “beat the market” (henceforth, think of it as outperforming your benchmark), that gets tougher to do if you’re static.
For example, if you have a strong conviction large-cap stocks will outperform small cap, or Energy is likely to outperform the broad market, or . . . or . . . or . . . you can shift to overweight those categories. If you’re right, you’ve participated more in a category that outperformed. By the same token, if you think certain categories are likely to underperform, you can underweight those—which also enhances performance relative to the benchmark if you’re right.
You won’t be right with every bet you make. Far from it! Get used to that right now. You can and will make bets that are wrong. But the aim isn’t to be error free—which no one in the history of professional money management has ever been. (Even the all-time greats made and make tons of decisions that later are proven wrong.) The aim is to be right more than wrong, on average, over your long time horizon—and that can add relative value.
Then, too, there may come a time when you’re strongly yet reasonably convinced stocks will be in a sustained bear market. You can also enhance returns relative to your benchmark by shifting heavily out of stocks into fixed income, cash and/or other securities. Again, this is difficult to do—perhaps the most difficult move investors can make because it may be a significant shift away from the benchmark. And if you’re wrong and defensive while stocks take off, that can really hurt relative returns. But done well even once or twice during your long time horizon, you can add significant relative value.
If you adhere to a rigid asset allocation, you miss opportunities to enhance performance and manage risk by being flexible. (For how to make those decisions, I direct you to The Only Three Questions That Still Count, which gets more into the nitty-gritty of tactical portfolio decision making.)
Now, I will reverse myself a bit. Many investors prefer passive investing to active. Passive investors pick a benchmark and mimic it as closely as possible, often using ETFs or index funds. You could call that a form of rigid asset allocation, i.e., never deviating from the benchmark.
Passive investors (when doing it correctly) believe (as I do) that long term, their benchmark will get them where they need to go. They don’t have a goal of beating the market; rather, they want to just match it minus any transaction fees, which should be minimal if done right.
Considering investors on average not only don’t beat the market but actually badly lag it, just meeting your benchmark is a fine result. A great one! Better than what most investors do and better even than most professionals.
But even if you decide to do passive, if you’re mimicking your benchmark using several (or many) securities, you still must check in to make sure your portfolio hasn’t gotten out of whack relative to your benchmark—simple rebalancing. Or you could buy a single ETF that perfectly mimics your benchmark (usually). But then, the underlying asset allocation will still be fluid as sectors and categories trade leadership.
Some readers might find it hard to believe so many investors badly lag the market if passive investing is so easy. But that’s the problem—passive isn’t easy. Done right (which many investors don’t), it’s very, very hard. Which is exactly why investors lag.
To do passive right, first, you must believe with your heart and soul and very DNA (as I do) that capitalism is a great and powerful force for societal good. That the powers of human ingenuity and profit motive mean, long term, the world isn’t doomed. That the opposite is true—that future innovations will be more than equal to smack down or at least greatly mitigate the challenges facing humanity. And you must believe earnings will keep rising in irregular fashion over time—hence, stocks will keep rising in irregular fashion over time.
What’s more, you must have ice water in your veins. Passive investors would have had to sit through the big 2001–2002 and 2008 bear markets and known downward volatility—even huge volatility—is normal. And though painful, near-term losses eventually get wiped away by future and bigger upward volatility (yes, volatility goes both ways). They had to not panic and sell. They had to resist reallocating to categories they deemed “safe” at the time.
Passive investors must believe with every fiber, if they have a long time horizon, their long-term results won’t be damaged by their portfolios, being down—even down big—over relatively short periods like a year or even a few years.
That’s hard enough to do—mentally and emotionally. But equally as hard, they must calmly sit through periods when the market is up big—satisfied with just matching the benchmark. They must not get carried away by massive returns in a hot category and must not try to capture some excess return there.
They must simply be passive and believe, long term, stocks are likely to continue delivering superior returns at a premium over other similarly liquid asset classes. They can’t tinker. They can’t freak out. They can’t in-and-out every three or so years as average mutual fund investors have done (as discussed in Chapter 2). And I’ve been in this business long enough and have studied behavioral finance enough to know that’s a very, very tough thing for many investors to do.
With that, we’re ready to delve in more depth into the determinants for benchmark selection, starting with time horizon.
Notes
1. Thomson Reuters, Global Financial Data, Inc., as of 07/10/2012, Nasdaq price returns from 03/10/2000 to 10/09/2002, S&P 500 total returns from 03/24/2000 to 10/09/2002, MSCI world total returns with net dividends from 03/27/2000 and 10/09/2002.
2. Thomson Reuters, MRK and GSK total return, from 12/29/1989 to 12/31/1999.
3. MSCI. The MSCI information may only be used for your internal use, may not be reproduced or redisseminated in any form and may not be used to create any financial instruments or products or any indices. The MSCI information is provided on an “as is” basis and the user of this information assumes the entire risk of any use made of this information. MSCI, each of its affiliates and each other person involved in or related to compiling, computing or creating any MSCI information (collectively, the “MSCI Parties”) expressly disclaims all warranties (including, without limitation, any warranties of originality, accuracy, completeness, timeliness, non-infringement, merchantability and fitness for a particular purpose) with respect to this information. Without limiting any of the foregoing, in no event shall any MSCI Party have any liability for any direct, indirect, special, incidental, punitive, consequential (including, without limitation, lost profits) or any other damages.
4. Ibid.
5. Ibid.