It's best to use historical monitoring information when all of it is available from the same place and on the same timescale. Most monitoring systems are designed for generic purposes, while allowing application and system developers to integrate their specific checks with the monitoring infrastructure. This is possible through a plugin architecture. Adding new kinds of data inputs to them means installing a plugin. Sometimes, you may need to write or develop this plugin, but writing a plugin for something such as Cacti is easy. You just have to write a script that outputs monitored values in simple text format.
In most common scenarios, the monitoring system is centralized and data is collected directly (and remotely) by the system itself or through some distributed components that are responsible for sending the observed metrics back to the main node.
As far as PostgreSQL is concerned, some useful things to include in graphs are the number of connections, disk usage, number of queries, number of WAL files, most numbers from pg_stat_user_tables and pg_stat_user_indexes, and so on. One Swiss Army knife script, which can be used from both Cacti and Nagios/Icinga, is check_postgres. It is available at http://bucardo.org/wiki/Check_postgres. It has ready-made reporting actions for a large array of things worth monitoring in PostgreSQL.
For Munin, there are some PostgreSQL plugins available at the Munin plugin repository at https://github.com/munin-monitoring/contrib/tree/master/plugins/postgresql.
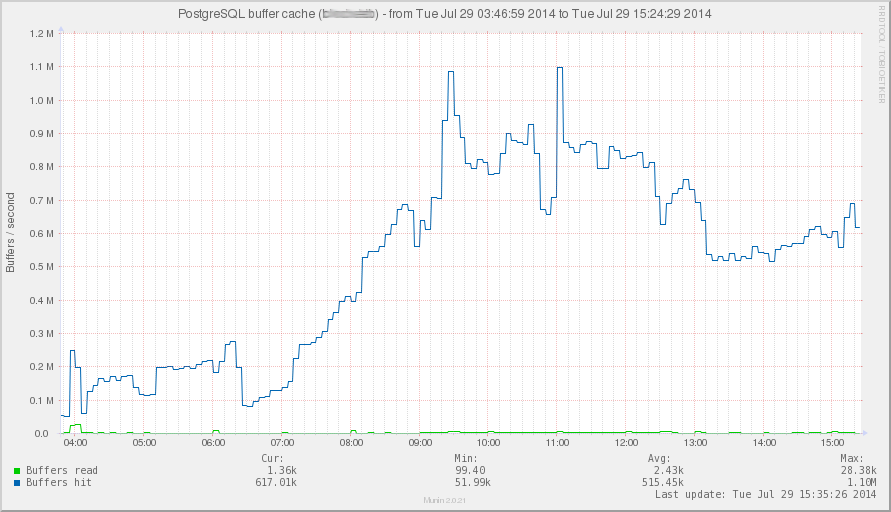
The following screenshot shows a Munin graph about PostgreSQL buffer cache hits for a specific database, where cache hits (the blue line) dominate reads from the disk (the green line):