Chapter 2
Signs of Strength in a Breakout
The minimum criterion for a breakout to be successful is that a trader could enter on the breakout and make at least a scalper's profit. The strongest breakouts will result in strong trends that can last for dozens of bars. There are early signs that increase the likelihood that a breakout will be strong enough to run to one or more measured move targets. For example, the more of the following characteristics that a bull breakout has, the more likely the breakout will be strong:
- The breakout bar has a large bull trend body and small tails or no tails. The larger the bar, the more likely the breakout will succeed.
- If the volume is 10 to 20 times the average volume of recent bars, the chance of follow-through buying and a possible measured move increases.
- The spike goes very far, lasts several bars, and breaks several resistance levels like the moving average, prior swing highs, and trend lines, and each by many ticks.
- As the first bar of the breakout bar is forming, it spends most of its time near its high and the pullbacks are small (less than a quarter of the height of the growing bar).
- There is a sense of urgency. You feel like you have to buy but you want a pullback, yet it never comes.
- The next two or three bars also have bull bodies that are at least the average size of the recent bull and bear bodies. Even if the bodies are relatively small and the tails are prominent, if the follow-through bar (the bar after the initial breakout bar) is large, the odds of the trend continuing are greater.
- The spike grows to five to 10 bars without pulling back for more than a bar or so.
- As a bull breakout goes above a prior significant swing high, the move above the high goes far enough for scalpers to make a profit if they entered on a stop at one tick above that swing high.
- One or more bars in the spike has a low that is at or just one tick below the close of the prior bar.
- One or more bars in the spike has an open that is above the close of the prior bar.
- One or more bars in the spike has a close on its high or just one tick below its high.
- The low of the bar after a bull trend bar is at or above the high of the bar before the bull trend bar, creating a micro gap, which is a sign of strength. These gaps sometimes become measuring gaps. Although it is not significant to trading, they probably represent the space between a smaller time frame Elliott wave 1 high and a wave 4 pullback, which can touch but not overlap.
- The overall context makes a breakout likely, like the resumption of a trend after a pullback, or a higher low or lower low test of the bear low after a strong break above the bear trend line.
- The market has had several strong bull trend days recently.
- There was growing buying pressure in the trading range, represented by many large bull trend bars, and the bull trend bars were clearly more prominent than the bear trend bars in the range.
- The first pullback occurs only after three or more bars of breaking out.
- The first pullback lasts only one or two bars and it follows a bar that is not a strong bear reversal bar.
- The first pullback does not reach the breakout point and does not hit a breakeven stop (the entry price).
- The breakout reverses many recent closes and highs. For example, when there is a bear channel and a large bull bar forms, this breakout bar has a high and close that are above the highs and closes of five or even 20 or more bars. A large number of bars reversed by the close of the bull bar is a stronger sign than a similar number of bars reversed by its high.
The more of the following characteristics that a bull breakout has, the more likely it will fail and lead to either a trading range or a reversal:
- The breakout bar has a small or average-size bull trend body and a large tail on top.
- The next bar has a bear body and is either a bear reversal bar or a bear inside bar; that bar closes on or near its low, and the body is about the size of the average bodies of the bars before the breakout (not just a one-tick-tall bear body).
- The overall context makes a breakout unlikely, like a rally to test the high of a trading range day, but the rally has bear bars, many overlapping bars, bars with prominent tails, and a couple of pullbacks along the way.
- The market has been in a trading range for several days.
- The bar after the breakout bar is a strong bear reversal bar or a bear inside bar.
- The bar after a bull trend bar has a low that is below the high of the bar before the bull trend bar.
- The first pullback occurs two bars after the reversal.
- The pullback extends for several bars.
- The trend resumption after the pullback stalls and the market forms a lower high with a bear signal bar.
- The spike breaks above a resistance level like a swing high, a bear trend line, or a bull trend channel line by only a tick or so and then reverses down.
- The spike barely breaks above a single resistance level but pulls back before breaking above other levels that are just a little higher.
- A trader who bought on a stop above a prior swing high would not be able to make a scalper's profit before there was a pullback.
- As the breakout bar is forming, it pulls back more than two-thirds of the height of the bar.
- As the breakout bar is forming, it pulls back for at least a third of its height two or more times.
- The pullback falls below the breakout point. There are no gaps between the low of any bar and the high of the bar two bars earlier.
- The pullback falls below the low of the first bar of the spike.
- The pullback hits the breakeven stop.
- There is a sense of confusion. You feel like you are not certain whether the breakout will succeed or fail.
The opposite of all of the preceding is true for bear breakouts. The more of the following characteristics that a bear breakout has, the more likely the breakout will be strong:
- The breakout bar has a large bear trend body and small tails or no tails. The larger the bar, the more likely the breakout will succeed.
- If the volume is 10 to 20 times the average volume of recent bars, the chance of follow-through selling and a possible measured move down increases.
- The spike goes very far, lasts several bars, and breaks several support levels like the moving average, prior swing lows, and trend lines, and each by many ticks.
- As the first bar of the breakout bar is forming, it spends most of its time near its low and the pullbacks are small (less than a quarter of the height of the growing bar).
- There is a sense of urgency. You feel like you have to sell but you want a pullback, yet it never comes.
- The next two or three bars also have bear bodies that are at least the average size of the recent bull and bear bodies. Even if the bodies are relatively small and the tails are prominent, if the follow-through bar (the bar after the initial breakout bar) is large, the odds of the trend continuing are greater.
- The spike grows to five to 10 bars without pulling back for more than a bar or so.
- As a bear breakout goes below a prior significant swing low, the move below the low goes far enough for scalpers to make a profit if they entered on a stop at one tick below that swing low.
- One or more bars in the spike has a high that is at or just one tick above the close of the prior bar.
- One or more bars in the spike has an open that is below the close of the prior bar.
- One or more bars in the spike has a close on its low or just one tick above its low.
- The high of the bar after a bear trend bar is at or below the low of the bar before the bear trend bar, creating a micro gap, which is a sign of strength. These gaps sometimes become measuring gaps. Although it is not significant to trading, they probably represent the space between a smaller time frame Elliott wave 1 low and a wave 4 pullback, which can touch but not overlap.
- The overall context makes a breakout likely, like the resumption of a trend after a pullback, or a lower high or higher high test of the bull high after a strong break below the bull trend line.
- The market has had several strong bear trend days recently.
- There was growing selling pressure in the trading range, represented by many large bear trend bars, and the bear trend bars were clearly more prominent than the bull trend bars in the range.
- The first pullback occurs only after three or more bars of breaking out.
- The first pullback lasts only one or two bars and it follows a bar that is not a strong bull reversal bar.
- The first pullback does not reach the breakout point and does not hit a breakeven stop (the entry price).
- The breakout reverses many recent closes and lows. For example, when there is a bull channel and a large bear bar forms, this breakout bar has a low and close that are below the lows and closes of five or even 20 or more bars. A large number of bars reversed by the close of the bear bar is a stronger sign than a similar number of bars reversed by its low.
The more of the following characteristics that a bear breakout has, the more likely it will fail and lead to either a trading range or a reversal:
- The breakout bar has a small or average-size bear trend body and a large tail on the bottom.
- The next bar has a bull body and is either a bull reversal bar or a bull inside bar; that bar closes on or near its high, and the body is about the size of the average bodies of the bars before the breakout (not just a one-tick-tall bull body).
- The overall context makes a breakout unlikely, like a sell-off to test the low of a trading range day, but the sell-off has bull bars, many overlapping bars, bars with prominent tails, and a couple of pullbacks along the way.
- The market has been in a trading range for several days.
- The bar after the breakout bar is a strong bull reversal bar or a bull inside bar.
- The bar after a bear trend bar has a high that is above the low of the bar before the bear trend bar.
- The first pullback occurs two bars after the reversal.
- The pullback extends for several bars.
- The trend resumption after the pullback stalls, and the market forms a higher low with a bull signal bar.
- The spike breaks below a support level like a swing low, a bull trend line, or a bear trend channel line by only a tick or so and then reverses up.
- The spike barely breaks below a single support level but pulls back before breaking below other levels that are just a little lower.
- A trader who shorted on a stop below a prior swing low would not be able to make a scalper's profit before there was a pullback.
- As the breakout bar is forming, it pulls back more than two-thirds of the height of the bar.
- As the breakout bar is forming, it pulls back for at least a third of its height two or more times.
- The pullback rallies above the breakout point. There are no gaps between the high of any bar and the low of the bar two bars earlier.
- The pullback rallies above the high of the first bar of the spike.
- The pullback hits the breakeven stop.
- There is a sense of confusion. You feel like you are not certain whether the breakout will succeed or fail.
To a trader, the breakout implies strength and a possible new trend. It follows a period of two-sided trading where the bulls and bears both agree that there is value and both are willing to take positions. During the breakout, they both now agree that the market should find value at another price and the breakout is a fast move in search of that new price. The market prefers uncertainty and quickly moves in search of it. A breakout is a period of certainty. Bulls and bears are certain that the prices within the breakout are too high in a bear breakout or too low in a bull breakout, and the odds of follow-through are usually about 60 to 70 percent. The market moves quickly in search of a price level where both the bulls and bears agree there is value for them to initiate trades. This means that there is once again uncertainty, and no one knows which side will win and succeed in creating the next breakout. Uncertainty is the hallmark of a trading range, so a breakout is a search for a trading range, for uncertainty, and a 50 percent directional probability of an equidistant move. The channel that follows the spike usually creates an approximate top and bottom of the trading range that typically follows. As the market is moving up in the channel, the directional probability of an equidistant move erodes and it actually favors a reversal when it reaches the end of the channel. This is because trading range breakouts generally fail and the odds favor a move back into the middle of the range where the directional probability is neutral. That middle of the range is the target of the breakout, and its location is unknown until after it forms.
A breakout begins with a trend bar, which can be large or small, but it is usually at least somewhat large compared to the size of the recent bars. Remember, all trend bars should be viewed as breakouts, spikes, gaps, and climaxes. When it is small, it is easy to dismiss its importance, but if it is followed by some sideways price action and then a steady directional move, a breakout is underway. The easiest breakouts to spot occur when an unusually large trend bar quickly moves the market out of a trading range and it is soon followed by other trend bars in the same direction. Whether the breakout is a single trend bar or a series of trend bars, it is a spike. As mentioned earlier, almost all trends can be considered to be some type of spike and channel trend. For example, if a bull breakout bar has a strong close and the next several bars also have strong closes, small or nonexistent tails, and trending highs and lows (no pullback bars), and there is very little overlap between the bodies of consecutive bull trend bars, then the market will likely be higher than it is at the current moment at some point before the market reverses back beyond the start of the breakout move. If the trend continues, eventually its momentum will slow and there will generally be some type of channel.
One of the most important concepts in trading is that most breakouts fail. Because of this, entering on every breakout in the direction of the breakout is a losing strategy. However, there are often price action events that increase the likelihood that a breakout will succeed. For example, if there is a strong bear trend and then a two-legged rally to the moving average, going short on the downside breakout of this bear flag is a sensible trade. However, if the market is not in a trend and there are lots of overlapping bars and many bars with large tails, the market is in balance. Both the bulls and the bears are comfortable taking positions and a trading range is developing. If the market then has a bull trend bar that extends to the top of or even above the trading range, the bears who were happy to sell in the middle of the range are going to be even more aggressive at this better price. Also, the bulls who were happy to buy in the middle of the range will become hesitant to buy higher and instead will be quick to exit at the top of the range. This behavior by the bulls and the bears creates a magnetic pull in the middle of the range, and the result is that most of the trading will be in the middle of the range. Even once the market successfully breaks out and travels for maybe a measured move equal to the height of the range, the magnetic pull will still tend to draw the market back into the range. This is what makes final flag reversals so reliable (discussed in book 3).
If you look at any chart, you will notice lots of bull and bear trend bars with relatively large bodies and small tails. Each of these is a breakout attempt and almost all fail to lead to a trend, and instead the trading range continues. On a 5 minute Emini chart, these probably represent buy and sell programs trying to move the market. Some algorithms are designed to fade these trend bars, expecting most to fail. Experienced traders will do this as well when they believe that the breakout will probably fail. For example, if there is a breakout in the form of a large bull trend bar, these programs might short on the close of the bar, above its high, on the close of the next bar or two, or below their lows. If enough program trading dollars come in on the fade side (the sell side), they will overwhelm those programs that are trying to initiate the bull trend, and the trading range will continue. Eventually, a breakout will succeed. The breakout bar will be large, the pullbacks as the bar is forming will be small, and the breakout will have good follow-through over the next several bars. The programs that are trying to fade the move are failing and they will cover their losing positions and drive the trend further. The strength will attract other trend traders, many of whom are momentum traders and quickly enter whenever they see momentum.
Once everyone is convinced that the market is now trending, it might go far before there is a pullback. Why is that? Consider an example of a market breaking into a strong bull trend with a spike formed by three strong bull trend bars. Traders believe that the market will be higher at some point before long and they are not confident that it will be lower within the next few bars. This makes bears buy back their shorts, lifting the market even more. Bulls who are underinvested believe the market is going higher in the near term and that they will make more money by simply buying at the market or on a two- or three-tick pullback than they would if they waited for an eight- or 10-tick pullback or a pullback to the moving average. This also lifts the market. Since bulls and bears are both essentially buying at the market as it is going up, the pullback never comes, or at least it does not come for five or more bars after the market is well above the current price.
This is discussed in more detail in Chapter 8, but traders are willing to buy at the market at any time in a breakout because they believe that the odds are better than 50–50 that they will make at least as many points as they are risking. When the breakout is strong, the probability is usually 60 to 70 percent or more. If they buy the 5 minute Emini on the high tick when the top of the spike is four points above the low of the spike, they believe that the odds are probably 60 percent or better that the market will go up four more points before their four-point stop is hit. How can you be sure of this? Because it is mathematically unwise to have your risk equal your reward if the chance of success is much less than 60 percent, and institutions would therefore not be taking this trade. Since the market is still going up, then institutions are taking the trade. Since the trade remains valid as long as the market stays above the bottom of the spike, they are risking to the bottom of the spike. They know that the spike usually goes up to about a measured move, so their profit target, which is their reward, is equal to their risk. If the spike grows another two points before pausing, the spike is then six points tall. If that is the end of the spike, they will assume that there is about a 60 percent chance that the market will go another six points higher before it falls six points. This means that all of the bulls who bought lower have a 60 percent chance that the market will go another six points higher before their four-point stop is hit. For example, the bulls who bought when the spike was four points tall are now risking four points to make a total of eight points on a 60 percent bet, which is a great mathematical situation. They expect that the market has a 60 percent chance of testing six points above the close of the spike, which is two points above their entry, giving them an eight-point profit target.
When a breakout is successful and leads to a trend, the momentum slows after the initial fast move, and signs of two-sided trading develop, like overlapping bars, increasing tails, trend bars in the opposite direction, and pullback bars. Even though the trend may continue for a long time, this part of the trend usually gets retraced and becomes part of a trading range. For example, in a spike and channel bull trend pattern, the spike is the breakout and the channel usually becomes the first leg of a trading range and therefore will usually be retraced. Typically, the market eventually pulls back all the way to the start of the channel, completing the second leg of the incipient trading range. In the example of that bull breakout, the market will then usually try to bounce off that support. This results in a double bottom bull flag that sometimes leads to a breakout above the new range, and other times it evolves into a protracted trading range like a tight trading range or a triangle. Less often, it is followed by a reversal.
On the 5 minute Emini chart, there are usually many attempts to break out every day but most fail after one or two trend bars. They most likely represent the start of a program trade by some institution, but they get overwhelmed by opposite programs by other institutions. When enough institutions have programs running in the same direction at the same time, their programs will be able to move the market to a new price level and the breakout will be successful. However, nothing is ever 100 percent certain and even the strongest breakouts fail about 30 percent of the time.
When a breakout is very strong, there will be three or more trend bars with small tails and very little overlap. This means that traders are not waiting for a significant pullback. They are afraid that there might not be a pullback until after the market has run a long way, and they want to be certain to capture at least part of the trend. They will enter at the market and on tiny pullbacks of one or two ticks, and their relentless orders will give the trend strength and work against the formation of a significant pullback.
The breakout bars often have large volume and sometimes they will have 10 to 20 times the volume of an average bar. The higher the volume and the more bars in the spike, the more likely it is that there will be significant follow-through. Prior to the breakout, both the bulls and the bears were scaling into their positions, fighting over control of the market and each trying to create a successful breakout in their direction. Once there is a clear breakout, the losing side will cover their large position quickly with a loss, and the winning side will enter even more aggressively. The result is one or more trend bars, often with high volume. Volume is not always especially high but when it is 10 or more times the average of the recent bars, the probability of a successful breakout, meaning that there will be follow-through for many bars, is higher. Also, volume can be unusually high on breakouts that fail within a few bars, but this is less common. Volume is not reliable enough to warrant following it, and the large trend bars that comprise the spike will already tell you whether the breakout is likely to be successful. Trying to think about the volume in addition will, more often than not, distract you and hinder your ability to trade at your best.
All successful breakouts should be viewed as spikes, since most are followed by channels and create a spike and channel trend pattern. However, the breakout can also fail and the trading range that preceded it then becomes a final flag, if it was a flag in a trend. In fact, most breakouts do fail but the breakout bar is so unremarkable that most traders don't even realize that there was an attempted breakout. Less commonly, the market can enter a tight trading range after the breakout, and this is usually followed by trend resumption, but sometimes the breakout of that tight trading range can be in the other direction, resulting in a reversal.
A breakout can be a single large trend bar or a series of large or small trend bars, and the breakout usually becomes part of one of the trend patterns previously discussed. For example, if there is a “trend from the open” bear trend, it is likely a breakout below a pattern from the previous day. If the trend is orderly, it might be followed by a tight trading range for several hours and then the day could turn into a trend resumption bear into the close. If instead the breakout is accelerating to the downside with each bar resulting in a steeper slope, and the chart assumes a parabolic and therefore climactic look, it might be followed by a pullback and then a channel. The day could become a spike and channel bear trend day.
Sometimes, after the market has been in a strong trend for many bars, it creates an unusually large trend bar in the direction of the trend. That large bar typically either becomes a breakout into an even steeper, stronger trend, or at least another leg in the trend, or can signify a climactic end of the trend. If the market pulls back for a few bars and does not retrace too much of the breakout bar, the odds of the breakout being successful are good, and traders will enter on the high 1 breakout pullback if this was a bull breakout (or short a low 1 in a bear breakout).
The trend can continue even if the pullback retraces beyond the breakout point, but the deeper the pullback, the more likely it is that the breakout will fail and the market will reverse. In this case, the large bar will represent a climactic end of the trend rather than a breakout. If the pullback is fairly deep, traders might hesitate to enter with the trend for an hour or so. For example, if there is a large bull trend bar that breaks above a swing high or trading range but the pullback is fairly deep, maybe a little below the top of the swing high, traders will not be certain if the breakout has failed or if the rally is just a little overdone. The bulls in this case often will not buy for about 10 bars or so and the market will frequently enter a small trading range. Instead of buying a high 1, they will likely wait for a high 2, especially if it forms after an hour or so. If the trading range is holding above the moving average and about an hour has passed, bulls will look to buy a two-legged sideways or down pullback. Sometimes the sideways move is followed by a second leg down. That second leg can lead to a new high, or to a trend reversal and more selling.
Once there is a pullback, which is a small trading range, traders will look for the trend to resume. The breakout from the pullback has an initial target of an approximate measured move equal to about the height of the trading range. Many traders will take partial or total profits in that area, and aggressive countertrend traders will initiate new positions.
The easiest breakout failures to spot are those where the market quickly reverses direction and does not make any significant attempt to continue in the direction of the breakout. This is more likely to happen when there is other evidence of a possible reversal, like a breakout above a trend channel line and then a reversal down with a strong signal bar.
The breakout can be of anything, such as a trend line, a trading range, or the high or low of the day or yesterday. It does not matter because they are all traded the same. Fade it if it fails and reenter in the direction of the breakout if the reversal attempt fails and therefore becomes a breakout pullback. Enter on the breakout only if it is very strong. An example of this is if there is a strong bull trend and then a two-bar pullback to a high 1 buy setup. Traders can buy at one tick above the high of the prior bar, and they can buy more on a breakout to a new high by placing an order to buy on a stop at one tick above the old high. Usually, however, it is better to buy a pullback or to look to short a failed breakout.
On most days, traders look at new swing highs and lows as possible fade setups. On a strong trend day, however, the breakouts are usually on huge volume and there is very little pullback even on a 1 minute chart. It is clear that the trend traders are in control. For example, when a bull trend is that strong, price action traders will be buying on high 1 and high 2 pullbacks instead of waiting for a breakout above the prior high of the trend. They are always trying to minimize the risk of the trade. However, once a strong trend is underway, entering with the trend for any reason is a good trade. In a strong trend, every tick is a with-trend entry, so you can simply enter at the market at any point and use a reasonable stop.
If there is a breakout with a large trend bar and the bar has not yet closed, you have a decision to make. If you just scalped out of part of your trade and are now thinking about swinging the remainder, always consider how much risk you have. One way to help decide if you should continue to hold your swing position is to ask yourself what you would do at this moment if you were not holding a position. If you would be willing to enter at the market using a swing-size position and the swing protective stop, then you should stay in your current swing position. If instead you think that it would be too risky to enter at the market with that amount of risk, then you should exit your swing position at the market.
When there is a breakout, both buyers and sellers see it as an opportunity. For example, if the market has a swing high and then pulls back, both bulls and bears will enter as the market moves above that prior swing high. Bulls will be buying the breakout because they see it as a sign of strength and they believe the market will go high enough above their entry for them to exit with a profit. Bears will also see the breakout as an opportunity to make money. For example, bears might sell on a limit order at the level of that prior high or maybe a few ticks above it. If the market reverses and comes down, they will look to exit with a profit. If, however, the market continues up, they will look to add to their short position if they think the market might pull back to test the breakout. Since most pullbacks come all the way back to the prior swing high, they can exit on that breakout test at about breakeven on their first entry and with a profit on their second, higher entry.
When traders think of breakouts they usually immediately have the image of a trading range. However, the breakout can be of anything. One common breakout that many traders overlook is a flag breaking out in the unexpected direction, like a bear flag breaking out of the top or a bull flag breaking out of a bottom. For example, if there is a reasonably strong bear trend and traders are not sure if a tradable low is in and they see a bear flag forming, they might start buying below the low of the prior bars, expecting a low 1 and then a low 2 or even a low 3 to fail. Sometimes the bear flag will have a good shape and trigger the low 2 short or the wedge bear flag short and then immediately reverse up into one or two bull trend bars. This breakout usually creates a measuring gap that leads to a measured move up. Traders will enter on the breakout and on any small pullback; and since bears were trapped, they will likely not be eager to short again until the market has had at least two legs up. The opposite is true of bull flags in bull trends.
There is a special type of breakout that sometimes occurs on trend days in the final hour. For example, if the market is trending down with no sign of a pullback, there can be one or two large bear trend bars that break out of the bottom of the bear channel. There may be a small pullback and then a second brief breakout to a new low. At other times, the market just moves down into the close relentlessly without large bear trend bars. What is likely happening in both cases is that risk managers at trading firms are telling their traders who have been bottom picking that they are on the wrong side of the market and that they have to sell out of their positions at the market. The plunges usually do not have much follow-through since they are mostly due to forced selling. There are likely some smart programmers who anticipate this and try to capitalize on it by designing programs to go short briefly, increasing the size of the sell climax. Momentum programs are also part of the strong trend. There may or may not be a bounce into the close after the one or two sell climaxes. The opposite is true on days that end with strong bull spikes or channels. The risk managers are telling their traders to buy back their losing shorts before the close, and as the market is rising quickly, momentum programs detect this and also buy relentlessly as long as the momentum continues.
One of the goals of traders is to do what the institutions are doing. Many breakouts are made of large trend bars that have the biggest volume of the day. These are times when the institutions are trading most heavily, and they are doing so because they expect the move to have protracted follow-through. As scary and emotional as the market can feel during a big breakout, the institutions see it as a great opportunity, as indicated by the volume, and so should you. Try to learn to trade breakouts because they have an excellent trader's equation. If you have to, simply trade only a quarter-size position (“I don't care” size), just to get experience. The move will often be large enough that you can make as much as you do on a routine trade using your full position size.
Figure 2.1 Breakouts Happen Many Times Every Day
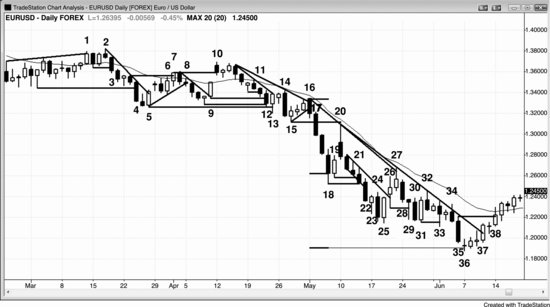
Breakouts of some type occur every few bars on every chart, as shown in Figure 2.1 in the daily chart of the Euro/U.S. Dollar Forex. Strictly speaking, if the high of a bar is above the high of any prior bar or the low of the bar is below the low of any prior bar, it is a breakout of that bar. Also, every trend bar is a breakout (remember from book 1, every trend bar is a spike, breakout, gap, and climax). Many different types of breakouts and failures are highlighted on this chart.
Bar 1 broke above a trend channel line and was followed by a breakout below its low on the next bar, setting up a two-bar reversal, which was triggered on the bar 3 entry bar. Bar 2 was a second attempt to break out above the bull channel and it broke out above another two-bar reversal but the breakouts failed and the market reversed down.
Bar 4 was a breakout below a swing low and it was the sixth bar is a sell climax down from bar 2. Since the range of the bar was large and it had small tails, it might represent a sell climax that needed a correction before there was follow-through selling. This turned out to be the case, because bar 5 was a strong bull reversal bar that turned bar 4 into a failed breakout.
There was a two-legged pullback to the moving average and bar 8 broke out of the bear flag.
Bar 9 broke above the bear trend line.
Bar 10 broke above a swing high but the breakout failed when the next bar traded below its low.
Bar 12 fell below the bar 9 entry bar and below the signal bar just before it.
Bar 13 tried to reverse back up and create a failed breakout, but that failed breakout failed on the bar 14 reversal back down. Bar 14 was also a reversal down from the failed breakout above a micro trend line and above a bull reversal bar. When a failed breakout fails to reverse the market, it becomes a breakout pullback.
The bar 16 break above the bear trend line failed and the bar reversed down into an outside down reversal, falling below the bear flag trend line of the prior three bars.
Bars 16 to 18 created a four-bar breakout composed of strong bear trend bars with large bodies, small tails, and very little overlap. The bulls who scaled into longs within the trading range finally capitulated and not only stopped buying, but had to sell out of their large long positions quickly without waiting for a pullback. They were not confident that a pullback would come soon and were confident that the market would be lower within a few bars. This means that getting out at the market or on a tiny pullback within the bar was their best option. Their long liquidation and their lack of buying for several bars contributed to the strength of the sell-off. When a breakout is that strong, it usually is followed by a channel and often leads to a measured move from the open of the first bar to the close of the final bar in the spike. The bar 36 low was just below that measured move projection, and that ended the channel. The market then usually works its way back up to test the first reasonable buy signal after the spike, which was the high of the bar 19 bull inside bar. If it gets there, it next tries to test the start of the bear channel, which was the bar 20 high.
Bar 20 was an attempt to make the four-bar breakout fail but when a breakout is that strong, there is usually follow-through and the failure will typically fail and just become a breakout pullback, as it did here. The market reversed back down just shy of the bar 15 breakout point and the moving average. Whenever a market turns back down without touching a resistance level, the bears are very strong because they are not waiting for the resistance to be touched. The bears are afraid that the bulls might not be able to get the market up there, so the bears have limit orders just below. This is a sign of urgency by the bears. That gap between the breakout point (the bar 15 low) and the breakout pullback (the bar 20 high) usually becomes a measuring gap and often is the approximate midpoint of the move. The start of the bear trend was the bar 2 high, and the market ultimately fell below the gap by more than the number of points between the bar 2 high and the middle of the measuring gap. The breakout and the strong reversal down on the breakout test established the bear trend as very strong, and traders should only look for shorts for the rest of the day. There might be a long scalp or two, but a trader should take them only if the trader is able to immediately reverse back to short as soon as a bar falls below the low of the prior bar, indicating that the small pullback might be ending. Incidentally, Elliott Wave traders see the pullback as the top of wave 4 and the breakout point as the bottom of wave 1. The two cannot overlap if the downward wave 3 in between is in fact wave 3, which is usually the strongest wave of the trend.
Bar 22 was a large-range bear bar that broke below the bottom of a four-bar channel. It was arguably the third consecutive sell climax (the first was bar 14 and the second was the four-bar spike down to bar 18). The market usually has at least a 10-bar, two-legged correction after two or three consecutive climaxes. Here, however, that four-bar bear spike was the overwhelming feature of the day and was the beginning of a strong breakout. Yes, it was a spike and therefore a sell climax, but it was so large that the character of the market changed and any counting has to start all over. Once it formed, traders decided that there was going to be a strong move down, and a channel is the most common pattern that follows a strong spike. Channels often have three pushes before they correct, and this one did as well. The three pushes were bars 18, 25, and 36, and they were followed by a weak rally into the close.
Bar 23 was a reversal attempt after the bar 22 sell climax and overshoot through the bottom of the three-bar bear channel. However, it is a mistake to be looking for a long based on these few bars when the big picture is so bearish. The market is always trying to reverse trends, and it is easy to get caught up in the emotion of a bottoming pattern as it happens in real time; but you should never lose sight of the big picture. That four-bar bear spike was very strong, and the always-in position is still short. Any attempt at a bottom at this point will almost certainly result in a bear flag, as it did here. The market always has inertia, and when it is trending, expect all reversal attempts to fail.
Bar 25 was a second attempt to reverse up after the breakout below the bars 20 to 21 channel. Since the signal bars for both attempts had strong bull bodies, the market might test the moving average. Most traders should not take this trade and instead should stay short. Too often, traders will scalp the countertrend trade for a point and then do not reverse back to short, and they miss out on making four or more points on the with-trend trade. It can be difficult to change your mind-set quickly back to short if you just went long, and if you cannot do this easily, do not take the countertrend scalp and then miss the swing down.
Bar 26 broke out of the top of the channel, as expected.
Bar 27 broke above the bear trend line and above the bar 18 breakout point but failed and reversed down on the next bar.
Bar 28 was a breakout of a three-bar bear flag.
Bar 29 broke below the bar 26 long entry bar but it found buyers, as seen by the large tail.
Bar 32 was another test of a bear trend line and therefore an attempted breakout, but it failed.
Bar 35 was another large bear trend bar and therefore another possible sell climax. When the market begins to form second and third sell climaxes within a short time, it is likely to reverse for at least a two-legged correction.
Bar 36 broke below the measured move but did not find sellers. Instead, it found quiet trading, which might be signaling a failed breakout of the bars 22 to 34 bear flag. A horizontal bear flag after a long bear trend often becomes a final flag and is typically followed by at least two legs sideways to up. Bar 36 was also the third push down in the bear channel and that usually leads to at least a reversal attempt.
The bar after bar 36 broke above the bar 36 high and became the entry bar for the long.
Bar 37 was a bull breakout bar above the bear trend line.
Bar 38 broke above the strong bar 35 bear trend bar, and there were certainly many buy stops for shorts above this bar because its large bear body represented strong selling. Once the market got above its high, lots of bears decided that there was no longer enough strength to stay short and they bought back their shorts (short covering) into the close.
Figure 2.2 Flags Can Break Out in the Less Likely Direction
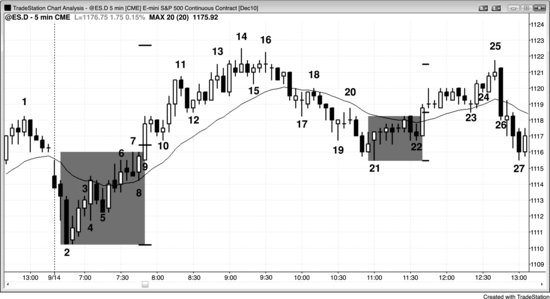
Flags can sometimes break out in the unexpected direction and lead to measured moves. In Figure 2.2, there was a failed wedge bear flag that broke to the upside on bar 9. The measuring gap between the high of the bar 7 breakout point and the bar 10 breakout test led to an almost perfect measured move up.
Bar 3 was a low 1 short setup, but after three strong bull bodies and the bar 2 sell climax, it was likely to fail. Aggressive traders would have gone long on limit buy orders at and below the bar 3 low. Bar 5 was an entry bar for a low 2 short, but after the strong bar 4 outside up bar the market might have been making a low of the day. Again, aggressive traders would have gone long at or below the low of the low 2 signal bar. Bar 7 was a signal bar for a wedge bear flag short, but the market was in a bull channel and the bar 4 outside up bar made the always-in trade long. Rather than short below bar 7, bears should have waited to see if the market formed a lower high. Bulls went long above bar 8, expecting a measured move up from the failed wedge bear flag.
There was then a failed low 2 bear flag buy setup above bar 22 and the entry bar was a bull trend bar. This breakout also led to a measured move up. Bar 21 was the bottom of a bear channel on a bull day and bar 22 was the breakout pullback from that channel breakout, so alert traders thought that the low 2 had an excellent chance of failing and leading to a test of the high of the day.
The low of bar 26 reversed the lows of the past 12 bars (it was below those lows) and the closes of the past 13 bars. Its close reversed these same lows, which is significant because a close below a low is more of a sign of strength than simply a low that is below a prior low. The more lows and closes that are reversed, the stronger the reversal. Every trader who bought during those prior 12 bars is now holding a loser and will look for any small bounce to sell out of his longs. Many sold on the next bar and created the tail on the top of the bar. Also, those bulls will not likely look to buy again for at least a few bars.
Figure 2.3 Small Breakout Bar
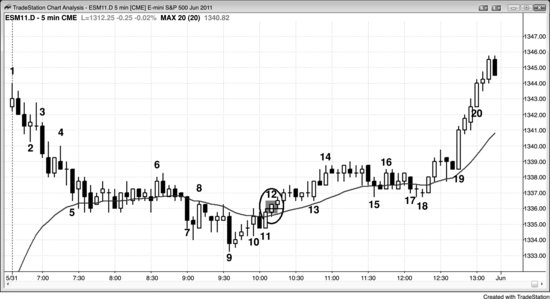
As shown in Figure 2.3, although big breakout bars like bars 3 and 19 often lead to big trends, sometimes a small breakout bar like bar 12 can be the start of a protracted move. After the bar 9 bear spike, traders wondered if the rally to bar 11 might become a low 2 bear flag at the moving average (bars 10 and 11 were two pushes up). However, instead of breaking to the downside, the market broke above the bar 10 and bar 11 double top (this made the rally a final flag, since it was the final flag of the bear trend, even though it never broke to the downside). The bar 12 breakout bar was small, but it was enough to make traders begin to discard the notion that the move to bar 11 was a bear flag, and they began to wonder if bar 9 was an exhaustive sell climax, which could correct for 10 or more bars. The bar after bar 12 was also small, but it had two signs of strength: a bull body and a low that did not fall below the bar 11 high (the breakout point). Although the rally to bar 14 did not cover many points, it was a relentless bull trend and became the first of two legs up (the second began with the bar 18 double bottom with bar 15, and the triangle formed by the lows of bars 13, 15, and 18).