Chapter 3
Initial Breakout
On 5 minute charts of most markets, there are usually at least a couple of successful significant breakouts every day. Most breakouts begin with a single trend bar that is usually larger than the previous bars and has no tails or only small tails. In the strongest breakouts, there will be a series of trend bars with very little overlap. For example, in a strong bull breakout on the 5 minute Emini chart, as soon as the breakout bar closes, some traders will place limit orders to buy at the closing price of that bar. If the next bar opens at that price and immediately trades up without going below that price, the limit orders will likely not get filled and these bullish traders will be trapped out of the market. They will experience a sense of urgency because they are afraid of missing the move and will look to get long as soon as possible, using either a market order or a limit order to buy any one- or two-tick or small pullback, or they will switch to a smaller time frame chart like a 1 or 2 minute, and then enter on a high 1 or high 2 pullback. This is often hard to do emotionally and it is comparable to jumping off a high diving board. What might work in both situations is to just do it: pinch your nose, close your eyes tightly, tense up every muscle in your body, and trust that you won't get hurt too badly and that the bad feelings will end quickly. If you are trading the Emini, you simply buy the small pullback and rely on your stop. If the breakout is good, your stop will not be hit and you will have a good chance of making two to even six or more points over the next many bars while risking about two points.
If, instead of having several strong bull trend bars in a row, the bar after a one- or two-bar breakout is a small bar, a doji, an inside bar, a bar with large tails, or a bear trend bar, the breakout might fail. This could lead to a reversal back into the trading range, a trend reversal into a bear trend, or a failed reversal, which is simply a one- or two-bar pullback that is followed by a resumption of the upward move. When the breakout is successful, it will create some version of a spike and channel trend.
A breakout entry appears deceptively easy to take when you see it on the chart at the end of the day. However, in real time, the setups tend to be either unclear or clear but scary. Entering on the breakout or after the breakout bar closes is difficult to do, because the breakout spike is often large, and traders have to quickly decide to risk much more than they usually do. As a result, they often end up choosing to wait for a pullback. Even if they reduce their position size so that the dollar risk is the same as with any other trade, the thought of risking two or three times as many ticks frightens them. Entering on a pullback is difficult because every pullback begins with a minor reversal, and traders are afraid that the pullback might be the start of a deep correction. If the reversal is just for a bar to two and sets up a breakout pullback entry, they are afraid to enter because they are concerned that the market might be entering a trading range and they do not want to buy at the top if the market is having a bull breakout, or sell at the bottom if there is a bear breakout. Trends do everything that they can to keep traders out, which is the only way they can keep traders chasing the market all day. When a setup is easy and clear, the move is usually a small, fast scalp. If the move is going to go a long way, it has to be unclear and difficult to take, to keep traders on the sidelines and force them to chase the trend.
You will regularly hear pundits discuss a one- or two-day sell-off in a stock that resulted from a bad report, like a disappointing earnings report or a change in management. They are deciding if the news is just a one-day event in an otherwise strong bull trend, or if it will change the outlook for the stock for the next several months. If they conclude that the odds favor the bull trend, they will buy around the bottom of the bear spike. If they think that the news was so severe that the stock will remain under pressure for months, they will not buy, and in fact will look to sell out of their longs on the next rally. Technical traders see the sell-off as a bear breakout and evaluate the stock in terms of the strength of the breakout. If the spike looks strong, they will short rallies, and maybe even the close of the bar, expecting a bigger spike, a spike and channel, or some other type of bear trend. If it looks weak relative to the bull trend, they will buy around the close and low of the bear trend bar, expecting a failed breakout and for the trend reversal attempt to become just another bull flag.
Figure 3.1 Breakouts with Many Consecutive Trend Bars Are Usually Strong
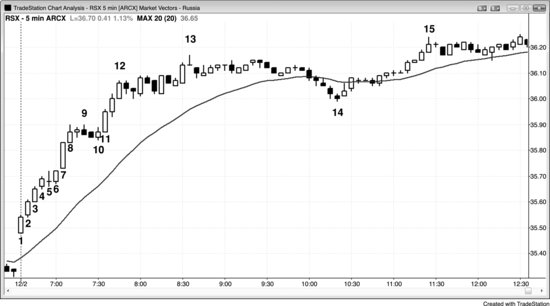
The strongest breakouts have a sense of urgency and have several trend bars in a row, as happened in the trend from the open bull trend day in RSX, the Market Vectors exchange-traded fund (ETF) for Russia shown in Figure 3.1. The market broke above the trading range that formed in the final hour of yesterday. Notice how the lows of several of the bars in the breakout did not drop below the close of the prior bar. This means that bulls who waited for the bar to close and then immediately placed limit orders to buy at the level of that close would likely not have their orders filled and they would be trapped out of the market. The market was running away from them and they knew it and would then take any reason to get long. This urgency caused the market to rise sharply. This series of bars should be considered to be a bull spike. A bull spike is usually followed by a bull channel, and together they constitute a spike and channel bull trend.
Bar 6 was an inside bar and the first pause, and this is usually a reliable high 1 long entry in a trend from the open bull trend day. However, when the trend is this strong, you can just buy at the market or buy for any reason at all. Did it rain somewhere in the Amazon last year? Then buy. Did someone on your kid's high school basketball team score a point last year? Then buy more. You need to get long and stay long because there is probably better than a 70 percent chance that the market will make a measured move up equal to or greater than the approximate height of the spike (the low or open of bar 1 to the close or high of bar 4 or 8, and add this many points to the closes of those bars). The exact probability is never knowable, but from experience this is a very strong breakout and the probability of the measured move is likely greater than 70 percent here. The measured move up from the open of bar 1 to the close of bar 4 was the price level where the market paused at the top of bar 8. The measured move based on the open of bar 1 to the close of bar 8 was exceeded by 3 cents on the close of the day (not shown).
Figure 3.2 Successful Breakouts Need Follow-Through
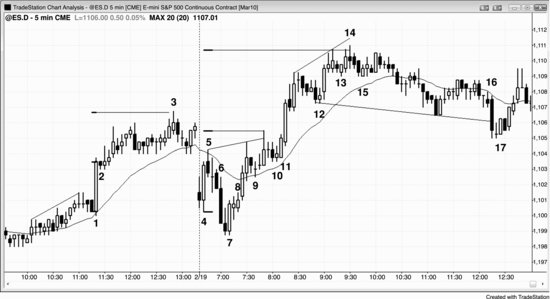
Breakouts are common on the 5 minute Emini chart, but strong, successful ones that have several bars of follow-through, like at bar 1 and bar 11 in Figure 3.2, usually happen only one to three times a day.
Bar 1 broke above the top of a small wedge, and it had a small tail at the top and bottom and was a large bull trend bar.
Bar 2 was a small bear inside bar and is a signal bar both for a failed breakout short and a breakout pullback long. Remember that an inside bar is a one-bar trading range and a setup for a breakout in either direction. Breakouts often lead to measured moves, and one common pattern is a measured move from the open or low of the spike to the close or high of the spike, and then projected up from the close or high of the spike. Here, the move to the bar 3 high of the day was a measured move from the open to the close of the bar 1 breakout bar.
The opening range often leads to a breakout to a measured move, but there are usually several possibilities for the measurement points and it is best to watch the nearest target first. Traders should look at the low of bar 4 to the high of bar 5. Once that measured move was exceeded, traders should look at other possibilities. A failed wedge often leads to a measured move, but traders need to consider every option that they can see. For example, they might look at the low of bar 7 to the high of the wedge (two bars after bar 9). However, the wedge began at bar 4, and the bar 7 lower low might be viewed as an overshoot of the actual bar 4 low. The market tried to form a wedge bear flag beginning at the bar 4 low, and it had three pushes up (bar 5, and the spikes before and after bar 9). Using the bar 4 low to the top of the wedge for the measurement projected a move that was exceeded by only one tick at the bar 14 high of the day. The purpose of finding these measured move targets is to find reasonable areas to take profits, and, if there is a strong countertrend setup, to initiate trades in the opposite direction.
Bar 6 was a strong breakout to a new low of the day, but it was reversed up by the bar 7 outside up bull trend bar. When traders saw the sideways action to bar 8, they were thinking that this was a possible breakout pullback (a bear flag) and it could be followed by another move down. You must always consider both bull and bear alternatives. Instead of more selling, the market moved up quickly. How can such a strong bear trend bar be reversed up so quickly? If the institutions had a huge number of buy orders, they would like to fill them at the best prices, and if they thought that the market was likely to test below the bar 4 low before going up, they would wait to buy until after that test. As the market is getting close to their buy zone, it does not make sense for them to buy because they believe the market will be a little lower over the next several minutes. So these very eager bulls are stepping aside. The absence of the strongest buyers creates an imbalance to the sell side, so the market has to fall quickly for the shorts to find someone willing to take the other side of their trade. The result is a large bear trend bar. Once the market is at a level where the bulls think it will not fall further, they appear out of nowhere and begin to buy heavily and relentlessly, overwhelming the bears. The bears realize what is going on and they stop shorting and begin to buy back their shorts. This means that both the bulls and the bears believe that the market will go up, and this creates a directional probability of an equidistant move of 60 percent or more in favor of the bulls. In other words, there is a 60 percent or more chance that the market will go up two points before falling two points, and up three points before falling three points. In fact, there is probably better than a 60 percent chance that the market will break out above the opening range and have a measured move up before there is a two-point pullback, and this is a great trade for the bulls.
Bars 9 and 10 were breakout pullbacks after new highs of the day.
Bar 11 was a breakout of the wedge that began with the bar 5 high. It was a strong two-bar bull spike, and it was followed by two more pushes up. Bull channels after spikes often have three pushes up, where the top of the spike is the first push up.
Bar 12 was a two-legged high 2 breakout pullback in a strong bull trend and is a great buy setup.
Bar 13 was another breakout pullback but since it would lead to a third push up, bulls had to be cautious. Once bar 14 hit five ticks above the long entry, many bulls moved their stops to breakeven because they were wondering if the bar 14 wedge high would lead to a lengthy (10 bars or more) two-legged pullback or even a trend reversal. Therefore, bar 15 was a bad signal for longs, who expected that any rally would end below the bar 14 wedge high and be followed by at least one more leg down. Aggressive traders shorted above its high, because a buy signal that is likely to fail means that traders could go short where inexperienced traders just went long and they would have about a 60 percent chance of the market falling two points to the protective stop of the weak longs before the market hit their profit-taking limit order six ticks higher. They are risking six ticks to make eight ticks and are 60 percent confident that they will win, and this is a logical bet.
Bar 16 was a bear breakout below a head and shoulders top, but since most topping patterns are really just bull flags, there was a good chance that the breakout would fail. Bulls could have bought above the small doji inside bar that followed, but this would be somewhat risky because doji bars are not reliable signal bars. Once they saw the bar 17 bull trend bar, buying the wedge bull flag became a more reliable pattern. Buying above a strong bull bar increases the odds for success because the market has already shown some strength. Since strong breakouts usually have several trend bars in a row and not a small doji bar for the next bar, traders saw this as a warning that the bear breakout was weak.
Figure 3.3 Watch Charts and Not the News
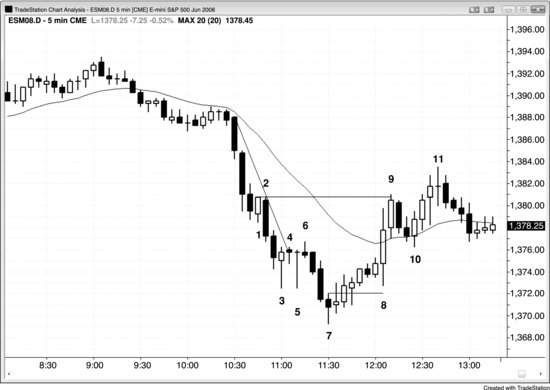
As shown in Figure 3.3, some news must have been released that led to a sharp sell-off at 10:30 a.m. PST. You should never pay attention to the news, aside from knowing when it will be released, because it creates a distance between you and what you have to do. It requires thought that you then have to reconcile with the chart, which can only reduce your profit. The chart tells you all that you need to know. Something happened that made the institutions sell aggressively, and that is all the information that a trader needs. It is time to look for short setups.
Bar 1 was a strong bull trend bar that trapped early buyers who bought the candle pattern or a smaller time frame reversal. A buy was not even triggered on this 5 minute chart, since the next bar did not go above the bar 1 high. These bulls would exit below the low of bar 1 and wouldn't look to buy again until more price action unfolds. Place an order to short on a stop at one tick below the low of bar 1, which is where those longs will have their protective stops, and as they cover they will provide plenty of downside fuel. If it gets hit, you know the trapped longs will get out and not want to buy again soon, and the smart bears will be adding to their shorts. With no one left to buy, the market will almost certainly provide a scalper's profit and likely much more.
Bar 5 is the third overlapping bar and at least one of the bars was a doji (all three were). This is barbwire, which is usually a continuation pattern and, like with any trading range, you should never buy at its high or sell at its low. You can fade small bars at its extremes and, since all horizontal trading ranges are magnets and often become final flags, you can wait for a trend bar breakout to fail and look for a reversal back into the range. Here, bar 7 closed above its midpoint and therefore met the minimum requirement for a reversal bar, and it followed a third consecutive sell climax. This is usually followed by at least a 10-bar, two-legged correction.
Bars 3 and 5 were classic candle pattern traps. Traders who memorize candle reversal patterns will be eager to buy these very large candles with long bull tails because they will see the long tails and the closes near the highs as evidence that the bulls were gaining control. When you see a big bar with a long tail and a small body in a bear trend, it tells you that if you buy above its high, you are paying way too much. In a bear trend, you want to buy low, not at the top of a huge bar with a small body when the market is in a tight bear channel and there has been no prior bull strength or trend line break. Bar 5 was an even better candle pattern trap than bar 3 since it was a gravestone doji, which candle novices worship. Also, the market traded above the high of the bar, seeming to confirm the strength of the bulls, and it was a second attempt at a bottom (a double bottom with bar 3). But what went wrong? When you see these small-bodied big candles in a strong trend where there has yet to be a trend line break, you should get excited because they are great traps and therefore perfect short setups. Just wait for the small bar that usually follows. Its lack of upside follow-through makes these early bulls very scared. Everyone knows where those bulls are putting their protective stops, so that is exactly where you should be putting your entry stop to go short. When you see those big doji candles, you, too, see bullish strength, but then assume that since the price was hovering at the high of those bars and the bulls were now in balance with the bears, the highs of those bars are likely to be in the middle or top of a trading range and not at a bottom.
The two-legged sideways move to bar 6 broke a trend line. Traders then knew that the bulls were getting eager to buy, so a perfect long setup would be a failed breakout to new lows. Smart traders just waited for a one- or two-bar break below bars 3 and 5 and then started placing buy orders at one tick above the high of the prior bar. They were prepared to keep moving the orders down if they didn't get filled. If the move continued too far down, they would have waited for another trend line break before looking to buy again because the trend would have resumed and this setup would have failed to trigger. The earlier bulls with two or three losses would wait for confirmation this time and enter late, and this would provide additional fuel for the upward move after the price action longs got in.
Even though bar 7 had a bear body, at least it closed above its midpoint, indicating some strength. Presumably, bulls were a little cautious after losing on entries from bars 1, 3, and 5. Also, it was a failed breakout from barbwire, which often forms the final flag of a trend. The odds were high that this would be a profitable long and smart traders would have been anticipating it, so there was no excuse to miss it.
The entry bar had a bull body, albeit small, which was constructive. Also, it was an inside body variant (its body was inside the body of the signal bar, which is a weaker version of an inside bar), which meant that the bears did not take control. At this point, longs were feeling confident because their protective stop was not hit on the bar after entry, as was the case for the earlier bulls.
The next three bars were all bull trend bars with closes above the prior close, so the closes were in a bull trend. It is reasonable to assume that there will be two legs up, but almost certainly there will be a stop run down before the second leg. The breakeven stop was not hit on the violent move down in bar 8, which turned into a bullish outside bar and the start of the second leg up (a higher low). Whenever there is a strong outside up bar that breaks the market into a new trend, its low is the start of the trend and all bar counting gets reset. For example, the two-bar reversal at bar 9 was a low 1 setup and not a low 2.
The targets for the rally were the bull signal bar highs in the bear (the highs of bars 3 and 5 and possibly bar 2). Bar 9 exceeded the final target by one tick. The momentum was so strong that the bar 8 low was likely just part of the first leg up and not the start of the second leg up, and there instead should be a bigger pullback and then a second leg up (it ended at bar 11).
Bar 11 set up a low 2 short from the rally up from the bar 8 low.