Chapter 7
Measured Moves Based on the Size of the First Leg (the Spike)
A measured move is a swing that is equal in size to a prior swing in the same direction. You estimate how far the market will go on its second attempt based on how far it went on its first. Why do measured moves work? If you are looking for a measured move, then you believe that you know the always-in direction, which means that you are probably at least 60 percent certain that the move will occur. The measured move is usually based on the height of a spike or trading range, and the initial protective stop is usually beyond the beginning of the first move. For example, if there is a strong buy spike, then the initial protective stop is one tick below the low of the spike. If the spike is huge, traders will rarely risk that much, and will usually still have a profitable trade, but the theoretical stop is still below the spike. Also, the probability is often more than 60 percent. If the spike is about four points tall, then the risk is about four points. Since you believe that the measured move will occur and that the strategy of buying at the top of the spike is sound, then you are risking four points on a 60 percent bet. Mathematics dictates that your belief (that the strategy will be profitable when the probability is 60 percent) will be true only if the reward is at least as big as the risk. This is discussed in Chapter 25 about the mathematics of trading. This means that for the strategy to work, you need to have a 60 percent chance of making at least four points, which is the measured move target. In other words, the only way that the strategy works is if the measured move target is hit about 60 percent of the time. Since trading a trend is the most reliable form of trading, if there ever are strategies that work, then this has to be one. Is this the reason why measured moves work? No one knows for sure, but it is a plausible explanation, and the best that I have imagined.
Most measured moves are based either on spikes or on trading ranges. When one is based on a spike, it usually leads to a trading range; and when it is based on a trading range, it usually leads to a spike. For example, if there is a double top, which is a type of trading range, traders will often take partial profits once the breakout up or down reaches a measured move. Traders look for a breakout, which is a spike, and they usually expect some profit taking once the spike has reached the measured move area. If the breakout was with a strong spike and there is no significant pause at the measured move target, the spike itself often leads to a measured move based on the height of the spike. Once the market gets there, traders will often begin to take profits and the result will usually be a trading range.
Once there is a pullback from a strong move, there is usually a second leg in the same direction, and it is often approximately the same size as the first leg. This concept is the basis for a few reliable techniques to project a possible target for the end of that second leg. That measured move area is a reasonable place to take profits on your trend position, and then you can wait for another pullback to reestablish your position. If there is a strong reversal setup, you can also consider a countertrend trade.
When a market makes a sharp move and then has a pullback, it will likely have a second leg and the second leg is frequently approximately the same size as the first. This is a leg 1 = leg 2 move, but it is also called an ABC move or an AB = CD. This alphabetical terminology is confusing, and it is simpler to just refer to the two moves as leg 1 and leg 2, and the pullback after leg 1 as simply the pullback. The confusion with the alphabetical labeling is that in the AB = CD pattern, the B, C, and D correspond to the A, B, and C of the ABC move. The B leg of an ABC is the pullback and it creates a thick area on a Market Profile (CME Group's graph of price and time information). The middle of any thick area often leads to a measured move, and here the target is the same as the one based on AB = CD. For example, for the AB = CD in a bull trend, if you start at point A and add the length of the AB leg (which is B – A), then add that to C, you get C + (B – A). For the thick area, you start at A and then add the length of the AB leg (which is B – A), then move back down to one-half of the thick area (so subtract half of the BC leg), and then add the height of B minus one-half of the BC thick area to get the measured move up from the middle of the BC thick area. Both equations equal C + (B – A) and therefore give the same measured move projection. This is way too complicated, and it is of minor importance because you should not be fading the move with a limit order solely based on Fibonacci extensions or measured moves or any other magnet. They just provide a guide to keep you trading with the trend until they are approached, and at that point you can consider countertrend setups as well.
In addition to clear pullback entries that set up measured moves, sometimes there is a more subtle situation that is equally valid. When a market has a strong trend move and then a fairly strong pullback leg, and then a trading range, traders can use the approximate middle of the range to project where the second leg of the pullback might reach. As the trading range unfolds, keep adjusting the line to where you estimate the midpoint is, and that will usually be around the midpoint of the pullback once the move has finally completed its second leg. This just serves as a guide to where you should be anticipating the two-legged pullback to end and for the market to set up a trade for a resumption of the trend. You can also simply use a leg 1 = leg 2 measurement. For example, in a two-legged bull flag, take the length of the first leg down and subtract that height from the top of the pullback to find a reasonable location for where the second leg down of the pullback might end.
There is a variation of this in spike and channel trends where the height of the channel is often about the same as the height of the spike. This is especially true when the spike is strong, like one with exceptionally large trend bars or several strong trend bars with little overlap and small tails. When there is a strong spike, the market often makes a measured move in either direction, but usually in the with-trend direction based on some combination of the open, close, high, or low of the first and last bars of the spike. For example, if there is a huge bull spike, take the number of points from the open of the first bar of the spike to the close of the final bar of the spike and add that to the close of that final bar of the spike. The channel that follows usually will find some resistance in that area and the market will often then correct down to the bottom of the channel. This measured move target is an area where you can take profits on your long position. Sometimes the market might make a measured move from the low of the first bar of the spike to the close or high of the final bar of the spike, or from the open of the first bar to the high of the final bar, so it is prudent to look at all the possibilities. Less often, the market will not form much of a channel up and will reverse to below the bottom of the spike, and then make a measured move down.
It is important to remember that most of the time the market is in some kind of trading range and therefore the directional probability of an equidistant move is 50 percent. This means that the market is as likely to go up X number of points as it is to go down that same number of points. When there is a trend, the odds are better in the trend direction. When there is a strong spike, the odds of follow-through might be 60 percent and sometimes even 70 percent if the overall chart pattern is consistent with a strong trend move. Also, when the market is at the bottom of a trading range, the probability favors a move up; and when it is at the top of the range, the probability favors a move down. This is because of market inertia, which means that the market tends to continue what is has been doing. If it is trending, the odds favor more trending, and if it is in a trading range, the odds favor that breakout attempts will fail. In fact, about 80 percent of trend reversal attempts fail, and that is why you should wait for them to evolve into pullbacks and then enter in the direction of the trend. Also, 80 percent of attempts to break out of a trading range fail, and it makes far more mathematical sense to fade the tops and bottoms of the trading range than it does to buy large bull trend bars near the top and short large bear trend bars near the bottom.
Here is an example of a measured move that uses several assumptions. There was a strong bull spike made of three bull trend bars that broke out of a trading range. The next bar was a small doji bar, and this pause meant that the spike ended on the prior bar, which was the last of the consecutive bull trend bars. The breakout was strong because there was very little overlap between the bars, with the open of each bar at or above the close of the prior bar. The biggest tail on any bar was only two ticks, and a couple of bars had no tail on the bottom. The first bar was three and a half points (14 ticks) tall, the second bar was 10 ticks tall, the third bar was eight ticks tall, and the fourth bar had a one-tick bull body but a three-tick tail on the bottom and a two-tick tail on the top. That doji was the first bar that lacked momentum and it therefore told you that the spike had ended on the previous bar. The open of the first bar was eight points below the close of the third and final bull trend bar in the spike, so the spike should be thought of as being eight points tall, at a minimum. You could use the low of the first bar to the high of the third bar or even the high of the doji fourth bar, but it is more conservative to use the smaller figure for your initial projection. If the second leg surpasses this target, then look at other targets.
As that spike was forming, if you bought at any point, your stop on your trade might have to be below the bottom of the spike. For argument's sake, assume that you would risk to one tick below the open of the first bar of the spike. If you bought at the market at the highest tick when the spike was three points tall, then you would be risking about three points to make at least three points. At that moment, you believed that the market would have a measured move up equal to the height of the spike, which was three points tall. You knew where your stop was, and you didn't yet know where the top of the spike would be, but you knew that it would be at least as high as where you bought. Since you believed that the market was trending, you felt that the odds were better than 50–50 that the market would go up three points before it fell and hit that stop three points below.
After the spike continued to grow to seven points, you changed your assessment. You now believed that since the market was still trending, the odds were at least 50–50 that the market would go up seven more points before it fell seven points. At the moment, you already had four points of open profit on a trade where you were hoping for three while you risked three. If you wanted, you could have bought more at the high tick of the spike, which was still forming, and then your risk would have been seven points (maybe a few ticks more since you would probably have wanted to risk to one tick below the bottom of the first bar of the spike), and your profit target would be seven points higher. However, on your initial long, you were still risking three points but now had better than a 50 percent chance of making a total of 11 points (the four from your entry to the current top of the spike, and then seven more).
Once that fourth bar formed, which was a doji, you then knew that the spike up had ended at the close of the prior bar, eight points above the open of the first bar of the spike. At that point, you would have concluded that the market had more than a 50 percent chance of going up eight more points above the close of the spike before falling eight points to below the open or bottom of the spike (maybe a tick or two more than eight points on the downside, since the safest stop was beyond the start of the spike). Since the spike was so strong, the probability was likely more than 60 percent.
As soon as the spike ended, two-sided trading began, and at that point uncertainty increased. The market corrected sideways to down and then the channel up began. Although the market might have made a leg 1 = leg 2 move up from the bottom of this pullback, where the spike was leg 1 and the channel was leg 2, when a spike is very strong, the more reliable target is the one based on the open of the first bar of the spike to the close of the final bar of the spike. As the market rallies, the probability of higher prices slowly erodes. When the bull channel reached about half of the distance to the measured move target, the directional probability of an equidistant move fell back to around 50 to 55 percent and uncertainty once again was very high. Remember, a bull channel is usually followed by a move back down to the bottom of the channel and then at least a bounce, so the bull channel was actually the first leg of a trading range that had not yet formed. Once the market made it to the measured move target area, it was likely the high end of that incipient range, and the odds favored a move down. This is true of all trading ranges. This is an excellent area to take profits on your longs, and because so many traders take profits in the area of the measured move, the market begins to pull back. Most traders will not look to buy aggressively again until the market retraces to around the bottom of the channel, where a double bottom usually forms. This area is also a magnet. The bulls begin to buy again and the bears who shorted at the top of the channel will take profits. Since the market is now around the bottom of the developing trading range, the directional probability slightly favors the bulls.
Once the market enters the trading range, the directional probability of an equidistant move is again 50–50 whenever the market is near the middle of that range. If your risk is X points, you have a 50 percent chance of making X points before your stop is hit, and a 50 percent chance of losing X points before your profit target is reached. This is a by-product of the markets being relatively efficient. Most of the time, they are efficient and the odds of making X points before losing X points are close to 50–50. The best trading occurs when the odds are better than 50–50, but this often occurs during spikes, which are emotional, fast moving, and difficult to enter. Traders understand this and that is why the spike grows so quickly without any pullbacks. Traders keep adding to their positions all the way up because they know that until the spike ends, the odds of making as much as they are risking are better than 50–50, and the odds fall to about 50–50 only once the channel is well underway. When that spike is forming, they do not know if there will be a pullback before the market goes higher, but they are confident that it will go higher in the near term. Rather than waiting for a pullback that may never come and therefore missing out on a strong trade, they buy at the market or on one- to four-tick pullbacks and risk to around the bottom of the spike. This urgency is behind the formation of spikes, and the increased risk keeps many traders away. Most beginners are unwilling to risk the three to seven points. Instead, they should simply buy a small position, maybe one-quarter of their normal size, and take the risk, because that is what the institutions are doing. They understand the math and therefore are not afraid to take the trade.
This move toward a 50–50 market is the basis of all measured move trades. The odds are out of balance, and the rally to the measured move is an attempt to restore uncertainty. The market invariably overshoots and has to backtrack to home in on a 50–50 market. The measured move area is an overshoot of the odds, and they then briefly favor the bears. Once the market retraces to the bottom of the channel, the odds again overshoot, but this time in favor of the bulls. When the market bounces back up toward the middle of the developing trading range, the odds are once again around 50–50 and the market is in balance.
Figure 7.1 Leg 1 = Leg 2
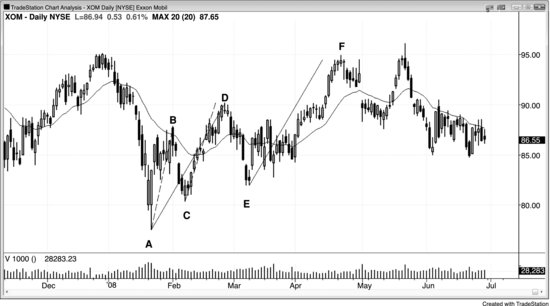
Exxon Mobil (XOM) had a strong first leg up from bar A to bar B on the daily chart shown in Figure 7.1, so traders bought the bar C higher low for a possible leg 1 = leg 2 rally. Bar D slightly undershot the target (the top of the dashed line). Once in the area of the target, many traders saw what they thought might be two-legged bear rally after the sell-off to bar A. If you were to use ABC labeling, bar B is point A, bar C is point B, and bar D is point C, and because of this confusion, it is better to simply refer to the move up to bar B as leg 1, the sell-off down to C as the pullback, and the rally up to D as leg 2.
Once there was a higher low at bar E and the rally broke above bar D, a trader could look at AD as a first leg that contains two smaller legs (AB and CD), and then stay long until there was a measured move up (AD = EF, and the target is the top of the solid line).
Fibonacci traders also look to other extensions (138 percent, 150 percent, 162 percent, etc.) as valid areas in which to look for reversals, but this is too complicated and approximate. Once the market has clearly two-sided behavior, it is just as reliable to look to buy low and sell high whenever there is a strong signal.
Figure 7.2 Variant of Leg 1 = Leg 2
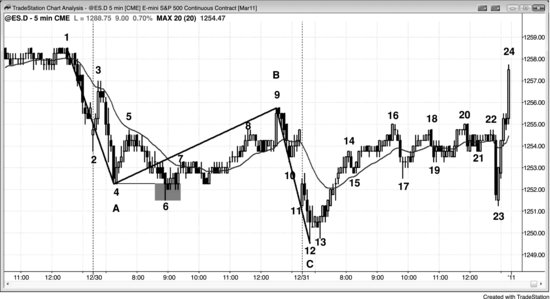
Sometimes a leg 1 = leg 2 measured move has a leg 1 that is not the absolute low of the initial sell-off. The correction up from the first leg down is usually a two-legged move or a wedge bear flag, but the pullback from either often falls below the beginning of the corrective leg, as it did in Figure 7.2 at bar 6. By the time bar 9 formed what appeared to be the end of the pullback from the first leg down, astute traders were open to the possibility that the correction up to bar 9 began at bar 4 and not bar 6, and therefore thought that the second leg down might be equal to the bar 1 to bar 4 first leg down instead of the bar 1 to bar 6 first leg down. The bottom of bar 12 was a perfect leg 1 = leg 2 measured move to the tick based on the bar 4 end of the first leg. If the market instead continued down, then traders would have watched to see what happened once it fell to the area of the leg 1 = leg 2 based on a leg 1 ending at bar 6.
Why did it make sense to consider the possibility that leg 1 ended at bar 4? Traders were looking for a two-legged pullback up before the second leg down began, and the move up from bar 6 to bar 9 was in a channel and therefore likely just one leg. Elliott Wave traders know that upward corrections can include a pullback that goes below the bottom of the initial move down, and they call this sideways type of correction a flat. The flat here would be the move up to bar 5, the move down to bar 6, and the move up to bar 9. Also, the move up to bar 5 was a reasonably strong bull spike and therefore it was a possible start of the correction. The pullback to bar 6 from that spike up was a lower low pullback, and lower low pullbacks are common. Therefore, as the correction was unfolding, traders were not troubled by this interpretation.
Bars 5 and 8 formed a potential double top bear flag, but the breakout to bar 9 eliminated that possibility. However, whenever there is a breakout above a double top, traders watch to see if it fails. If so, this effectively is a wedge top. The three pushes up are the bar 5 and bar 8 double top followed by the failed breakout to bar 9.
Once the market spiked down to bar 10 after the failed breakout, traders believed that the second leg down from the bar 1 high had begun.
There were some other noteworthy features on this chart. Bar 12 was an expanding triangle bottom with bars 4, 6, and 12 being the three pushes down.
The first day opened with a sharp rally up to bar 3 and then a sharp sell-off down to bar 6 that extended about as far below the open as bar 3 did above it. Even though the range was small, it was about average for the recent days (the end of December often has small days). Whenever a day has an average range and the open is in the middle of the range, the market often tries to close around the open. Traders know this, and that is why the tight trading range that followed bar 7 had a good chance of having a breakout that tested the open of the day. The day closed at one tick above the open, and this formed an almost perfect doji candle on the daily chart.
The rally to bar 9 was a breakout test of the sell-off below bar 3. The sell-off to bar 23 was a breakout test of the rally above bar 13, and it missed the breakeven stops by one tick. It was also an exact test of the open of the day.
Figure 7.3 Measured Move Based on Middle of Trading Range
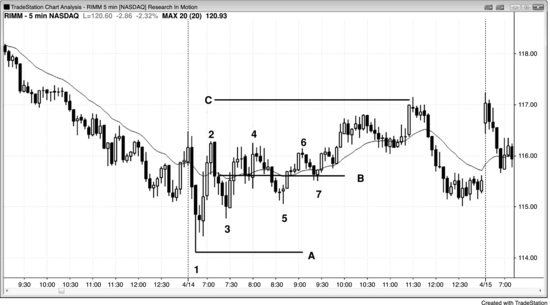
In Figure 7.3, Research in Motion (RIMM) had a sharp move up to bar 2 after an opening reversal from below yesterday's low, and then a pullback to bar 3. Since a second leg up was likely after a strong three-bar bull spike, if traders were interested in knowing where it might end, they could keep adjusting line B to be in the middle of the developing range. Once the market breaks out, they could make a parallel and drag it equidistantly up from line A for a measured move, where they could expect to take profits. Even though the market was in a trading range, there was a slight bias toward an upside breakout because the move before the trading range was up and most of the bars in the trading range were bull trend bars, representing buying pressure.
Until the market broke out of the triangle by going above bar 6, traders could have traded in both directions, as they can in any trading range. Since a trading range is an area where both the bulls and the bears have agreed that there is value, most probes away from the middle fail and the market will get drawn back into the range. Eventually, the market will break away from the magnetic field and find value at a different price.
Figure 7.4 Measured Move Based on Bear Spike
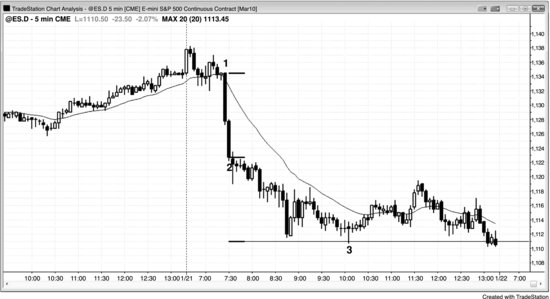
When there is a news release that creates a spike, the spike often leads to a measured move where traders can look to take profits. In Figure 7.4, at bar 1 the market was surprised by an announcement about the president proposing new banking regulations, and this led to two large bear trend bars. Once there is a pause bar like a doji, a bar with a large tail on the bottom, or a bar with a bull body, then you know that the spike had ended on the prior bar. Here, the spike lasted two bars and traders looked for a measured move down from the close of the final bar of the spike. They expected it to be about the same number of ticks as there were from the open of the first bar of the spike down to the close of the final bar of the spike. Sometimes the high of the first bar to the low of the final bar of the spike becomes the height of the measured move, but traders will always look at the nearest possibility first and look for bigger moves only if the first target failed to contain the market. This target is a good place to take your final profit on a swing short and then look for a pullback to short again. If there is a strong reversal signal at that test area, a countertrend trade can be considered.
Figure 7.5 A Spike Can Lead to a Measured Move Up or Down
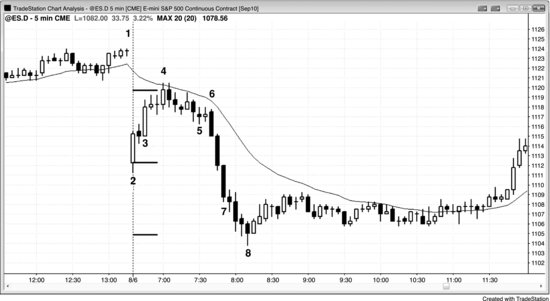
A spike can be followed by a measured move in either direction. In Figure 7.5, there was a strong six-bar rally on the open, but the market failed at the moving average on this large gap down day and ultimately reached a measured move to the downside. The move was based on the open of the first bar of the spike to the close of the final bar of the spike. Although most spikes end as soon as there is any pause bar, if the move continues up after the pause, you should consider the possibility that it will function like a spike, which it probably is on a higher time frame chart.