Chapter 9
Reversals Often End at Signal Bars from Prior Failed Reversals
The entry price of an early reversal that failed is often a magnet for a later, successful reversal. For example, if there is a bear trend and there have been several bull entries that failed as the market continued to sell off, each of these entry prices and the highs of every signal bar will be targets once a reversal up finally succeeds. The market will often rally all the way to the highest signal bar's high before having a significant pullback. It is likely that some traders who entered on those higher signals scaled in as the market went against them and they then used their initial entry as their final profit target, exiting breakeven on their worst entry and taking profits on all of the lower entries. It might just be that smart traders believe this to be the case and will dump their longs at those targets, or it might simply be one of the many secret handshakes that all great traders know, and they exit there simply because they know that it is a reliable recurring pattern for pullbacks to end near earlier entry points. It can also be something of a “Thank you, God, I will never do this again!” price for traders. They did not exit a losing trade, and their loss kept growing while they kept hoping for the market to come back to their entry. When it finally does, they exit and swear that they will never make that mistake again.
There is a mathematical basis for just about everything that happens in trading, especially since so much of the volume is generated by software algorithms that are based on statistical analysis. In the example of that bear trend that reversed up, that earliest buy signal is often at the start of a bear channel. When a bear channel begins, the directional probability of an equidistant move is at least 60 percent. That means that the market had about a 60 percent chance of falling 10 ticks before rallying 10 ticks. It can be any size move that is within reasonable reach based on the recent swings, but the key point is that the market has a downside bias. As the market falls and the momentum slows, the directional probability falls to around 50 percent when the move down is about half over, but the price of this neutral area is usually not knowable until after the market forms a trading range. As it continues to fall down to some significant magnet, the directional probability overshoots neutrality and actually shifts in favor of the bulls. In the middle of the trading range, there is uncertainty; but once the market hits the bottom, there is agreement that the market went too far. At this point, the directional probability favors the bulls. It will then rally and begin to form a trading range. The directional probability always favors the bulls at the bottom of a trading range, and that bottom will be at some key technical price. There are many to choose from as the market is falling, and most do not lead to a clear buy setup. Some firms will write programs based on one or more technical support levels, and other firms will use others. When enough key technical areas occur in close proximity, there will be enough volume betting on a reversal to change the direction. At that point, the math is on your side because you are buying at what will be the bottom of a trading range. The reversal point is never known with certainty in advance, but it will happen with some kind of reversal pattern; it is important to watch for these patterns when the market is at key technical levels, like at measured move targets, trend lines, and even higher time frame moving averages and trend lines. This is discussed further in the chapter on reversals in book 3. It is usually not necessary to look at lots of charts in search of setups because there will be a reasonable setup on every chart if you are patient, vigilant, and aware of the patterns.
Once the market turns up, it will usually try to form a trading range, and the first possibilities for the top of the incipient trading range are those earlier long entry prices. The market will try to rally to the top of those bull signal bars. As it is going up, the directional probability falls back to 50 percent, and it continues to fall further as the market gets near the top of the range. Since that top is never known in advance and the middle of the trading range where the directional probability is neutral is never known in advance, the market overshoots until it hits some technical level where traders believe it is clearly overdone. This is often at the level of those earlier buy signals. Remember, the directional probability favored the bears when the price was last there, and when it gets there another time it usually favors the bears once more; that is why the market typically turns down there again. It is a price where the sellers took control. The rally often forms a double top with one of those earlier entry bars and then turns down, at least briefly, as the trading range evolves. The market will often go up and down as it searches for uncertainty, which means a neutral directional probability of 50 percent. At some point, the market will decide that this area no longer represents value for both the bulls and the bears and that it is a bad price for one side. The market will then trend again until it finds a price that both the bulls and the bears see as a good price at which to initiate positions.
Figure 9.1 Earlier Entry Points Are Targets for Pullbacks
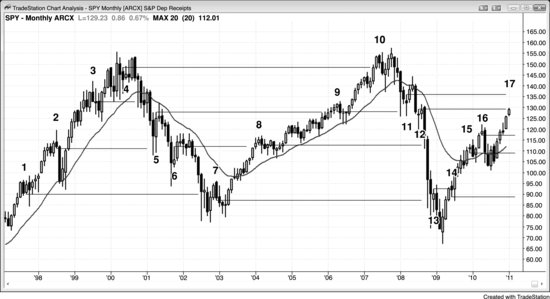
The monthly chart of the SPY (an exchange-traded fund that is comparable to the Emini) had a strong bull trend that ended in 2000, but there were several attempts to reverse into a bear trend as the market continued up (see Figure 9.1). Each of the bear signal bar lows (bars 1, 2, and 3) was a target for any correction on the way down.
Likewise, the bear trend that ended in 2003 had several failed bull reversal attempts along the way (bars 4, 5, and 6) and the high of each bull signal bar was a target for any subsequent rally.
Also, the rally from 2003 had several failed bear attempts (bars 7, 8, 9, and 10), and each one was a target in the bear trend that ended in early 2009. That sell-off had several bottom attempts, and the high of each of those buy signal bars (bars 11, 12, and 13) is a target for the current rally. Finally, the rally up to bar 17 had several attempts at a top (bars 14, 15, and 16), and the bottom of each of those sell signal bars is a magnet on any sell-off.
None of the targets ever has to be reached, but each is a strong magnet that frequently draws the market back to its level.