Chapter 11
First Pullback Sequence: Bar, Minor Trend Line, Moving Average, Moving Average Gap, Major Trend Line
There are many types of pullbacks that can occur in a trend, some shallow and others deep, and they can be classified and ranked in terms of their extent. The first time any one of them appears is a first pullback for that type of pullback. Each subsequent pullback will be the first one of a larger variety, and each one will usually be followed by a test of the trend extreme since strong moves generally have at least two legs. Each type of first countertrend move will therefore likely be followed by another leg in the trend. The pullbacks don't have to occur in the exact same order. For example, sometimes a high 1 will occur after a high 2 if the trend accelerated after the high 2.
As a bull trend progresses, it eventually loses momentum, becomes more two-sided, and starts to have pullbacks. The pullbacks become larger and evolve into a trading range, and eventually a trading range will reverse into a bear trend. Prior to the final reversal, each countertrend move is usually followed by another high in the trend. Therefore, each sign of weakness is theoretically a buy setup, and each can occur several times before any other on the following list develops. Also, one can occur and then occur again later after others have occurred.
Here is the general order in which signs of weakness in a bull trend develop:
- The bull bodies become smaller.
- Tails start to form on the tops of bars, and the tails become larger on subsequent bars.
- Bars overlap their respective prior bars more than they did earlier.
- A bar has a very small body or a doji body.
- A bar has a bear body.
- The high of the current bar is at or below the high of prior bar.
- The low of the current bar is at or just above the low of the prior bar.
- The low of the current bar is below the low of the prior bar.
- There is a one-legged pullback (a high 1 buy setup), where the high of the bar is below the high of the prior bar.
- There is a two-legged pullback (a high 2 buy setup) lasting only five to about 10 bars.
- There is a three-legged pullback (a wedge bull flag or a triangle) lasting only five to about 15 bars.
- There is a break of a minor bull trend line.
- A bar touches the moving average (a 20 gap bar buy setup).
- The next rally to a new high has one or more bear trend bars and a pullback or two.
- A bar has a close below the moving average.
- A bar has a high below the moving average (a moving average gap bar).
- There is a break of a major bull trend line.
- Once there is a bar with a high below the moving average, there is a second leg down before the market gets back above the moving average.
- The rally to the new high has two or more pullbacks, each lasting two or three bars and having more prominent bear bodies.
- There is a larger two-legged pullback, lasting more than 10 bars, with the second leg down falling below a prominent higher low, forming a lower low.
- The market enters a trading range, and the bull and bear bars are about equally prominent.
- The market breaks above the trading range and comes back into the trading range, forming a larger trading range.
This is the sequence of weakening of a bear trend:
- The bear bodies become smaller.
- Tails start to form on the bottoms of bars, and the tails become larger on subsequent bars.
- Bars overlap their respective prior bars more than they did earlier.
- A bar has a very small body or a doji body.
- A bar has a bull body.
- The low of the current bar is at or above the low of prior bar.
- The high of the current bar is at or just below the high of the prior bar.
- The high of the current bar is above the high of the prior bar.
- There is a one-legged pullback (a low 1 sell setup), where the low of the bar is above the low of the prior bar.
- There is a two-legged pullback (a low 2 sell setup) lasting only five to about 10 bars.
- There is a three-legged pullback (a wedge bear flag or a triangle) lasting only five to about 15 bars.
- There is a break of a minor bear trend line.
- A bar touches the moving average (a 20 gap bar sell setup).
- The next rally to a new low has one or more bull trend bars and a pullback or two.
- A bar has a close above the moving average.
- A bar has a low above the moving average (a moving average gap bar).
- There is a break of a major bear trend line.
- Once there is a bar with a low above the moving average, there is a second leg up before the market gets back below the moving average.
- The sell-off to the new low has two or more pullbacks, each lasting two or three bars and having more prominent bull bodies.
- There is a larger two-legged pullback, lasting more than 10 bars, with the second leg up reaching above a prominent lower high, forming a higher high.
- The market enters a trading range, and the bull and bear bars are about equally prominent.
- The market breaks below the trading range and comes back into the trading range, forming a larger trading range.
Most of the first pullbacks are minor and are still part of the larger trend's first leg. However, each pullback tends to be greater as the countertrend traders become more willing to take positions and the with-trend traders become quicker to take profits. Countertrend traders start to take control at new extremes. For example, in a bull trend, traders will start to be able to make profitable trades by shorting reversals from new highs, and with-trend traders will begin to lose when they buy breakouts to new highs. At some point, the countertrend traders will overwhelm the with-trend traders and the trend will reverse.
The first minor pullback in a strong trend is a one- or two-bar pullback, which almost always is followed by a new extreme. For example, if there is a bull spike that goes on for four bars and there is little overlap between the bars and the tails are small, the trend is strong. If the next bar has a low below the low of the prior bar, this is the first pullback in this bull trend. Traders will place a buy stop above its high, since they expect at least one more push up. If their order is filled, this is a high 1 long entry, which is discussed in detail in Chapter 17 in this book. Aggressive traders will buy on a limit order below the low of the prior bar, expecting the pullback to be brief and wanting to get in at a lower price than the traders who are waiting to buy on a stop above the pullback bar or bars. The next pullback might be three to five bars long and will likely break a minor trend line and then be followed by another new extreme. If this pullback has two small legs, then the buy entry is a high 2 long (a two-legged pullback, commonly called an ABC pullback). Although this second pullback can be a high 2 setup, if the trend is very strong, it can be another high 1 (a one-legged pullback). If the market went from one or two high 1 entries and then a high 2 entry, and it appeared to be setting up another high 1, it is wise to wait. After a series of winning trades, you should be suspicious of renewed strength without first seeing a larger pullback, since this strength might be a trap setting up (like a final flag, discussed in book 3). It is better to wait for more price action and miss a possible trap than to feel invincible and fearless because you fooled yourself into believing that you are playing with someone else's money. If you trade, it will likely become someone else's money.
The opposite is true in a strong bear trend, where the first pullback is usually a brief one- or two-bar low 1 short entry and later pullbacks have more bars and more legs. For example, an ABC pullback has two legs and sets up a low 2 short entry.
If the trend is strong, it might stay away from the moving average for two hours or more, but once it hits the moving average, it will likely form another with-trend setup that will lead to another new extreme, or at least a test of the old extreme. In a pullback to the moving average in a bull trend, many traders believe that the price is at a good enough discount for them to buy. The bears who shorted above will buy back their shorts to take profits; the bulls who took profits higher will look to buy again; and the traders who had been on the sidelines, waiting for lower prices, will see the moving average as support and a sufficient discount for them to initiate new longs. If the market cannot move above the moving average after about 10 to 20 bars, it is probably because traders want more of a discount before aggressively buying. The price is not low enough yet to attract sufficient buyers to lift the market. The result is that the market will have to fall further before enough buyers return to lift the market up to test the old highs. This same process happens at all support levels.
If a pullback goes beyond the moving average, it will have the first moving average gap bar setup (for example, in a strong bull trend, there is finally a pullback that has a bar with a high below the exponential moving average). This is usually followed by a test of the extreme and likely a new extreme. Eventually, there will be a countertrend move that will break a major trend line, and it often is the pullback to the first moving average gap bar. It will be followed by a test of the extreme, which may undershoot (higher low in a bear trend or lower high in a bull trend) or overshoot (lower low in a bear trend or higher high in a bull trend) the old extreme. This is then usually followed by at least a two-legged countertrend move, if not a trend reversal. Each pullback prior to the reversal is a with-trend entry, because each is a first pullback of one type or another (bar, minor trend line, moving average, moving average gap, or major trend line), and any type of first pullback is usually followed by at least a test of the extreme and usually a new extreme until after the major trend line is broken.
Although it is not worth the effort to pay attention to higher time frame charts when trading on a 5 minute chart, it is likely that the larger 5 minute pullbacks end at 15, 30, or 60 minute, or even daily, weekly, or monthly chart points of significance like exponential moving averages (EMAs), breakout points, and trend lines. Also, there is often a tendency for the first pullback to the 15 minute moving average to be followed by a test of the trend extreme, and then a pullback to the 30 or 60 minute moving average, which would likely be followed by another test of the extreme. With higher time frame points of significance occurring relatively infrequently, spending time looking for tests of those points will be a distraction and cause traders to miss too many 5 minute signals.
If a trend is strong and you have made several profitable trades but there are now several sideways bars, be cautious about further entries because this is effectively a trading range. In a bull trend, you can buy if there is a setup near the low of the range, but be careful buying a breakout of the high of the trading range, because bears might be willing to sell a new high and bulls might be beginning to take profits at the high.
The same is true in a bear flag after a protracted down move. Sideways bars mean that both buyers and sellers are active, so you do not want to be shorting on a breakout of the low of the flag. However, if there is a short setup near the top of the flag, your risk is small and the trade is worth taking.
Figure 11.1 Subsequent Pullbacks Tend to Get Larger
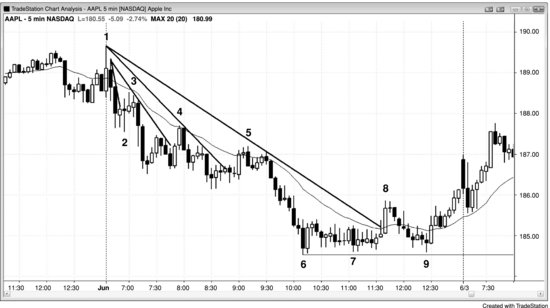
In a trend there will always be pullbacks, and they tend to get larger the longer the trend extends. However, until there is a reversal, each pullback should at least test the prior extreme (in Figure 11.1, in a bear trend, the prior low of the day), and the test will usually create a new extreme.
Bar 1 was a two-legged higher high after a bull trend line break. It reversed down in a two-bar reversal. At that point, smart traders were looking for short entries in the potential new bear trend instead of long entries in the prior bull trend.
Bar 3 was a short after a two-bar pullback to the moving average, which was the first pullback after the two-bar bear spike that started the reversal down from above yesterday's high. It was a breakout pullback following the breakout below yesterday's swing low.
Bar 4 was the first break of a bear trend line and of the moving average, albeit by only a tick or so, and was followed by a new low. It went above a minor swing high, and therefore was a small higher high, but it failed to get above the moving average, the top of the bear spike that followed bar 3, or the swing high before bar 3. Most traders saw this as a simple two-bar reversal and a low 2 short setup at the moving average. There were only two or three bars in each of the legs of this ABC, and that is rarely enough for traders to see this small rally as a trend reversal.
Bar 5 was another test of the moving average, and this time there were two closes above the moving average, but barely, and the pullback was followed by a new low. Instead of moving above the small swing high that followed bar 4, it failed one tick shy and formed a double top. Traders saw bar 4 as a significant lower high because it was followed by a new bear low. Once the market fell to a new low after bar 5, bar 5 became the most recent lower high of significance. Bears moved their protective stops from above bar 4 to above bar 5.
Bar 8 broke a major trend line and formed the first moving average gap bar (a bar with a low above the EMA). The first gap bar is usually followed by a test of the low, but sometimes there is a second entry. The break of a major trend line might be the first leg of a new trend but will usually be followed by a test of the low that can either overshoot or undershoot the low before a countertrend move of at least two legs unfolds (here, in a bear trend, a rally). At this point, traders needed to be looking to buy instead of continuing to trade the old bear trend. The pause bar after bar 8 set up a short because it led to a failed breakout above the bear trend line.
The rally to bar 8 also broke above the minor highs between bars 6 and 7, creating a minor higher high at bar 8. However, bar 8 was still a lower high in the larger bear trend. The market fell for many bars to bar 9, where it tested the bar 6 bear low. However, instead of reaching a new bear low, bar 9 formed a higher low. Most bears would have moved their protective stops to just above the bar 8 high. They would likely have exited sooner, because they decided that the market had reversed to always-in long on the two-bar bull spike up from the bar 9 higher low, or when it went above the two-bar bull flag that formed two bars later. Once the market went above bar 8 and formed a higher high, they expected higher prices.
The market formed a double bottom bull flag at bars 7 and 9. Bar 9 dipped one tick below bar 7, running stops, but it was not able to put in a new low. The bulls were defending their longs and were aggressively buying the dips (accumulation). The second leg up was completed the next day.
Compare the bars 4, 5, and 8 tests of the moving average and notice that bar 5 penetrated it more than bar 4, and bar 8 had more penetration than bar 5. This is to be expected, and when this is the case be careful about placing a short trade, because there will be many smart bears who will short only at a higher price, and many bulls who will be confident enough to buy dips. This reduces the selling pressure and makes your short entry risky.
Figure 11.2 Moving Average Pullbacks
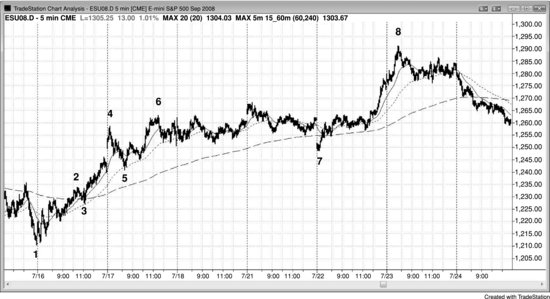
The market reversed at the bar 1 lower low in Figure 11.2. There were several pullbacks to the 20-bar exponential moving average that led to new highs on the move up to bar 4.
Bar 4 was a trend channel line overshoot that led to a sharp correction to bar 5, which tested the 15 minute 20-bar EMA (dotted line) and was then followed by a test of the trend high (bar 6 was a higher high).
The market gapped down to bar 7, and, although the market initially appeared bearish, the move down was the first pullback to the 60 minute 20-bar EMA (dashed line) and it was followed by the bar 8 new high.