Chapter 13
Twenty Gap Bars
When the market stays on one side of the moving average without touching it for 20 consecutive bars or more, the trend is strong, but it is also overdone and will likely soon pull back to the moving average, creating a 20 gap bar setup. If there was no clear trend reversal before the pullback, the first touch is a high-probability scalp for a test of the trend's extreme. There are traders who will enter at or just above or below the moving average with limit and market orders, but it is better to wait for a price action entry (a reversal back in the direction of the trend and an entry on a stop) in case the pullback goes well beyond the moving average. There is nothing magical about 20 bars. It is just a guideline that is useful to remind you that a trend is strong. You can arbitrarily pick any large number of bars and generate a setup that will usually be the same, and it will also work on other time frames. A trend can be extremely strong and still touch the moving average every 30 minutes, and a trend can be away from the moving average for four hours, only to suddenly reverse into an opposite trend. When it occurs on a 5 minute chart and the market has not touched the moving average for at least two hours, I used to refer to it as a two hours from the moving average setup, or a 2HM. Since the same concept works on all time frames, it is more useful to refer to the number of bars instead of the number of hours. The 20 bars can be at any time during the day and not necessarily during the first two hours.
Once you become aware that 20 consecutive gap bars are present, look to fade all touches of the moving average. After one or more moving average tests, there will likely be a test that goes through the moving average and forms a moving average gap bar where the bar is completely on the other side of the moving average so that there is a gap between the bar and the moving average. Look to fade the first gap bar (in a bull trend, buy one tick above the high of the previous bar if the high is below the exponential moving average). If the first entry fails, buy again on the second entry, if there is one. As with all setups, it is not worth buying a third time if the first two setups fail since the market at that point is likely in a channel and not forming a reversal. Since you are trading with the trend, you should swing part of your position because the market may run much further than you thought possible. Moving average tests are particularly reliable in stocks, and often provide great entries all day long. However, if the first moving average gap bar forms after a strong trend reversal, it will likely fail because the trend has now reversed and that gap bar is a setup for the prior trend, which now has ended.
Figure 13.1 Twenty Gap Bars
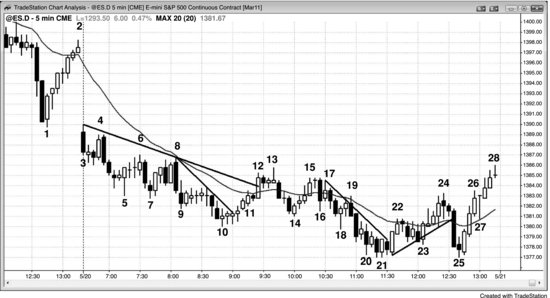
When a trend is so strong that no bar touches the moving average for 20 or more bars, many traders will look to enter on the first pullback to the moving average and hold for a test of the trend's extreme. In Figure 13.1, bar 11 was the first bar to touch the moving average in over 20 bars and, since there was no clear bottom to the bear trend, traders had limit orders just below, at, and just above the moving average to enter short positions. Even though the move up to bar 11 was composed of six consecutive bull trend bars, there was no clear bottom at bar 10 so traders were looking for shorts around the moving average. The shorting resulted in a small bear inside bar after bar 11 instead of a strong bear trend bar, and this meant that most traders believed that the rally at this point was too strong to short. However, the bears became aggressive on the second-entry short below bar 13 (the first entry opportunity was one bar earlier). Because the move up to bar 13 was so strong, traders were looking for a higher low and then a second test up, so most of the shorts exited around the bar 14 higher low test of the bar 10 bear trend low.
Bar 8 did not touch the moving average but was still a two-legged test of the moving average. The bears were so eager to get short that they placed their limit orders at two or three ticks below the moving average because they were not confident that the rally would touch the moving average. If they were confident, they could have placed their limit orders to go short at one tick below the moving average and they then would have become short on the touch of the moving average. When the market turns down just below the moving average, the bears are very aggressive. This is especially evident when the test turns into a large bear trend bar as it did here.
Bars 7, 9, and 10 formed a bear wedge, and this is a reversal pattern. The bar 10 signal bar was not strong enough to convince traders that the market was reversing up, so they were still looking for short setups around the moving average. The bottom was strong enough to have a second leg up to bar 15, where it formed a double top bear flag with bar 13.
Deeper Discussion of This Chart
The market gapped down with a bear trend bar in Figure 13.1, so the breakout might have become a trend from the open bear trend. Two bars later, the breakout failed, but the setup was not strong enough to buy. Instead, the bears should exit and wait. Bar 4 formed a double top bear flag with bar 3 and a two-bar reversal with the following bar. Traders could short the double top on a stop below bar 4 or they could wait. The next bar was a bear trend bar that traded below bar 4, making bar 4 a swing high. Since there was now both a swing low and a swing high and the opening range was less than a third of the recent average daily range, the market was in breakout mode. Bulls would go long on a stop above the trading range, and bears would go short on a stop one tick below the range. The breakout should have follow-through and the day often becomes a trend day, as it did here.
Despite the bear strength in the first half of the day, the bulls broke several bear trend lines. They were able to move the market up after the stop run plunge down to bar 25 that formed a double bottom with bar 21 after a break of the bear trend line on the rally to bar 13. It was also a final flag buy setup for the breakout of the bar 21 to bar 24 bear flag. Bar 13 was also the first gap bar above the moving average in a bear trend, and therefore a sell setup (see next chapter).
Figure 13.2 Twenty Gap Bars Are Not Always a Buy Setup
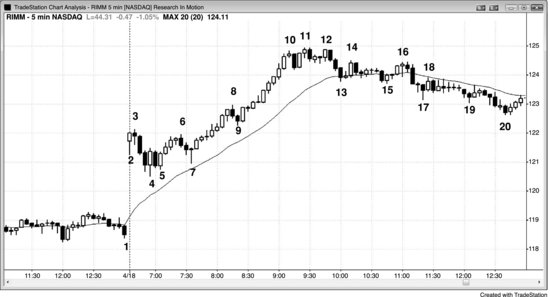
If the market has not touched the moving average for 20 or more bars but there was first a climax, the 20 gap bar setup may not lead to a bounce and a test of the extreme. As shown in Figure 13.2, Research in Motion (RIMM) had a parabolic bull trend up to bar 10. Since a parabolic move is not sustainable, it is a type of climax, and any climax is usually followed by at least a two-legged correction that lasts at least 10 bars, and it can even be followed by a trend reversal. This makes a one-legged correction to the moving average a risky long.
Deeper Discussion of This Chart
Although bulls could have scalped a small profit on a long in Figure 13.2 based on a limit order at the moving average on bar 13, buying a bear spike after a climax is risky, since at least two legs down should be expected. Bar 15 was a better setup since it was a second leg down and it had a good bull reversal bar, but it failed at the bar 16 low 2. Bar 16 was also a double top bear flag with bar 14. Since the market was in a tight trading range, this was not a strong short setup.
The move up to bar 10 had bars that overlapped very little and closed near their highs. The entire rally from bar 7 to bar 10 was so vertical that it was a bull spike. A spike is followed by a pause or a pullback. Here, the pullback began with three bear trend bars forming a spike down to bar 13. When there is a bull spike and then a bear spike, this is a climax reversal, which is a type of two-bar reversal (but this might be evident only on a higher time frame chart). The market usually goes sideways for a while as the bulls keep buying in an attempt to generate a bull channel, and the bears keep selling as they try to push the market down in a bear channel. Here, the bears won and the market fell below the bars 13 and 15 double bottom for a measured move down. When the market fails twice to do something, it usually does the opposite.
Although it is not shown, the bulls were able to create a strong bull channel from the bar 20 low, and the leg up from bar 20 was the exact same height as the bar 4 to bar 10 first leg, forming a leg 1 = leg 2 measured move. The bull spike up to bar 10 was much larger than the bear spike down to bar 13, and it was also a bull spike on a higher time frame. The bear spike got its channel on this 5 minute chart, and then the bull spike got its channel on a higher time frame chart the next day (not shown).
The climax also had a small wedge top. Even though bar 12 was below bar 11, this still functioned like a wedge where arguably the bears were so aggressive that they prevented the third push from exceeding the second. Some traders would see the bear bar after bar 10 as the first breakout below the bull channel and then bar 11 as the breakout pullback to a higher high. This is not strong enough to short, but it is strong enough for bulls to lighten up or exit. Bar 12 was the first bar of a two-bar reversal, which was a lower high or double top with bar 11. Traders could short below that second bar, which was a strong bear trend bar, and the minimum target was a test of the moving average. Bar 17 was the first gap bar below the moving average, but the bull trend had evolved into a trading range (the market had been sideways for 20 to 30 bars), and this was no longer a reliable buy setup.