Chapter 14
First Moving Average Gap Bars
Usually a 20 gap bar setup is followed by a test of the extreme, and the next test of the moving average probes even deeper. A bar may form that is entirely on the other side of the moving average. This is a moving average gap bar, and it sometimes can also be also a 20 gap bar pullback setup. A gap is a general term that simply means that there is a space between two points on the chart. For example, if today's open is above yesterday's close, there is a gap up. If the open is above yesterday's high, there will be a gap on the daily chart. A broader use of the term opens up other trading opportunities. For example, if the high of a bar is below the moving average, then there is a gap between that bar and the moving average. In a bull market or sideways market, there is a good chance that the market will move to fill that gap. Sometimes a bar will go above the high of the previous bar, but then, within a bar or two, the pullback continues down again. If the market again goes above the high of a prior bar, this is a second moving average gap bar setup, or a second attempt to fill a moving average gap in a bull trend, and the odds are excellent that there will be a tradable rally off this setup. Likewise, gaps above the moving average will tend to get filled in a bear trend or sideways market.
If there is a strong trend and this is the first moving average gap bar in the trend, it is usually followed by a test of the trend's extreme. This pullback to the gap bar is typically strong enough to break the trend line and after the test of the trend's extreme, the market will generally form a two-legged correction or even a major trend reversal (discussed in book 3). For example, if there is a strong bull and it finally has a bar that has a high below the moving average and then the next bar trades above the high of that bar, the market will try to form a higher high or lower high test of the bull's extreme. Traders will buy for a swing trade, expecting the market to get near or above the old high. Some traders will scale into additional longs if the pullback below the moving average falls some more (this is discussed in Chapter 31 on scaling into and out of trades). If the market rallies to test the old high but there is then a reversal down, there will usually be a more protracted correction that typically has at least two legs and often leads to a trend reversal.
Most bars on most charts are moving average gap bars because most bars do not touch the moving average. However, if there is not a strong trend and a trader fades one (for example, selling one tick below the low of a bar above the moving average), the trader is often just looking for a scalp to the moving average where he will take profits. A trader will take the trade only if there is enough room to the moving average to make an acceptable profit and only if the trade makes sense in the context of the current price action. So if there is a strong trend, a first moving average gap tends to set up swing trades, and if there is not a strong trend and a trader takes a moving average gap bar trade, she is more likely looking for a scalp.
Figure 14.1 Moving Average Gaps, Second Signals
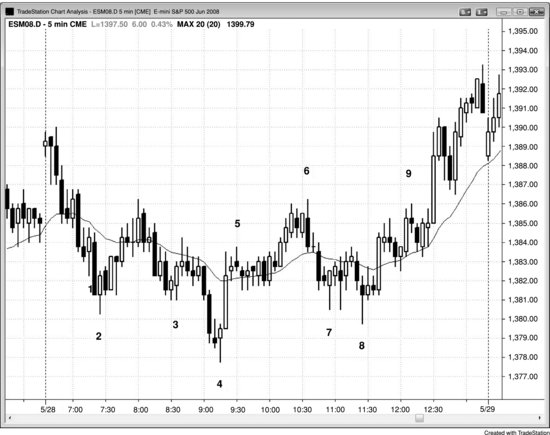
In Figure 14.1, bar 2 was a second attempt to fill the gap below the moving average in a sideways market. The downward momentum was somewhat strong, which arguably means that the market is not sideways today, but the moving average was basically flat because of yesterday's strong close. Also, there were several bars that overlapped with the bar or two bars before, and bar 2 was the third push down after the two-bar bear spike created by the third and fourth bars of the day. Bulls placed buy stops to go long at one tick above the high of bar 2 and looked to take a scalper's profit on a test of the moving average.
Bars 3, 4, and 8 were also second attempts (the first attempt can be simply a bull trend bar), or second moving average gap bar entries.
Bar 5 was a moving average gap bar, but traders would not short it for a scalp to the moving average both because there was not enough room for a scalp and because it followed a strong reversal up and a higher low and a second leg up was likely after the bar 4 lower low reversal up.
Bars 6 and 9 were second moving average gap bar short setups. Once the market broke above bar 9, there was then a bull trend because two attempts to go down failed (bar 9 was a second moving average gap bar setup, which means that it was a second attempt to close the gap to the moving average).
Bar 7 was a moving average gap bar setup, but since there was so little room to the moving average, traders would be less likely to buy it for a scalp solely based on its being a moving average gap bar.
Deeper Discussion of This Chart
The market broke to the upside in Figure 14.1, but the first bar of the day was small and therefore not a reliable signal bar for a failed breakout short. The third bar was a strong bar and therefore a better setup for a possible trend from the open bear trend.
Bar 6 was an outside down reversal from a spike and channel bull trend that began with the spike up after bar 4.
Bar 8 was the signal bar for the small expanding triangle that began with the bar 7 low. It can also be viewed as a wedge, since it was a breakout below a small double bottom and the breakout failed. Bar 8 was also a wedge bull flag after the bar 4 bottom; the three pushes down were the bar after bar 5, bar 7, and bar 8. Finally, bar 8 was the higher low after the spike up to bar 5 that followed the bar 4 lower low.
The breakout above bar 9 was a failed wedge bear flag, and therefore a measured move up was likely. The three pushes up were two bars before bar 8, the swing high before bar 9, and bar 9.
Figure 14.2 Moving Average Gap and Test of Extreme
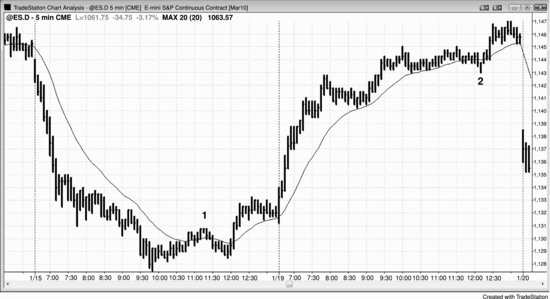
A first moving average gap bar can lead to tests of the trend extreme. In Figure 14.2, both bars 1 and 2 were first moving average gap bars in strong trends and were followed by tests of the trend extreme. Bar 1 was the first bar in the bear trend where the low of the bar was above the moving average (a gap between the bar and the moving average), and it was followed by a higher low test of the bear low. Bar 2 was followed by a new trend extreme.