Chapter 15
Key Inflection Times of the Day That Set Up Breakouts and Reversals
The market often breaks out or reverses within a bar before or after 7:00 a.m. and 7:30 a.m. PST on economic reports, at 11:30 a.m. PST, and less often around 11 a.m. and noon PST. Very commonly on strong trend days there will be a strong countertrend panic move that will scare people out of their positions, and this normally happens between 11:00 and 11:30 a.m., although it can come earlier or later. Once it is clear that you were fooled by a strong countertrend move, the trend will usually have gone a long way back toward its old extreme, and you and the other greedy traders who were trapped out will chase it, making it go further. What causes the move? Institutions benefit from the sharp countertrend spike because it allows them to add on at much better prices, expecting the trend to resume into the close. If you were an institutional trader who wanted to load up going into the close and you wanted to enter at much better prices, you would be looking to create or contribute to any rumor that could cause a brief panic that ran stops and briefly caused the market to spike beyond some key level. It doesn't matter what the rumor or news item is or whether some institution spreads it to make some money. All that matters is that the stop run gives traders who understand what is going on an opportunity to piggyback on the institutions and make a profit off the failed trend reversal.
The stop-run pullback usually breaks a significant trend line, so the run to the new extreme (a higher high or lower low test following a trend line break) prompts smart traders to look for a trade in the opposite direction in the first hour of the next day.
This type of trap is common on trading range days as well, where the market has been hovering near one extreme for a couple of hours in what appears to be an incipient breakout, only to make a sharp move to take out the other extreme, and this opposite breakout often fails around 11:30 a.m. PST. This traps out the earlier traders who were positioning themselves for the breakout in one direction and traps in the new breakout traders who entered on the breakout in the other direction. Most trading range days close somewhere in the middle.
Figure 15.1 Late Stop Runs
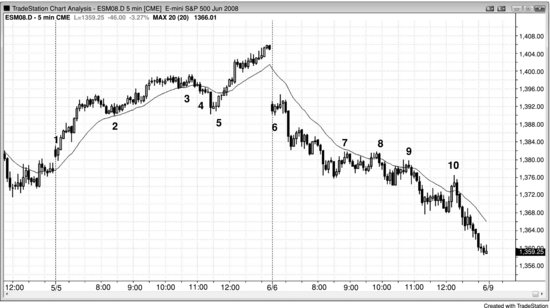
In Figure 15.1 there are two 20 gap bar setups that formed on late stop runs. Bar 5 was the entry after the 11:25 a.m. PST stop run, and it was also a second entry on a moving average gap setup (a second moving average gap bar long setup, after the first entry above the bar after the bar 4 bear spike). Notice how strong the bear trend bar was with a large body and a close near its low. This bear breakout bar made the weak hands think that the market had turned into a bear trend. Smart traders looked at this as a great buying opportunity and expected it to be an exhaustive sell climax and a failed breakout. This type of stop run usually breaks the major trend line, and, since it is usually followed by a new extreme in the trend, it often sets the stage for a trade in the opposite direction in the first hour of the next day (here, a higher high after the break of the bull trend line). It formed a double bottom bull flag with the bar 2 start of the bull channel.
On both days, the moving average gap fades developed after two or more tests of the moving average. After the countertrend traders were able to bring the market back to the moving average multiple times, they developed the confidence to press their bets, resulting in a gap bar beyond the moving average. However, the first such breakout beyond the moving average usually fails and provides a great fade for the expected trend resumption.
On the first day, the market tried to reverse down at 7 a.m., presumably on a report. Since the day was a trend from the open bull trend at that point, the one-bar sell-off was the first pullback in a trend from the open day, and therefore a buy setup. The failed reversal was followed by a three-bar bull spike and then a channel.
On the second day, the 7 a.m. reversal succeeded and became a three-bar bear spike that was followed by a bear channel.
On the second day the market tried to reverse up from a final bear flag at noon, but the reversal failed at the bar 10 moving average gap short setup.
Figure 15.2 Late Bull Trap
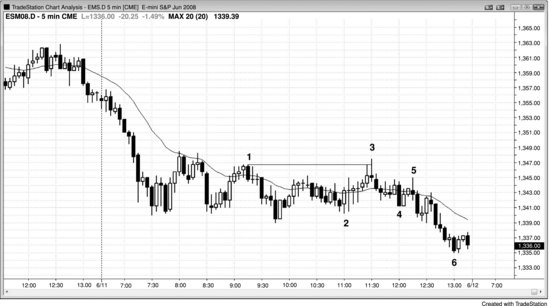
On a bear trend from the open in Figure 15.2, followed by an inability to get above the moving average, traders were expecting an 11:30 a.m. PST bull trap, and it occurred today exactly on time. Bar 3 was also the first moving average gap bar in a bear trend. Usually, the trap is a strong countertrend leg, getting hopeful longs to buy aggressively, only to get forced into liquidation as the market quickly reverses back down. Today, however, the rally from bar 2 was composed of large overlapping dojis, indicating that traders were nervous in both directions. If there was no conviction, then how could traders get trapped? Well, the bar before bar 3 attempted to form a double top bear flag, and bar 3 spoiled it by going above the bar 1 high. This made many traders give up on the bear case, forcing the shorts to liquidate, and it trapped some bulls into longs on the breakout. The momentum leading to the breakout was weak, so there were probably not too many trapped bulls. However, by failing to form a perfect double top with bar 1, it trapped bears out. Since it was a trap, there was fuel for the short side as those bears who were trapped out now had to short lower and chase the market down, and those trapped bulls had to sell out of their longs. The weakness of the down leg from bar 3 is consistent with the weakness of the up leg from bar 2, but the result was as expected—a close on the low of the day. This was a bear trend resumption day, but since the resumption started so late and it followed a tight trading range with strong two-sided trading (large, overlapping bars with big tails), it resulted in a smaller leg than the sell-off at the open.
Figure 15.3 Late Trap on Trading Range Day
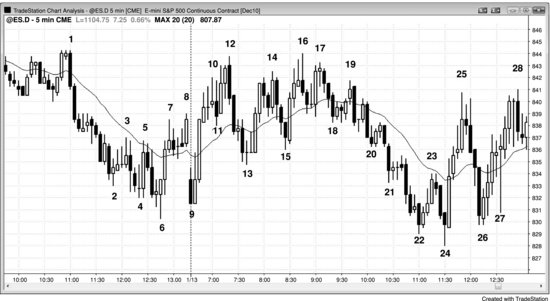
There is often an 11:30 a.m. PST trap on trading range days as well (see Figure 15.3). Here, after spending a couple of hours in the upper half of the day's range, the market ran through the low of the day, trapping out the bulls and trapping in new shorts. The market gave a second entry high 2 long above bar 24 on the 11:35 a.m. bar. The market made two attempts to break out below the bar 9 low of the day and failed, so it was likely to try the opposite direction. Most trading range days close somewhere in the middle.
The day opened as a trend from the first bar bull trend and pulled back below the bar 10 signal bar at 7:00 a.m., which was likely on some kind of report. Since there were three large sideways bars with prominent tails, this represented a small trading range and buying above it was risky. So the market broke briefly to the downside on the report, trapping bears in, and then it broke to the upside above bar 11, trapping bulls in and bears out; it then turned down a second time at bar 12. When there are trapped bulls and bears, in or out, the next signal is usually good for at least a scalp.
Deeper Discussion of This Chart
The rally into yesterday's close in Figure 15.3 was a reversal up from a wedge bottom and was likely to have at least two legs. The higher low reversal up at bar 9 was close enough to be a double bottom, and the bar 13 higher low at 7:40 a.m. PST was a double bottom pullback. Since the rally off the open was a strong spike up, the market was likely to try to form a channel after a pullback, but it failed with the bar 12 double top with bar 1. This was followed by several bear spikes over the next hour and ultimately a bear channel that reversed up at bar 24 at 11:30 a.m. The bar 22 reversal attempt at 11:00 a.m. failed. The market was in too steep a bear channel, so the first breakout of the channel was likely to be followed by a breakout pullback and a higher-probability long, and bar 24 was the signal bar. It was also the second attempt to reverse up from a new low of the day.
The push up to bar 12 created a wedge bear flag, with bars 5 and 8 being the first two pushes up. The market was too steeply up to short the bar 11 breakout of the tight bull channel up from bar 9, but shorting the breakout pullback to the bar 12 higher high was reasonable. It would be safer to wait for the bar 12 outside down bar to close, to see if the bears could own the bar. The close near the low confirmed the strength of the bears, so shorting below it on the beginning of the follow-through was a good entry.