Chapter 16
Counting the Legs of Trends and Trading Ranges
Trends often have two legs. If the momentum on the first leg after the reversal is strong, both the bulls and the bears will wonder if it will be the first of possibly many legs, creating a new trend. Because of this, both bulls and bears will expect that a test of the old trend's extreme will fail and the with-trend (with the old trend) traders will be quick to exit. For example, if there is a strong move up after a protracted bear trend, and this up move goes above the moving average and above the last lower high of the bear trend and contains many bull trend bars, both the bulls and the bears will assume that there will be a test of the low that will hold above the bear low. Once the momentum of this first up leg wanes, bulls will take partial or full profits and bears will short, just in case the bears are able to maintain control of the market. The bears are not certain if their trend is over and will be willing to initiate new short positions. The market will work down since buyers will be reluctant to buy until there is more bullish price action. As bulls come back in on the pullback that is testing the low, the new bears will be quick to exit because they don't want to take a loss on the trade. The buying by the bears covering their shorts will add to the upward pressure. The market will then form a higher low. The bears will not consider shorting again unless this leg falters near the top of the first up leg (a possible double top bear flag). If it does, the new bulls will be quick to exit because they won't want a loss, and the bears will become more aggressive since they will sense that this second leg up has failed. Eventually, one side will win out. This kind of trading goes on all day long in all markets and creates a lot of two-legged moves.
In fact, after the market makes a move of any size in one direction, it will eventually try to reverse that move and will often make two attempts at the reversal. This means that every trend and every countertrend move has a good chance of breaking down into two legs, and every leg will try to subdivide into two smaller legs.
When you are looking for a two-legged move and see one but the two legs are in a relatively tight channel of any kind, such as a wedge, they might in fact be subdivisions of the first leg and the channel may actually be only the first of two legs. This is especially true if the number of bars in each of the two legs looks inadequate compared to the pattern it is correcting. For example, if there is a wedge top that lasts for two hours and then a three-bar bear spike and then a three-bar channel, it is likely that the spike and channel together will be only the first leg down, and traders will be reluctant to buy heavily until after they see at least one more leg down.
Figure 16.1 Two-Legged Moves
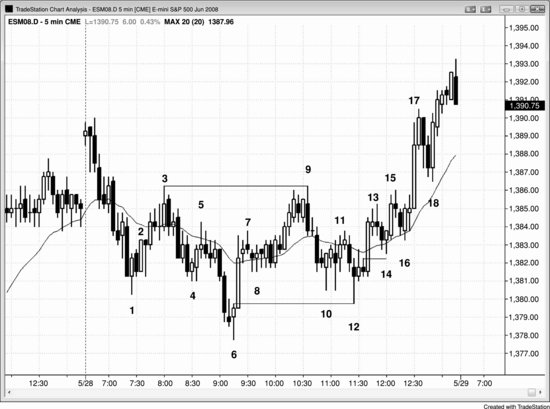
In Figure 16.1, the bear trend down to bar 6 occurred in two legs and the second leg subdivided into two smaller legs. The move up to bar 9 was also in two legs, as was the move down to bar 12. All spike and channel patterns are two-legged moves by definition, because there is a high-momentum spike phase and then a lower-momentum channel phase.
Bar 12 was a perfect breakout test of the start of the bull move. Its low exactly equaled the high of the bar 6 signal bar, running the breakeven stops of the bar 6 longs by one tick. Whenever there is a perfect or near-perfect breakout test, the odds are high that the market will make about a measured move (expect the move up from the bar 12 low to be equal in points to the move from bars 6 to 9).
There was a two-legged move up to bar 15, but when its high was surpassed, the market ran up quickly in a bull spike as the new shorts had to buy back their positions from the failed low 2 off the bar 15 short setup. Bar 9 had formed a double top bear flag with bar 3, and its failure on the rally up from bar 16 also contributed to the bull breakout.
Figure 16.2 Double Top Bear Flag
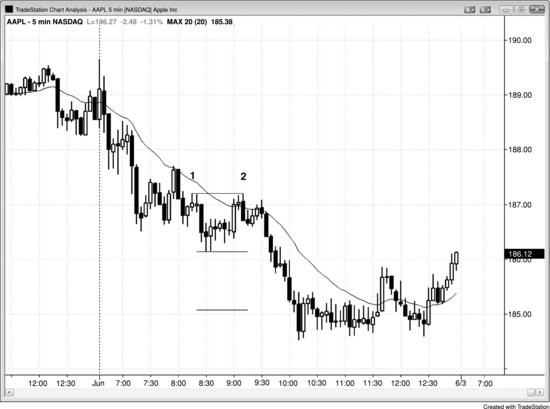
Apple (AAPL) was a well-behaved stock on the 5 minute chart shown in Figure 16.2. It formed a double top bear flag at bar 2 (1 cent below the high of bar 1), and the move down more than met the approximate target of twice the height of the trading range. Bar 2 was also the top of a two-legged move up to the moving average in a bear trend, forming a bear low 2 short at the moving average, which is a reliable entry in a trend. Trends in many stocks are very respectful of the moving average, which means that the moving average provides opportunities all day long to enter in the direction of the trend with limited risk. Four bars after bar 2 set up a double top pullback short.
Figure 16.3 Wedge Top
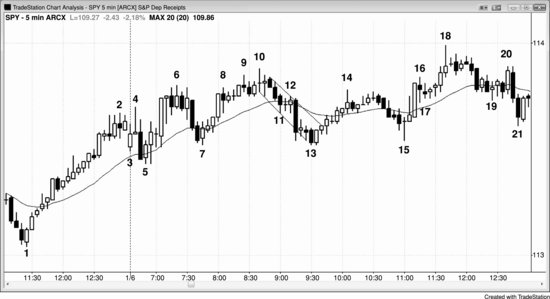
In Figure 16.3, the SPY had a wedge top created by bars 4, 6, and 10, which is usually followed by a two-legged sideways to down correction. There was a three-bar bear leg that ended at bar 11 and a second leg down that ended at bar 13. This move was in a channel and would be just a single leg on a higher time frame chart. It was comparable in size to the leg up from bar 7 to bar 10 and therefore most traders would not be confident that it contained enough bars to adequately correct the large wedge. The market had a second sideways corrective leg to bar 15, slightly above the bar 13 low, creating a double bottom that was followed by a bull spike and channel up to a new trend high.