Chapter 21
Example of How to Trade a Trading Range
When the market is in a trading range, traders should be guided by the maxim “Buy low, sell high.” Also, think of your trades as scalps and not swings. Plan to take small profits and do not hold on hoping for a breakout. The rallies to the top usually look like they will become successful breakouts into a bull trend, but 80 percent of them fail, and 80 percent of the strong sell-offs to the bottom of the range fail to break out into a bear trend. Try to keep your potential reward at least as large as your risk so your winning percentage does not have to be 70 percent or higher. Since the market is two-sided, there will often be pullbacks after you enter and before you exit, so do not take a trade if you are unwilling to sit through a pullback. If the market has been going up for five to 10 bars in a trading range, it is usually far better to look only for shorts and to take profits on longs. If it has been going down for a while, look to buy or to take profits on shorts. Rarely enter on stops in the middle of the range, but it is sometimes reasonable to enter on limit orders there.
Among the best trade setups, beginners should focus on entries that use stops so that the market is going in their direction when they enter:
- Buying a high 2 near the bottom of the range. These are often second attempts to reverse the market up from the bottom, like a double bottom.
- Selling a low 2 near the top of the range. These are often second attempts to reverse the market down from the top, like a double top.
- Buying at the bottom of a trading range, especially if it is a second entry after a break above a bear trend line.
- Shorting at the top of a trading range, especially if it is a second entry after a break below the bull trend line.
- Buying a wedge bull flag near the bottom.
- Selling a wedge bear flag near the top.
- Buying a bull reversal bar or reversal pattern like a final flag (discussed in book 3) after a break below a swing low at the bottom of the range.
- Selling a bear reversal bar or reversal pattern like a final flag (discussed in book 3) after a break above a swing high at the top of the range.
- Buying a breakout pullback after an upside breakout near the bottom of the range (for example, if the market starts up and pulls back, look to buy above the high of the prior bar).
- Selling a breakout pullback after downside breakout near the top of the range (for example, if the market starts down and pulls back, look to sell below the low of the prior bar).
Entering using limit orders requires more experience reading charts, because the trader is entering in a market that is going in the opposite direction to the trade. Some traders trade smaller positions and scale in if the market continues against them; but only successful, experienced traders should ever attempt this. Here are some examples of limit or market order trade setups:
- Buying a bear spike at the market or on a limit order at or below the low of the prior swing low at the bottom of the range (entering in spikes requires a wider stop and the spike happens quickly, so this combination is difficult for many traders).
- Selling a bull spike at the market or on a limit order at or above the high of the prior swing high at the top of the range (entering in spikes requires a wider stop and the spike happens quickly, so this combination is difficult for many traders).
- Buying at the close or below the low of a large bear trend bar near the bottom of the range, since it is often an exhaustive sell climax and the end of the sell-off in a trading range.
- Selling at the close or above the high of a large bull trend bar near the top of the range, since it is often an exhaustive buy climax and the end of the rally in a trading range.
- Buying at or below a low 1 or 2 weak signal bar on a limit order at the bottom of a trading range.
- Shorting at or above a high 1 or 2 weak signal bar on a limit order at the top of a trading range.
- Buying a bear close at the start of a strong bull swing.
- Selling a bull close at the start of a strong bear swing.
Figure 21.1 Fading Extremes for Scalps in Trading Ranges
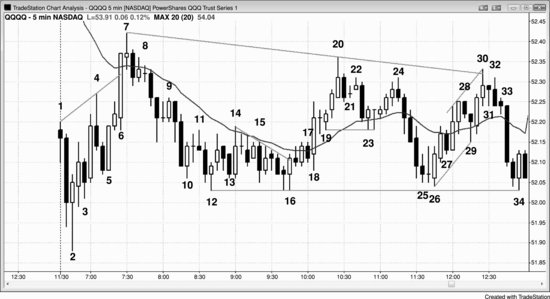
There are many ways to trade a trading range day like the one in QQQ shown in Figure 21.1, but, in general, traders should look to fade the extremes and only scalp. Although there are many signals, traders should not worry about catching all of them or even most of them. All a trader needs is a few good setups a day to begin to become profitable.
I have a friend who has traded for many decades and who does extremely well on days like this. I have watched him trade the Emini in real time, and he would take about 15 profitable one-point scalps on a day like this, all based on fades. For example, in the bar 10 to bar 18 area, he would try to buy with limit orders below everything, like as the market fell below bar 10, as bar 13 went below the bear bar before it, and as bar 15 fell below the bar before it, and he would have added on as it fell below bar 13. He would have bought more as the market dipped below bar 15, and he would have tried to buy if the market fell below bar 12. It is important to remember that he is a very experienced trader and has the ability to spot trades that have a 70 to 80 percent chance of success. Very few traders have that ability, which is why beginners should not be scalping for one point while risking about two points. At a minimum, they should take trading range trades only where they believe the probability of success of an equidistant move is at least 60 percent. Since they would have to risk about two points on this chart, they should trade only if they are holding for at least a two-point profit. That means that they should look to buy near the bottom of the range and short near the top.
If traders bought near the bottom of the range, they should look to take profits near the top of the range. They should also look to initiate shorts near the top of the range and take profits on those shorts when the market moves toward the bottom of the range. Reversing is too difficult for most traders, and instead they should use profit targets for exits and then look for a trade in the opposite direction. For example, if they bought on bar 16 as it went above the high of the prior bar and triggered the double bottom bull flag entry, they could have a sell limit order to exit with a 10, 15, or 20 cent profit on the move up to bar 20. After they exited, they could then look for a short setup, like below the bar 22 lower high or below the bar 24 lower high. The latter was a better setup because it had a strong bear reversal bar and it was a double top bear flag with bar 22.
So when did traders conclude that this was a trading range day? Everyone is different, but there are often clues early on, and as more accumulate, traders become more confident. There were signs of two-sided trading right from the first bar, and other signs accumulated on just about every following bar. The first bar of the day was a doji, and that increased the chances of a trading range day. The market reversed up at bar 3 but had weak follow-through on the move up to bar 4. The first three bars had tails at their lows, and bar 2 overlapped about half of the prior bar. Bar 3 was a reversal down immediately after the long entry, and the next bar was a reversal up. The market reversed down again at bar 4 and up again at bar 5, and down again at bar 7 at the moving average. Whenever the market has four or five reversals in the first hour, the odds of a trading range day increase.
Bar 6 was a strong bull trend bar but there was no follow-through. It stalled at the moving average, and the next bar was a doji instead of another strong bull trend bar with a close well above the moving average. The next bar was a bear trend bar, and the two bars after also failed to close above the moving average. The bulls were not in control, despite a strong rally, so the market was two-sided.
Bar 2 was the start of a two-bar bull spike, and it was followed by a three-push bull channel up to bar 7. Since bar 2 was a strong bull reversal bar after a gap down and a sell-off, it was a good opening reversal and a possible low of the day. The day could have become a strong bull trend day but instead went sideways. However, it never dropped below the entry bar low.
Bar 2 was the first bar of a two-bar bull spike, and bars 4 and 7 were the second and third pushes up in a wedge channel after the spike. A channel in a spike and channel pattern is the first leg of a trading range, so most traders assumed at this point that the market would be in a trading range for at least the next 10 to 20 bars and maybe for the rest of the day. They looked to buy a two-legged sell-off that would test the bar 3 or bar 5 low, since those bars formed the bottom of the bull channel. Even if they believed that the day might become a trend day, they saw it as a trading range for the time being and were therefore only scalping. Their scalping reinforced the trading range, because when lots of traders are selling near the high and buying near the low, it is very difficult for the market to break out into a trend.
Traders would have bought above bar 2 for at least a test of the moving average. Some traders would have shorted the bar 4 bear reversal bar at the new high of the day, but most would have assumed that the buying pressure from the bar 2 reversal bar, the two-bar bull spike, and the bull bar before bar 4 was strong enough for the market to test the moving average, even if there was a pullback. Because of this, many traders placed limit orders to buy at and below the bar 4 low, and they would have put their protective stops below the long entry bar after bar 2 or even below the bar 2 signal bar low. Some would have used a money stop, like around the height of an average bar so far today, maybe 10 to 15 cents. Some traders might have thought that the bears could have made a 10 cent scalp down from bar 4. That would require a 12 cent move below bar 4, so they might have used a 13-tick stop. They would have assumed that the short would have been a scalp, and therefore the bears would have had limit orders to buy back their shorts at 11 cents below the bar 4 low so that they could scalp out 10 cents on the shorts that they had entered on a stop at one tick below bar 4.
Alert traders would have placed a stop order to go long above the bear entry bar after bar 4 since they knew that the bar 4 signal bar was strong enough to entice shorts, and those shorts would be worried about a reversal up to the moving average. They would have their protective stops above their entry bar and not look to short again until the market reached the moving average. This made buying above that entry bar a great long scalp.
The bulls doubted that the bar after bar 5 was a reliable short, so they placed orders to buy one tick above, at, and below its low, expecting it to be a failed lower high. Only the long limit orders at one tick above the low got filled, which means that the bulls were very aggressive. The result was a strong bull trend bar up to the moving average. This was a strong bull breakout, but traders wondered why it stopped at the moving average instead of going far above. They needed to see immediate follow-through or they would suspect that this was going to be a failed breakout above the opening high. Maybe bar 6 was just a buy vacuum caused by the strong traders temporarily stepping aside. If they assumed that the market was going to test the moving average, it made no sense for them to sell just below the moving average. The absence of strong bulls and bears allowed the market to race up. However, once the market reached the area where they thought it was likely to stop, they appeared out of nowhere and sold aggressively, overwhelming the weak bulls. The strong bulls sold out of their longs for a profit, and the strong bears sold to initiate new shorts. Bears who saw the day as a likely trading range day would have had limit orders to sell as bar 6 moved above the moving average, while others would have shorted its close. Some would have been willing to scale in higher, especially after the weak follow-through on the next bar.
As the market traded down, it was clear to most traders that both the bulls and the bears were strong and that the market was likely to remain two-sided as both sides fought for control. This meant that a trading range was likely. When the market got near the top, the bulls became concerned that it was too expensive to buy and the bears saw it as a great value to short. This made the market fall. The bears who were eager to short near the top were not interested in shorting near the bottom, so selling dried up. The bulls who were willing to buy in the middle saw the bottom of the range as an even better value; they bought there aggressively, lifting the market back up.
Bears were willing to short below the bar 7 test of the moving average. If the bulls were strong, there should have been a strong move above the moving average and not this stall. Bar 7 made bar 6 look more like exhaustion than a strong breakout. Other bears shorted below the bar 8 ii pattern or below the bear bar that followed bar 7. The two-bar bear spike from the ii was reasonably strong, but it had a tail at its low, indicating some buying. At this point, the market had a strong spike up from the low of the day to bar 7 and now a strong spike down. Traders were expecting a trading range.
Bar 9 was a bull trap. Most traders saw the doji inside bar before it as a bad buy signal after the bear spike, and many placed limit orders to go short at the high of the doji bar. They were looking for a pullback to the area of the bottom of the bull channel around the bar 5 low. This was also in the area of the bar 2 signal bar high, which was a magnet for a breakout test. The bulls wanted a double bottom bull flag to develop in the bar 3 or bar 5 low area, but they also wanted the original entry bar low to hold (the low of the bar after bar 2). Otherwise, they would have probably given up on the belief that there was still a chance of a bull trend day.
Bar 10 was the third push down from the bar 7 high, and it was a strong bull trend bar. Bulls were concerned that the move down was in a tight channel and that the first breakout attempt might fail. Many bulls would have waited for a breakout pullback before buying. Some who did buy bought a smaller position, in case the market traded down closer to the bar 3 low, and they planned to buy more on a second signal up, which they got at bar 12. Others thought that many traders would have a 10 cent stop on their longs, so they placed a limit order to buy more 10 cents down, exactly where those weak bulls would be exiting. They then would put a protective stop on their entire position at maybe 10 more cents down, below the entry bar after bar 2, or even below bar 2. The traders who were willing to risk to a new low of the day might have traded even smaller to allow for a second scaled-in long about 10 cents below their first.
The bar 12 bull reversal bar was an approximate double bottom with the bar 3 or bar 5 low, and it was a second signal. This made it a high 2 near the bottom of the trading range. It was the fourth push down from the high of the day, and some traders saw it as a high 4 bull flag. The bear spike down after bar 8 was the first push down for many traders, and bar 12 was the third. Many spike and channel patterns end in a third push like this and then try for a two-legged rally to test the top of the bear channel, which was around the bar 9 high. Some traders thought that the move down to bar 12 was in too tight a channel to buy, and they would have waited for a clear second signal. Many would not have bought until they got a relatively small bar near the bar 12 low. These traders could have bought on bar 16 for the double bottom bull flag. Bar 14 was strong enough to break above the bear channel, and then the market had a two-legged pullback. Bar 16 was also the entry for a wedge bull flag where bar 10 was the first push down and bar 12 was the second. Others saw bar 13 as the first push down and bar 15 as the second. It was also a descending triangle, and bar 16 was the breakout to the upside. Since it was a strong breakout bar, traders were looking to buy a breakout pullback. They would have limit orders to buy at or below the low of the prior bar and they would have been filled on bar 18. Others would have bought the close of the bear bar 17 since they thought that a breakout pullback and a higher low were more likely than a failed breakout and a move below the bar 16 bottom of the trading range.
Traders used that same logic and bought below the bar after bar 12, believing that it was a bad low 2 short since it was at the bottom of the trading range, and it was after the second reversal up where both reversals had good buying pressure (good bull reversal bars). Some would have bought on the close of the bear bar after bar 12 or on the bear close of bar 13, expecting the bar 12 low to hold. Others would have bought above bar 13, thinking that there were trapped bears and therefore the market could move up quickly as the bears covered.
Since this was a tight trading range, it was an area where both the bulls and the bears saw value. Both were comfortable initiating trades there. In an established area of value for both the bulls and the bears, breakouts usually cannot go too far before the market gets pulled back into the range. It has a strong magnetic pull, and bears will short more heavily above, while bulls will buy more heavily below.
Bar 18 was a large bull trend bar that broke out above the trading range of the past hour or so. However, since the overall day was in a larger trading range and the market was now in the middle of that larger range, traders were hesitant to buy. This resulted in the ii pattern. Some traders bought the bar 12 close and the breakout above bar 12. Others bought during the ii and above the bar 19 bull inside bar. Traders tried to buy on limit orders at and below the low of the inside bar after bar 18 but they did not get filled. This made them more willing to buy the breakout above bar 19. They saw that their buy orders did not get filled below and thought that this was a sign of urgency by the bulls.
The bar 18 breakout spike was followed by a small parabolic climax to bar 20 where a two-bar reversal down set up. The entry was below the lower of the two bars and it was not triggered until three bars later. Traders who believed that the day was a trading range day were looking to short a strong rally to near the high of the day. Bar 21 was a small doji and therefore a weak high 1 buy setup, especially after a buy climax. Bears shorted above its high. Others shorted below bar 22, where the bulls were selling out of their longs. They had bought at the top of a trading range, hoping for a bull breakout, and when it did not happen, they were quick to exit. As they did, they triggered the two-bar reversal short at the bar 20 high.
The market fell to the moving average and formed a high 2 buy signal with a bull reversal bar. This is a very reliable setup in a bull trend, but most traders still saw the day as a trading range day. Many bought above bar 23 with the hope that the day would become a bull trend, but they planned to exit quickly if there was not a strong bull breakout. They were concerned that the bar after bar 23 was a doji inside bar, because they wanted a sense of urgency, not hesitation.
They exited their longs, and bears shorted below the bar 24 bear reversal bar, which formed a double top bear flag with bar 22. Some saw it as a low 2 short with bar 22 and others saw it as a wedge top where bar 20 was the first push up and bar 22 was the second.
There was a strong bear spike to the bottom of the trading range, but bar 25 had a small bear body, indicating hesitation. The bulls were unable to create a breakout, and the result was only a trading range. The trading range failed to resist the magnetic pull of the bar 10 to 16 tight trading range. If this was a strong bear trend, the market would not have hesitated once it got back into the tight trading range from earlier in the day. Instead, it would have fallen below it in a series of strong bear trend bars. This told traders that the bears were not strong and that this might just be a sell vacuum. Strong traders might have stepped aside, expecting a test of the bottom of the range. Once the market got there, they began buying aggressively and relentlessly, the bulls initiating new longs and the bears taking profits on their shorts. They were determined to keep the market above the trading range low. Bar 26 was a high 2 at the bottom of the trading range and a strong bull reversal bar. Bar 25 was the high 1 setup. The bars 25 and 26 area formed a double bottom bull flag with the bars 12 to 16 area. This second bottom was also the breakout pullback from the bar 10 to bar 17 tight trading range.
Bar 26 had good follow-through on the next bar, and traders expected this test down to fail. Some bought the close of the bar 27 bear trend bar. Others placed limit orders to buy at and below the bar 27 low. The buying was so aggressive that the market could not even get to the bar 27 low. Alert traders saw this and quickly placed orders to buy on a stop above the bar 27 high. This resulted in a breakout formed by two bull trend bars.
Bar 28 was a bear inside bar, but the move up from bar 26 was in a tight channel so the first attempt down should fail. Bulls placed limit orders to buy at and below the low of bar 28. The move down to bar 26 was a large two-legged move where bar 23 ended the first leg. This was a large bull flag, and the move up to bar 28 was the breakout. Bar 29 was the pullback from that breakout, and it was also the failed breakout of the bottom of the micro channel from bar 26 to bar 28.
Bar 30 was a dueling lines pattern, and bulls took profits as the market went above the two lines, creating the tail at the top. Others exited on the weak close and still others below the bar 31 two-bar reversal top.
Bar 31 was a doji and therefore a weak high 1 signal bar. Also, the spike from bar 26 to bar 30 was not strong enough to be buying a second high 1 (bar 29 was the first), and the day was a trading range day, not a clear bull trend day. Bears saw this as a bad high 1 at the top of a trading range and they shorted at the bar 31 high.
Other bears shorted below the bar 32 bear reversal bar. Some saw bars 30 and 31 as a two-bar reversal and others ignored bar 31 and saw bars 30 and 32 as a two-bar reversal. It was also a micro double top. The market went up on bar 30, down on bar 31, then up again on bar 32, and then down by the close of the bar. The market also made three pushes up on the day where bars 7 and 20 were the first two, so the day was a large triangle. The entry bar after bar 32 broke below the bull trend line from bars 26 and 29 (although not shown), and the market sold off sharply into the close on the second bar below the trend line.
There were many bull triangles between bars 10 and 16. Since the pattern was forming above the bottom of the bull spike up to bar 7, many traders thought that there might be a channel up that would test the bar 7 high at a minimum. There were also several bull spikes in this trading range, creating buying pressure and evidence for the bulls that the market was trying to form a higher low. Since none of the triangles was perfectly clear, not all traders agreed that any one was strong enough to make the market always-in long. Bars 10, 12, and 16 were three pushes down and formed a descending triangle. Bars 13, 15, and 16 were also three pushes down and a triangle. Some traders thought of it as a wedge bull flag. Another wedge bull flag was formed by the bear bar that formed two bars after bar 14, bar 15, and bar 16.