Chapter 22
Tight Trading Ranges
A tight trading range is a common pattern that has been called many different things, but none of the terms is adequately descriptive. It is any sideways channel of two or more bars with lots of overlap in the bars, multiple reversals, many dojis, prominent tails, and both bull and bear bodies, and it can extend for a dozen or more bars. Most stop entries result in losses and should be avoided. If the average daily range in the Emini has been about 10 to 15 points, then any trading range that is three points tall or smaller is probably a tight trading range. A range of four and sometimes five points can sometimes behave like a tight trading range as well if the bars are large.
The bulls and the bears are in balance, and traders are waiting for a breakout and then the market's reaction after the breakout. Will the breakout continue, maybe after a small pullback, or will the pullback grow into a reversal and soon be followed by a breakout through the opposite side of the trading range? Just because the market is sideways, do not assume that the institutions have mostly stopped trading. The volume within each bar usually remains high, although less than that of the bars of the trend that preceded it. The bulls and the bears are both aggressively initiating new trades as they both fight to create a breakout in their direction. Some traders are scalping in and out, but others are adding to their positions and eventually reach their maximum size. Eventually one side wins and the other side gives up, and a new trend leg begins. For example, if there is a tight trading range that lasts a long time and many bulls have reached a position size that they do not want to exceed, then when the market begins to test the bottom of the range, there are not enough bulls left to lift the market back to the middle or top of the range. The market then begins to break to the downside, and these bulls who cannot or will not increase the size of their large positions only hope that there are other bulls with enough buying power to reverse the bear breakout. With each new lower tick, more bulls sell out of their longs and take their losses, and they will not consider buying again for at least several more bars. This selling pushes the market down further, causing more bulls to sell out with losses. The selling can accelerate as the remaining bulls give up, sell out, and wait for another possible bottom. This process occurs in all trading ranges, and also contributes to the late breakouts in trending trading range days. For example, if there is an upside breakout, it is in part because there are too many bears who are no longer able or willing to increase the size of their positions, and not enough left to resist the next test of the top of the range. The market breaks out, and the bears begin to buy back their shorts and become unwilling to sell again for at least several bars. The lack of selling by the bears, along with their buying as they cover their shorts, creates a one-sided market that forces the remaining bears to buy back their shorts. This short covering, along with buying by the bulls, often leads to a protracted bull swing.
Failed breakouts and reversals are common. It is usually better not to enter on the breakout; instead, wait for strong follow-through and then enter at the market, or wait for a breakout pullback and then enter in the direction of the trend, or wait for a failed breakout and then enter in the opposite direction. Although no one knows what algorithms are being used by the quants at high-frequency trading (HFT) firms, the huge volume taking place and the small moves with lots of reversals could easily be the result of programs trying to scalp one to four ticks repeatedly. The mathematicians do not need to even look at a chart. They design programs to capitalize on small movements, and a tight trading range looks like a perfect environment for a smart programmer.
Every pullback in a tight trading range is due to a micro buy or sell vacuum, just as occurs near the top and bottom of all trading ranges. Many bulls and bears will look to buy at a certain number of ticks below the high, whereas others will look to buy at a certain number of ticks below the low of the prior bar. These are traders who want to buy, but not at the current price. The bears want to buy back their short scalps, and the bulls want to initiate buy scalps. The absence of these buyers at the current price causes the market to get sucked down. Once it reaches their price, they suddenly buy aggressively, causing the reversal up. The bears take profits on their shorts and the bulls initiate longs. Once the market gets near the top of the range, the process reverses. The bulls sell out of their long scalps as they take profits, and the bears initiate new shorts. This same process occurs in every type of channel, whether it is horizontal (like a tight trading range) or sloped (like a channel after a spike).
The math is against a trader entering and exiting on stops in a tight trading range, but determining when the trader's equation is favorable for a limit order entry is too difficult for most traders. The best choice for most traders is simply to wait for the breakout and then decide if it is likely to succeed or fail, and then to look for trades. This is the same for a tight channel, which is just a sloping tight trading range. Although the market spends most of its time in channels, whether they are sideways trading ranges or sloping channels, trading within a channel is especially difficult when the channel is tight. When a channel or trading range is tight, only the most consistently profitable traders should trade, and these traders will enter using limit orders. Most traders should enter almost exclusively on stops. Since that is exactly the opposite way to trade tight channels, most traders should not trade them. Instead, they should simply wait for a spike or for a broader channel before trading again.
A tight trading range is usually a continuation pattern, but if it forms after a climactic reversal, even a small one, the market has an equal probability of breaking out in either direction. This is because the climactic reversal has generated momentum in the opposite direction and you will not know whether this opposite momentum will continue and lead to a breakout or the momentum of the prior trend will resume. Absent a climactic reversal, if a tight trading range forms after a trend leg, the probability that the breakout will be in the direction of the trend can be as high as 55 percent if the trend was strong. However, it is probably never higher than that, or else the market would not have formed the tight trading range. If the trend was less strong, the probability might be only 53 percent. Even if the market breaks out against the trend, the pattern usually evolves into a larger trading range, and the odds still ultimately favor a with-trend breakout. Remember, all trading ranges are just pullbacks on higher time frame charts. However, if a trader enters in the direction of the trend during a tight trading range and uses a very wide stop, allowing for the evolution into a taller trading range, the trader's equation becomes difficult to determine. The risk, reward, and probability become hard to assess, and whenever that is the case, it is better not to trade. Therefore, using a wide stop and holding for a long time is usually not a good strategy. If a trader enters with the trend in a tight trading range, expecting the trend to resume, but the market breaks out in the wrong direction, it is usually better to exit and wait for a larger trading range to develop before trying again to take a with-trend swing trade.
Because a tight trading range is a trading range, the chance of the market selling off when it is near the top of the range or rallying when it is near the bottom of the range is 60 percent or higher. However, because the range is tight, there is usually not enough room to make a profitable trade and, therefore, this probability is meaningless. It is better to just assume that the probability of the breakout being to the upside is 51 to 55 percent if the range followed a bull leg, and that the probability of the breakout being to the downside is 51 to 55 percent if the range followed a bear leg.
A tight trading range trumps everything, and that especially means all of the great reasons for taking any trade. It does not matter what else you see on the chart. Once the market enters a tight trading range, the market is telling you that it has lost its direction and that the probability of the breakout in either direction is never more than about 55 percent. Since it is still a trading range, there is a slightly greater chance that the trend that preceded it will resume, but traders should assume that the odds are still only between 51 and 55 percent, depending on how strong the prior trend was and whether there was a strong reversal prior to the tight trading range. A tight trading range is made of lots of reversals, and each comes from a failed breakout attempt. There will be many “great” buy and sell signal bars, and some will have strong supporting logic. For example, if there is a great short signal that triggers, but the market forms an even better bull reversal bar within a bar or two, the bulls might think that the bears were trapped by a strong signal and will therefore be unwilling to short again for at least a couple of bars. This means that there are fewer bears near-term and the market has a high probability of having a successful bull breakout that runs for several bars. The logic is sound, but you need to go back to the mantra, “A tight trading range trumps everything.” This includes every wonderful, logical reason you have for taking a trade. The reversals show that the institutions are selling on limit orders above bars and buying on limit orders below bars. Your job is to follow what they are doing, and you should never do the opposite. Entering and exiting on stops in a tight trading range is a losing strategy. Since you cannot profitably scalp for one to three ticks in a tight trading range the way the high frequency trading firms are doing, you have to wait. They create most of the volume in these tight ranges, and they are trading in ways that you cannot trade profitably. You have to wait, which can be extremely difficult to do. Sometimes a tight trading range can extend to 20 or more bars, and it then truly becomes a setup with no predictive value. Since guessing is never a sensible approach to trading, price action traders have to wait for the breakout before deciding what to do. In the majority of cases, there is a failure within a bar or two of the breakout, and the odds of a profitable trade are higher if you base your entry on the failure rather than on the breakout. In most cases, the reversal attempt fails and becomes a breakout pullback. Once there is a pullback from the breakout, enter in the direction of the breakout on a stop as the breakout resumes. In a bull breakout, wait for the pullback bar to close and then enter on a buy stop at one tick above its high. If the expected pullback bar instead leads to a reversal and plunges through the opposite side of the tight trading range, or if one of the next couple of bars falls through the bottom of the range, you can enter short on a stop at one tick below the tight trading range, or you can wait for a breakout pullback to short.
Because the move after the breakout from a protracted tight trading range on a trading range day is often not strong, the market frequently remains largely trendless for the rest of the day. However, the market behaves very differently if there was a strong trend leading up to the tight trading range, because the day will often become a trend resumption day. Here, there is a strong trend for the first hour or so and then a tight trading range that can last for several hours, and finally a breakout from the range in the direction of the original trend. This breakout often leads to a second trend that will be about the same number of points as the first leg. Less often, the breakout will be in the opposite direction and reverse most or all of the earlier trend.
Tight trading ranges usually have setups in both directions within them, but most traders should not take any trades once they believe that the market has entered a tight trading range. If they just entered a position and the pattern grows into a tight trading range, the best option is to try to get out at breakeven or maybe with a tick loss, and then wait for the breakout before deciding on your next trade. For example, if traders shorted because they thought there was a 60 percent chance that the market would fall 10 ticks before rallying 10 ticks but now the market is in a tight trading range, the math has changed. The traders now have only about a 50 percent chance of success, and as long as their risk and potential reward are unchanged, they now have a losing strategy. Their best recourse is to exit at breakeven and, if they are lucky, they might be able to get out with a tick or two of profit.
No matter what patterns you see, and there are always great-looking ones as they are setting up, you have to factor in the probability, which is 50 percent for an equidistant move. You can trade profitably only if the chance of winning times the potential reward is significantly greater than the chance of losing times the risk, but since a tight trading range is such a strong magnet, the moves are small within it, breakouts usually fail, and even when a breakout succeeds, it usually does not go far before the range sucks the market back into it. This makes the chance of making two or three times your risk very small; therefore, any breakout strategy, like buying above a bar or shorting below a bar, will lose over time.
Since a tight trading range is a channel, it can be traded like any other channel, but because the moves are small and take many bars to reach a profit target, it is very tedious, and most traders should avoid any trading once they believe that the market has entered a tight trading range. Sometimes a tight trading range has enough points from top to bottom to short a small bear reversal bar at the top for a scalp or to buy above a small bull trend bar at the bottom. Aggressive traders are buying below the low of the prior bar or shorting above the high of the prior bar, and are scalping out with a small profit. If there was a trend leading up to the tight trading range, the with-trend trades are more likely to be winners and a part can be held for a swing. For example, if the market enters a tight trading range after a strong rally and the range is holding just above the moving average, bulls will be buying below the lows of the prior bars. Although they can scalp out near the top of the range, they can also hold a part of their position for a swing up. Other traders (mostly HFT firms) scale into longs below the middle of the range and every one or two ticks lower. Shorts sell above the middle of the range and every tick or two higher. Both take profits around the middle of the range, exiting at breakeven on their earliest entry and with a profit on their later entries.
Since traders should focus on only the very best setups, they should always avoid the worst; and a tight trading range is the worst. Tight trading ranges are the single biggest problem for beginning traders and by far the most important obstacle that prevents them from trading profitably. For example, new traders remember that bar counts have been very reliable during the trends of the past few days so they start using them for entries within the range, expecting a breakout soon, but one never comes. They see every reversal as a new signal, and each one looks good at the time they place their order. There might be a strong bear reversal bar breaking out of a good-looking low 2 short setup. But it is still within the tight trading range and follows 14 bars that overlap, and the moving average is flat. Within the range, there might have been six prior reversals and none moved far enough to make even a scalper's profit. After an hour or so, the traders become depressed because they see that they have just lost on six consecutive trades. Even though the losses were small, they are now down seven points and there is only an hour remaining in the day. In a couple of hours, they gave back everything that they had earned over the past three days, and they promise themselves that they will never make that mistake again. Invariably, though, they do it again in two days, and then at least a couple of times a week for months until there is too little margin left in their accounts to trade.
That original money in their accounts was a gift to themselves. They were giving themselves an opportunity to see if they could create a new, wonderful life for themselves and their families. However, they repeatedly allowed themselves to break the most important rule in trading by trading within a tight trading range. They were arrogant to believe that their ability to read the market was strong. After all, they had made money for three consecutive days, and they had to be skillful to accomplish that. They believed that a winner was overdue after six consecutive losers, so the law of averages was on their side. Instead, they should have accepted the reality that a winner is never overdue, and the market usually continues to do what it just did. That means a seventh loser is more likely than a winner, and there will not likely be very good trading for the rest of the day. Yes, they traded those big swings of the past few days extremely well, but the character of the market changes from day to day, and that requires you to change your approach.
Traders often do not accept that the market has entered a tight trading range until they lose on two or three signals within four or five bars, and even once they do, they make even more costly mistakes. There is a natural tendency to assume that nothing can last forever and that every behavior regresses toward a mean. If the market has three or four losing trades, surely the odds favor that the next one will be a winner. It's just like flipping a coin, isn't it? Unfortunately, that is not how markets behave. When a market is trending, most attempts to reverse fail. When it is in a trading range, most attempts to break out fail. This is the opposite of coin flips, where the odds are always 50–50. In trading, the odds are more like 70 percent or better that what just happened will continue to happen again and again. Because of the coin flip logic, most traders at some point begin to consider game theory.
The first idea that they consider is a martingale approach where they double or triple the size of their next trade after each loss. If they try it, they soon see that the martingale approach is really the martingale paradox. If you start with one contract and then after a loss you trade two contracts, and you keep doubling your position size after each consecutive losing trade, you know that eventually you will win. Once you do, that large final bet will recover all of your earlier losses and bring you back to breakeven. Better yet, triple the size of your trade after each loser so that once you finally win, you will end up with a net profit, despite your earlier losses. Martingale approaches are mathematically sound but paradoxically impossible to apply. Why is that? If you start with one contract and double after six consecutive losses, you would then be trading 32 contracts. If you trade every reversal, you will have six consecutive losers at least once a week and often more than six. The paradox is that a trader who is comfortable trading one contract would never trade 32 contracts, and a trader who is comfortable trading 32 contracts would never start with one.
Traders next consider waiting for three (or even more) consecutive losers before taking a trade because they believe that a string of four consecutive losing scalps does not happen too often. In fact, it happens almost every day, and the market often has six or even more consecutive reversals that fail; when that happens, the market is always in a tight trading range. Once they discover just how common six or seven consecutive losers are, they abandon that approach.
Once you see that the market is in a tight trading range, don't trade. Instead, simply wait for good swings to return, and they will, usually by the next day. Your job is not to place trades. It has to be to make money, and you cannot make money every month if you continue to lose more than you make. If the market appears to be swinging up and down and you take a trade, but the market then begins to form small, overlapping dojis within the next few bars, assume that the market is entering a tight trading range, especially if it is now the middle third of the day. Try to get out at breakeven or with a small loss and just wait for swings to return, even if you have to wait until tomorrow. You cannot afford to give back money based on the assumption that losers are part of trading. You must restrict your trading to the very best setups, even if that means that you don't trade for hours at a time.
An alternative to trying to get out at breakeven is to hold but use a wide stop beyond the range, but this is a less sound approach mathematically. The worst alternative is to take several entries within the pattern and sustain losses, even small ones. If you bought in a tight trading range in a bear trend and the market formed a low 2, you should exit and possibly reverse to short. If you shorted in that bear tight trading range and the market then formed a high 2, you should exit and possibly reverse to long, but only if the signal bar is a bull bar at the bottom of the range and there is enough room to the top of the pattern for a scalper's profit. However, this is rarely a good trade and only very experienced traders should attempt it. It is very difficult to watch the market for a couple of hours and not take a trade, but that is far better than incurring three or four losses and running out of time in the day to get back to breakeven. Be patient. Good setups will return before long.
An important type of tight trading range usually occurs in the middle of the day, in the middle of the day's range, and usually near the moving average, but it can occur at any time and in any location. It is called barbwire because of the spiky appearance of the large dojis and tails. If you see three or more bars that largely overlap and one or more of them has a tiny body (doji), this is barbwire. As a guide for how much overlap is enough, look at the second of the three bars. Usually the bars are relatively large, which signifies more emotion and more uncertainty. If more than half of its height is within the range of the bars before and after it, you should view the three bars as barbwire. Until you are a strong trader, don't touch barbwire or you will be hurt. The small body indicates that the market moved away from the bar's open, but traders with an opposite opinion moved it back by the close of the bar. Also, sideways bars where one bar overlaps much of the prior bar mean that no one is in control of the market, so you should not bet on the direction.
As with all trading ranges, the odds favor a with-trend breakout, but barbwire is notorious for sharp whipsaws and repeated losses for overly eager breakout traders. Barbwire often has both a failed low 2 and a failed high 2 before there is a successful breakout. In general, when barbwire forms adjacent to the moving average, it will usually break out in the direction away from the moving average. So if it forms just above the moving average, the odds favor a bull breakout, and if it forms just below the moving average, there will usually be a bear breakout. In the less common situation where it is straddling the moving average, you have to look to other aspects of price action to find tradable setups. Since all tight trading ranges are areas of agreement between the bulls and the bears, most breakouts fail. In fact, when a tight trading range occurs in a trend, it often becomes the final flag in the trend, and the breakout often reverses back into the tight trading range. The reversal usually leads to at least a two-legged pullback and sometimes even a trend reversal.
It is important to consider the move just prior its formation. If the barbwire develops in a pullback to the moving average but stays mostly on the with-trend side of the moving average, it is just part of the pullback and there will usually be a with-trend breakout. For example, if there is a 10-bar pullback to the moving average in a bull trend and then barbwire forms, with several bars poking through the moving average, but the pattern is mostly above the moving average, look for a bull breakout. Even though you might want to consider the 10-bar move down to the moving average as a new bear trend, if the pattern is mostly above the moving average, the bulls are in control and it is likely just the end of a bull pullback to the moving average.
However, if the pullback goes through the moving average and then the barbwire forms mostly on the opposite side of the moving average, this pullback has enough strength so that either a second leg is likely or you misread the chart and the trend might have already reversed. In either case, the breakout will likely be in the direction of the move that led to the pattern, rather than in the direction of the larger move that was in effect prior to this moving average pullback. For example, if there was a bear trend and now there is a 10-bar rally that poked above the moving average and is forming barbwire that is mostly above the moving average, the odds favor a bull breakout. The barbwire is a bull flag in the move up and not the end of a bear flag in the larger move down.
As difficult as barbwire can be to trade, if you analyze the bars carefully, experienced traders can trade it effectively. This is important because it is sometimes followed by a protracted trend move, especially when it is acting as a breakout pullback. For example, suppose the market is selling off to the bottom of a trading range and barbwire forms; if a low 2 develops just below the moving average and the signal bar is a strong bear reversal bar, this can be a strong short setup. The odds favor a successful breakout if the tails within the barbwire are not too prominent, there was a strong reversal at the top of this bear leg, and there are reasonable targets well below the barbwire.
Sometimes barbwire forms at the end of a several-bar spike in the first hour. When it happens in an area of support in a bull trend, it can become a reversal pattern and the low of the day. When this happens after a bull spike in the first hour at an area of resistance, it can become the high of the day. Barbwire less often forms reversal patterns later in the day.
The cardinal rule for trading in barbwire is to never enter on a breakout. Instead, wait for a trend bar to break out of the pattern. The trend bar is the first sign of conviction but, since the market has been two-sided, the odds are high that the breakout will fail, so be ready to fade it. For example, if there is a bull trend bar that breaks out to the upside by more than a couple of ticks, as soon as the bull trend bar closes, place an order to go short at one tick below the low of that breakout bar. Sometimes this short entry will fail, so once short and once the entry bar closes, place an order to reverse to long at one tick above the high of the short entry bar, which would become a breakout pullback buy entry. It is unusual for the second entry to fail. Do not fade the breakout if it has two or more consecutive trend bars, because that increases the odds that the breakout will be successful. This means that any attempt to reverse back into the barbwire will probably fail and set up a breakout pullback. Once the market begins to form trend bars, either the bulls or the bears will soon be in control. When a with-trend breakout fails within a few bars and the market reverses, the barbwire is then the final flag of the prior trend.
You can also fade small bars near the top and bottom of barbwire if there is an entry. For example, if there is a small bar near the high, especially if it is a bear reversal bar, look to scalp a short with an entry order to sell at one tick below the low of that bar on a stop. You can also look for 3 minute small bars to fade as well. You should rarely, if ever, fade off 1 minute bars, because the 3 and 5 minute bars provide better winning percentages.
Since barbwire can have many spikes before there is a successful breakout, experienced traders sometimes place limit orders to buy below the low of the prior bar if that low is near the bottom of the range but not if it is in the middle or top of the range. Bears will short above the high of the prior bar with an entry near the top of the range, rather than at the high of a prior bar where the high is in the bottom half of the range. The more prominent the spikes are, the more likely this is to work. Also, it is more effective if the bars are at least as large as the average bars of the day. If the bars are too small and the range is too tight, then the odds of a successful scalp are less, and traders should wait to place trades. This is tedious work, and most experienced traders usually wait for moves with a higher probability of success and more profit potential. Since the volume is often good within barbwire, high-frequency trading firms are likely active, as they are in all tight trading ranges, scalping for one to three ticks. Computers do not get tired, so tedium is not an issue for them.
If barbwire is at the end of a pullback to the moving average in a strong trend, you need to take the second entry in the direction of that strong trend. For example, if there is a pullback to the moving average in a bull trend, you would buy a high 2 even if it is forming within barbwire. This is especially true if the signal bar is a bull reversal bar and if dojis and tails are not too prominent in the barbwire. You must look at the entire chart and see the bull trend. Do not simply look at the prior 10 bars and conclude that the market is now in a bear swing, which is not realistic if the market is holding above a rising moving average in a strong bull trend.
Whenever you are not certain, the best course is always to wait, which is difficult to do when you feel like an entry is overdue. However, that is what a smart trader always does because it simply does not make sense to trade low-probability setups. One very good rule is that if there is a trading range setting up and it is near the moving average, never look to buy if the bars are mostly below the moving average, and never look to sell if the bars are mostly above the moving average. This one rule will save you an enormous amount of money over the years.
Micro channels sometimes have barbwire behavior. For example, on a bear trend day, it is common to see a small rally within a micro channel. Then there might be a downside breakout that fails within a bar or two. This is not a buy setup since it almost always will be below a falling moving average on a bear trend day and you need to be looking for short setups only when the market rallies for five to 10 bars. Wait for the failed breakout to form a higher high or a lower high breakout pullback and then look to go short below that bar. You will be shorting exactly where the trapped bulls who bought above the bar that broke below the bull channel will be taking their losses. These patterns often have tails and can be barbwire, and they trap countertrend traders, just like barbwire.
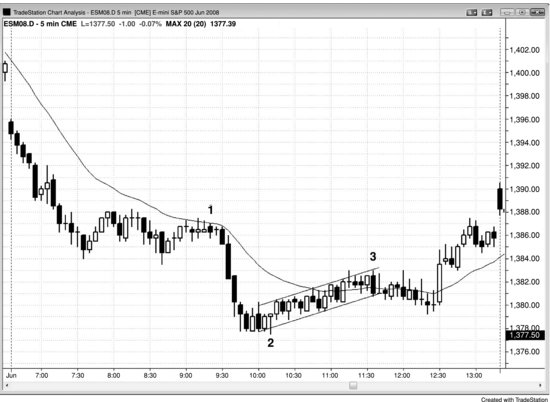
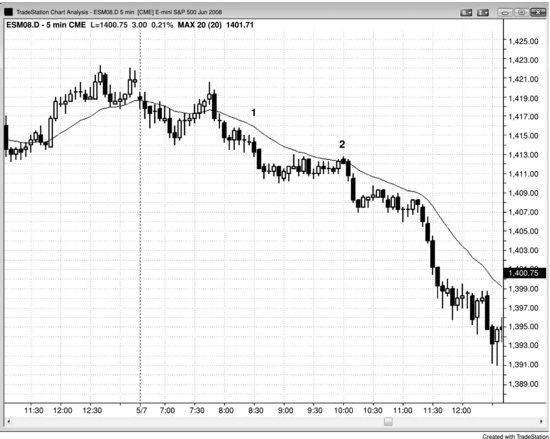
Figure 22.1 Tight Trading Range
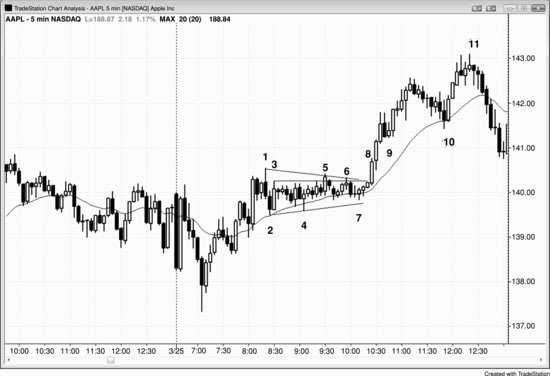
By bar 4 in Figure 22.1, it was clear that the market had entered a tight trading range. Bar 1 was the second attempt to reverse down within three bars and was followed by the bar 2 attempt to reverse up in a two-bar reversal. Three changes in direction within five bars are a strong sign that the market was now strongly two-sided. When the market formed a small doji after bar 3, traders had to suspect that it was likely entering a tight trading range. When the next two bars were also dojis, a tight trading range was in effect.
Both bars 5 and 6 failed to break out of the top, and the tight trading range evolved into a triangle, which is also usually a with-trend pattern. Since the last trend was up from the low of the day, an upside breakout was likely, especially since all of the bars were holding above the moving average. After two failed breakouts, the odds were much higher that a third breakout would succeed. Also, bar 7 was a high 2 pullback from the bar 5 high, which had some momentum. An aggressive trader would have bought the high 2.
The next logical buy was a breakout above the high 2 of bar 5, the first failed breakout. You could also have bought at one or two cents above the high of the day. In general, buying a tight trading range breakout is a low-probability trade. However, the trading range followed a strong bull reversal off the low of the day, and the market could not close more than a tick below the moving average for two hours, which indicated that the bulls were very strong.
The highest-probability entry was the first pullback at bar 9, which reversed up after taking out the bear reversal bar's low by only one tick, trapping shorts in and longs out.
Another high-probability buy was the high 2 at the moving average at bar 10. The entry was above bar 10, the second bar of the two-bar reversal. There was a breakout of the bear micro channel two bars earlier, so bar 10 was also a lower low breakout pullback buy setup. High-probability trades often result in smaller gains, but by definition they usually have a much higher chance of success.
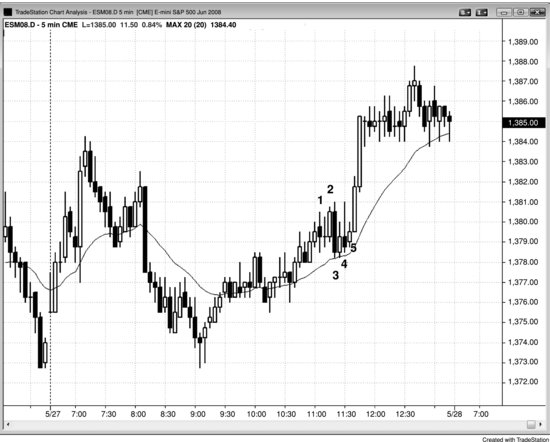
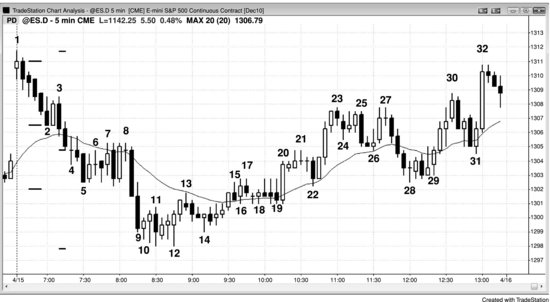
Figure 22.2 Tight Trading Range in Both Bull and Bear Legs
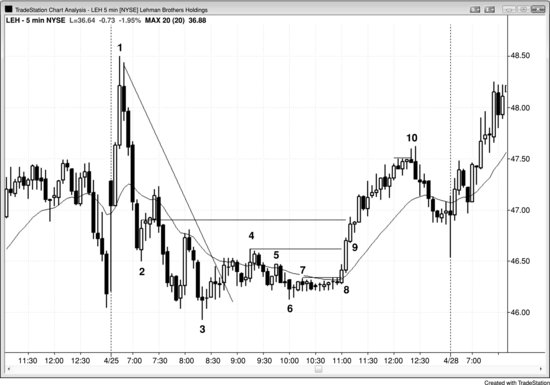
Sometimes a tight trading range can be a pullback in both a bull trend and a bear trend. In Figure 22.2, was the tight trading range from bar 6 to bar 8 a bull flag in the rally up from bar 3 to bar 4, or was it a bear flag in the bear trend down to bar 3? Both are logical possibilities, and whenever there is both a valid bull and bear interpretation, there is uncertainty, which means that the market is in a trading range and in breakout mode.
After breaking the bear trend line on the rally to bar 4, Lehman Brothers (LEH) formed a higher low at bar 6 and then entered a tight trading range. Since the move down to bar 3 was a wedge, it was likely to be followed by at least a two-legged sideways to up correction, especially after the reversal up from yesterday's low. Even though trading range breakouts usually fail, an upside breakout here could have had a second leg up that might have been as large as the leg from bar 3 to bar 4. It could even have been a trend reversal, especially since there was so much earlier bull strength on the move up to bar 1. Upside targets included the bar 4 final lower high, the swing highs after bar 2 and bar 3, a measured move up where the second leg was as tall as the first, and even a test of the bar 1 bull spike.
The move up to bar 4 was contained fairly well in a channel and was therefore probably just the first of the two sideways to up legs. It also had bull bodies that were more prominent than the bear bodies, which was a sign of buying pressure. Bar 6 formed a double bottom with the third bar after the bar 3 low. Traders knew that if the bar 6 low was to hold, the market could have made a measured move up above bar 4 that equaled the height of the bar 6 low to the bar 4 high. Aggressive bulls were buying in the tight trading range because of the great risk/reward ratio. They were risking about 20 cents to below the bar 6 low to make a dollar or more on a 50–50 bet, which was a great trade.
The market became clearly always-in long by the close of bar 8, and even more certain when the next bar was a strong bull trend bar. Bulls were buying at the market, on tiny pullbacks, above prior swing highs, and on the closes of each of the three bars in the bull spike. There was now about a 60 to 70 percent chance of approximately a measured move up from the open of the first bar of the three-bar spike to the close of the third bar, and the market ultimately rallied beyond that target.
The first pullback after the breakout was the small bull inside bar at bar 9, so buying the high 1 at one tick above the high of bar 9 was a high-probability long.
The rally to bar 10 was about a 65 percent retracement of the bear trend down from bar 1. Fibonacci traders would call the rally to bar 10 a 61.8 percent pullback and say that it was close enough, but every pullback is close enough to some Fibonacci number, making the Fibonacci numbers essentially meaningless most of the time.
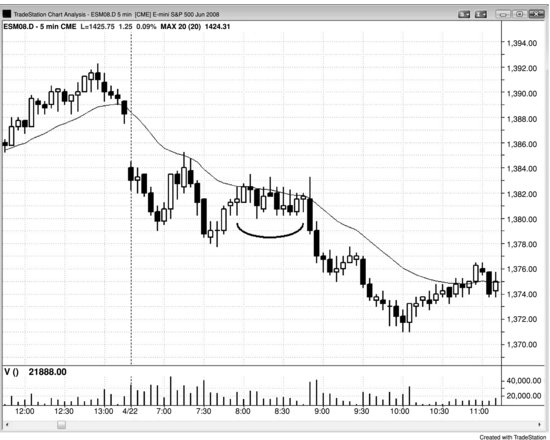
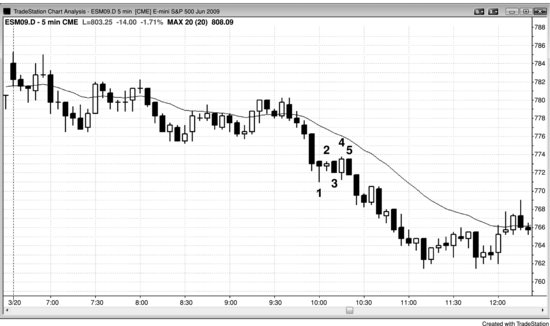
Figure 22.3 Tight Trading Range Evolving into Larger Trading Range
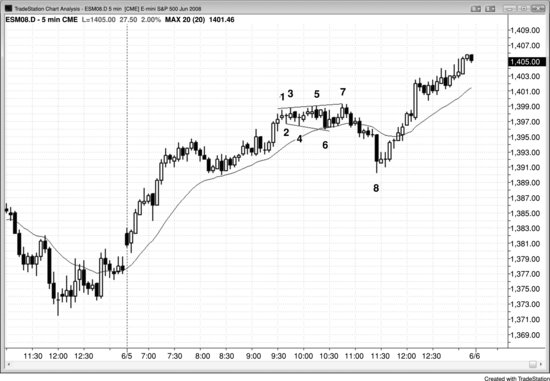
Although a tight trading range in a bull trend is a trading range and therefore a bull flag, it breaks to the downside first in about 45 to 49 percent of cases. The pattern then sometimes evolves into a larger trading range, which usually breaks out in the direction of the trend (in Figure 22.3, up). Most traders who bought in the tight trading range after bar 1 should have exited either on the breakout below bar 5 or below the bear inside bar after bar 7, and almost all would have exited on the downside breakout below bar 6. The alternative was to hold long and use a wide stop. However, even though the market did not fall below the 8:25 a.m. PST swing low from three hours earlier, a trader would have had to risk seven or more points to stay long. Most bulls who bought in the tight trading range would have instead taken a loss before the bar 8 low formed. At the time of their entry, the required risk that would have allowed for a larger trading range was too great, and the probability of reaching a big enough profit target to make the trader's equation profitable was too low for them to hold long. When that is the case, it is better to exit and then look for another trade in either direction. The trader's equation was reasonable for traders who took a small loss and bought again above the bull bar that followed the bar 8 failed bear breakout. Here, they were buying a double bottom and therefore a possible bottom in a larger trading range in a bull trend.
By bar 3, barbwire was present because of three sideways bars with at least one being a doji. This meant that most traders should wait for a breakout and assess if it looked strong or likely to fail. Aggressive, experienced traders could have bought below the low of the prior bar, shorted above the high of the prior bar, bought above small bull reversal bars at the bottom, and shorted below small bear reversal bars near the top.
Bar 6 was a bear trend bar breakout followed by an ii setup at the moving average that led to a long scalp. The market had not touched the moving average in over 20 bars. The market was getting close, and the bulls thought that a touch was likely after the market missed it by a tick a couple of hours earlier. Since the bulls believed that the market would fall to the moving average, they were unwilling to buy just above it, and their refusal to buy left the market one-sided. The result was that the market fell quickly in the form of a strong bear spike to the moving average, where the bulls reappeared and bought aggressively.
Bar 7 was a failed bull trend bar breakout following the first failed breakout to the downside, and opposite failures are second entries and therefore especially reliable. The two-bar reversal at bar 7 set up a small expanding triangle short. Bar 5 was also an expanding triangle short, but at that point the range was too tight for a scalp down.
Expanding triangles are intensely two-sided and therefore have a magnetic pull on breakouts, causing most to fail, like at bar 6 and bar 7. Even after a successful breakout, the market often gets drawn back because it is an area where both the bulls and the bears believe there is value in initiating positions. Bar 8 was a large bear trend bar that became just another failed breakout.
Deeper Discussion of This Chart
In Figure 22.3, bar 8 was a sell climax, a failed breakout, and a double bottom with the bottom of the bull channel that began around 8:15 a.m. PST, and the bar after it was a first moving average gap bar setup (it was actually the second attempt, since the first was four bars earlier).
Figure 22.4 Stop Entries in Barbwire Are Costly
The chart presented in Figure 22.4 seems innocuous enough, right? But if you look carefully at the barbwire from bar 1 to bar 2, there were eight consecutive reversals that failed to reach a scalper's profit. Once you see overlapping bars near the moving average, you need to be very careful. In general, it is best to consider only with-trend entries (here, longs, since the pattern is mostly above the exponential moving average), and only if you can buy near the bottom of the pattern or after one side is clearly trapped. Although the tails are not as big and the bodies are not as small as in most barbwire patterns, overlapping bars at the moving average create a dangerous situation.
On a 15 minute chart, this 5 minute barbwire is simply a high 2 pullback to the moving average, and it is certainly reasonable to trade off the 15 minute chart when there is a 5 minute barbwire pattern. The best approach for most traders is simply to wait and not trade until after the pattern has broken out and a new pattern sets up. In some cases, like here, there is no low-risk setup. Bar 2 was a bad short since traders were shorting below a large signal bar at the bottom of a trading range in a bull day. Also, a bear reversal bar in a tight trading range has nothing to reverse, so it does not function as a reversal bar. Here it was the first bar of a two-bar reversal up. The outside up bar was the second and the entry was above the high of the outside up bar, which was the higher of the two bars. Just because something looks like a reversal bar does not mean that it will function like one. Also, something can function like a perfect two-bar reversal even if it does not look like one. Traders who are constantly thinking about what is going on can catch these trades. It is likely that the chart would look different on other time frames—that the bear reversal bar would not exit and the two-bar reversal would look perfect. However, you never have to look for the perfect time frame if you understand what is happening on the chart in front of you.
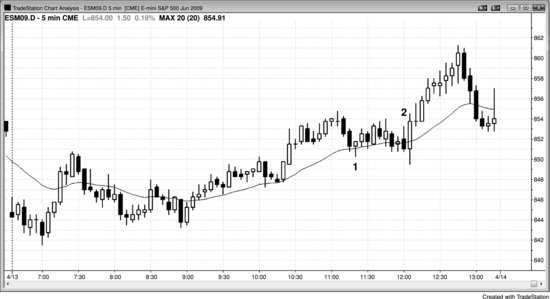
Figure 22.5 Stop Entries Would Have Yielded 10 Consecutive Losers

Ten consecutive losing scalps should be a warning to traders who think they can make money by trading in barbwire. This is an extreme example of the trouble that traders can have if they choose not to work hard to understand price action and instead decide to trade entirely mechanically, reversing at each bar that reverses the prior bar. In Figure 22.5, bar 1 was a long scalp that would have resulted in a loss. If traders reversed to short on bar 2, they would have lost again. If they kept reversing after each loss, they would have had 10 consecutive losing entries, the last occurring at the bar 10 short. If their first position size was a single contract and they used a martingale approach of doubling their position size after each loss so that when they finally won they would be back to breakeven, that 11th entry would have required them to trade 1,024 contracts, and what one-lot trader would ever be able to do that? If they took a more aggressive martingale approach and decided to triple their position size after each loss so that when they finally had a winning scalp they would have a profit despite all of the earlier consecutive losers, their second trade would be for three contracts, their third would be for nine, and their 11th entry would be for 37,179 contracts! That is why martingale techniques are not practical. If your account is big enough to trade 1,024 contracts, you would never bother trading just one contract on your first trade, and if you are comfortable starting out with just one lot, you could never trade 1,024 contracts.
On this summer Friday, there were also eight consecutive losers starting at the long at bar A and ending with the short at bar B.
Traders could instead begin trading after four or five losers and increase their odds of success and reduce their overall risk, but this should be done only rarely and only by traders who can read price action quickly and accurately. Smart traders would avoid this approach in barbwire, especially when it grows into a protracted tight trading range. Anyone blindly doubling up after consecutive losers is gambling and not trading, and gambling is entertainment, which always involves a fee. None of the 10 losing trades had a strong enough setup to be traded in barbwire, and therefore it would have been better to wait. You cannot sustain repeated losses in barbwire and hope that your winners from earlier in the day will keep you profitable. They won’t, and your account will inevitably shrink to the point that there is no longer enough margin to trade and it will become a blown account.
Once you become an experienced trader, you can consider buying below the lows of bars and below swing lows near the bottom of the range and shorting above the high of the prior bar or a swing high near the top of the range, but this is tedious and requires an intensity that most traders cannot consistently maintain.
Figure 22.6 Sloping Tight Trading Range
When a tight trading range slopes slightly up or down, it is still a tight trading range and it should be treated the same way. The bulls and bears are in close balance, and generally it is best to wait for failed breakouts and breakout pullbacks. In general, all tight trading ranges are continuation patterns, like the small one that ended at bar 1 in Figure 22.6.
The range that started at bar 2 was after two sharp bear legs and should be expected to be protracted and likely to lead to two up legs (the move to bar 3 became the first of the two legs). These patterns are difficult to trade and often have false breakouts. It is wise to trade them minimally, if at all, and simply wait for the inevitable clarity that will reappear. This was a micro channel, and the odds were high that once the breakout came, it would fail. The market broke to the downside, only to reverse back up into the close.
Deeper Discussion of This Chart
All trading ranges, especially tight ones, are magnets, and breakouts usually get pulled back into the range. When a horizontal trading range occurs after a trend has been underway for 20 or more bars, that trading range is often the final flag in the trend. The breakout often fails and the market returns to the price level within the range. Sometimes there is a trend reversal.
The two-legged pullback to the moving average that ended around bar 1 in Figure 22.6 became a final flag, and the market was drawn back up to that price area by the close.
The tight trading range that ended at bar 3 was also a final flag, and the breakout was to a higher low. The market then reversed up above the tight trading range for the second leg up after the sell climax at the low of the day.
Many traders saw the move down to bar 2 as simply a large two-legged sell-off. They also thought that the trading range that ended around bar 1 could be a final flag. After the sell climax at the low of the day, many expected two legs up and a test back into that trading range. Since the move was countertrend, they were willing to hold their long positions that they bought on the second entry above bar 2, and they did not exit during any of the times that a bar fell below the low of the prior bar. After a couple of strong bull trend bars, they began to trail their protective stops below the lows of the strong bull bars and soon were able to move their stops to around breakeven.
Figure 22.7 Barbwire with an ioi Pattern
In Figure 22.7, bar 1 was a large outside bar followed by a doji inside bar. Even though an ioi pattern is often a reliable breakout setup, here the tails on the recent bars are too prominent. When there are three sideways bars and at least one of them is a doji, no one is in control and the best approach is to wait for one side to gain control, as evidenced by a trend bar that clearly breaks out. If the breakout looks weak and sets up a reversal, then look to fade the breakout. Most trend bars coming out of these patterns fail and become setups in the opposite direction. This entry also frequently fails, which is a signal for a second trade. It is unusual for this second entry to fail. This type of bar counting is difficult for most traders to do in real time, and they are more likely to make money if they wait for clarity.
Bar 2 broke out of the ioi pattern, but buying above large overlapping bars, especially in barbwire, is usually a bull trap. In fact, an experienced trader will often place a limit order to go short at or above the high of that inside bar, expecting the bull breakout to be a trap and for the market to quickly reverse down.
So with the bulls trapped above bar 2, did it make sense to short below bar 2, since those bulls would have to sell out of their longs? You are faced with the same problem. Whenever there are three or more large bars and one of them is a signal bar forcing you to buy at the top of the tight trading range or to short at the bottom, the odds are that you will lose money because it is likely that the institutions are doing the opposite.
The bar after bar 3 was a bull inside bar and was setting up a high 2 long, where bar 2 was the high 1. The bar was not as large as the prior several bars, and you were buying above a bull trend bar that was testing the moving average, which is normally a good trade. Although this was a reasonable trade, the market was still in barbwire and it was better to wait for a second signal or a breakout pullback. Bar 5 was a bull trend bar at the moving average; it was the second entry within three bars, and it was at the same price as the first entry. All of these factors increased the odds of success. By the close of the bar, the bulls were happy to see a large bull breakout bar with no tail on the bottom and a small tail on the top, and the odds favored at least a measured move up from the open to the close of the bull spike. The entry bar was followed by another very strong bull trend bar.
Figure 22.8 Barbwire Failed Breakout
When barbwire forms in the middle of the day's range, almost invariably next to the 20-bar moving average, it is best to enter on a failed breakout. In Figure 22.8, the market broke out of the top in a high 2 and immediately reversed to break out of the bottom in a failed high 2. Traders shorted on the breakout below the tight trading range, on the close of the bar, and below its low. However, you had to be thinking about the possibility of a failed upside breakout to be able to place the sell order. Remember, that upside breakout was a strong bull trend bar at some point in the first minute or two, and that bullish strength made lots of traders think exclusively about getting long. Those traders let themselves get trapped out of the short trade. You must constantly be thinking, especially when the market is starting to move. Not only must you look for a way to get in, but you must also always think about what happens if the initial move fails and then quickly goes the other way. Otherwise, you will miss great trades, and traps are among the best.
Figure 22.9 Tight Trading Range as a Flag
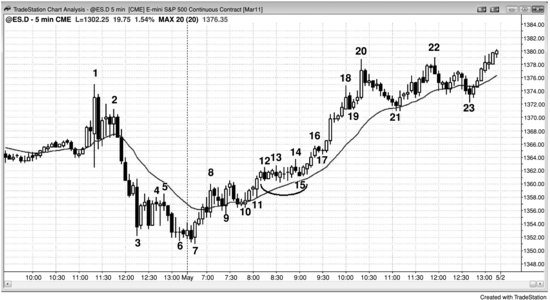
When a tight trading range forms at an extreme of the day after a breakout, it usually becomes a continuation pattern. Look for a with-trend entry, which sometimes happens after a false breakout in either direction. By bar 13 or so in Figure 22.9, most traders believed that the market was entering a tight trading range after the breakout above the top of the bar 8 bull spike. Bulls bought at and below the low of the prior bar and held some or all of their position for a likely upside breakout. Most of the bars within the tight trading range had bull bodies, and the range was holding above the moving average; both of these were signs of buying pressure and favored an upside breakout. Even though the bars were small and sideways, the volume usually remained heavy. Many of the bars had 5,000 to 10,000 contracts traded, which represented about $100 million of stock every minute.
There was a spike up to bar 8 after a lower low and then a breakout formed by six bull trend bars to a new high at bar 12. The market entered a tight trading range and broke out to the upside on bar 14, but the breakout immediately failed. However, the reversal down lasted only one bar and became a breakout pullback long setup that led to a strong bull trend. The bar 14 reversal trapped bulls out and bears in; and when both sides are trapped, the next move usually lasts for at least several bars.
Figure 22.10 Tight Trading Range Bear Flag
A tight trading range can be a reliable flag in a trend. In Figure 22.10, bar 1 was the entry from a low 2 short pattern within barbwire after a spike down to a new low of the day. It was a two-legged sideways breakout pullback. The bars were relatively large and overlapping, the tails were prominent, and there were a couple of dojis within the pattern.
The market formed a long tight trading range that ended with a two-legged sideways test of the moving average at bar 2. There was a bear reversal bar, which is always desirable when shorting a low 2 at the moving average in a bear trend. Also, the bar was small and at the top of the tight trading range, so the risk was small. Since it was an entry in a trend, the potential reward was large.
If you look carefully at the pattern, there was additional support to the trade because it was a sideways low 4, although that was not particularly important here. There was a five-bar-long, two-legged sideways correction, and then a correction down (four bars, two legs), and then a second two-legged rally (six bars, sideways to up), ending with a small break above the moving average.
Figure 22.11 Barbwire Reversal
In Figure 22.11, barbwire formed at the bottom of each of the two legs down to the bar 10 low of the day. The first one became a bear flag, and the second was a reversal.
Today opened above yesterday's high but immediately formed a strong five-bar spike down to just above the moving average. The always-in position was clearly down, meaning that the market probably would trade below the bar 2 low before it traded above the top of the bear spike. The reality is that the odds were more like 90 percent than just 51 percent, given the strong momentum and the pause just above the magnets of the moving average and yesterday's close.
The move down to bar 5 was within a tight bear channel, and therefore it was too risky to buy the first attempt to break out above the channel. This first leg down tested yesterday's close, but the momentum down was so strong that the odds were good that the market would test down further, probably to the area of yesterday's low. Even though the large overlapping bars, dojis, big tails, and two-bar reversals indicated that the bulls were beginning to buy, there was no strong buy setup within the barbwire.
Bar 8 was an expanding triangle short setup at the moving average. Expanding triangle bear flags have three pushes up and usually a low 3 signal bar, as occurred here at bar 8.
Since there is strong two-sided trading within barbwire, when barbwire forms after a sell-off it often becomes the final flag of the bear trend. The market usually works its way back into the barbwire price area because both the bulls and the bears agree that there is value in initiating trades there.
When the market fell below the value area, the bulls saw the lower prices as an even better value, and the bears saw it as representing worse value. The result was that the bulls bought aggressively and the bears stopped shorting. Well, then, why was the breakout below the barbwire created by the two strongest bear trend bars of the day? This was because once the first barbwire failed to form a bottom on the test of yesterday's close, the next level of support was yesterday's low. The bulls were very eager to buy but were waiting until they believed that the market would likely not fall any further, and they came back into the market during the barbwire that began at bar 10. This was the third consecutive sell climax of the day (the move down to bar 2 and the sell-off from bar 3 to bar 5 were the first two). After three consecutive sell climaxes, the market usually corrects sideways to up for at least 10 bars and with at least two legs. Sell climaxes are emotional and usually indicate bulls desperate to get out at any price, even at the market, during a collapse. Once there were no more weak bulls left, the remaining longs were willing to hold through even more selling, and once there were no bulls left to sell out, the market had a buy imbalance. Also, the bears became very hesitant to short further after three consecutive sell climaxes and would now short only after a significant pullback.
Bar 11 was an ioi pattern with a bull inside bar setting up an acceptable long for aggressive bulls, especially if they were willing to scale in lower. Most traders should have instead waited for a higher low before going long. The bar 14 higher low had a bull body and was a pullback from the bar 10 and bar 12 double bottom.
Deeper Discussion of This Chart
Whenever the market has large trend bars, those bars are spikes, climaxes, and breakouts. The breakout component often leads to a measured move projection where the bears will take partial or complete profits, and aggressive bulls will begin to buy. In Figure 22.11 the breakout below bar 2 occurred with a five-bar bear spike from bar 3 to bar 5. The market tested the breakout with the four bars from bar 7 to bar 8, and the space between the bar 2 low breakout point and the bar 7 breakout test was a gap, which could become a measuring gap. The move from the bar 1 high to the middle of the gap often projects to a level where the market might find support. Here, the market fell below that target. There are always many possible choices for measured move projections and many are not obvious. The move from the high of the day to the middle of the bar 4 doji within the measuring gap gave a projection that was one tick below the low of the day. Once the market fell below the first target, traders would look for other possible targets. If they found one that was logical, it would give them more confidence that the bottom for at least an hour or two was in.
The spike from the bar after bar 1 to the bottom of bar 2 could also have led to a measured move. The open of the first bar to the close of the final bar is often the height for the projection, and the low of the first barbwire pattern missed the target by a tick.
Figure 22.12 Barbwire as a Low 2
The market in Figure 22.12 was in a small range for the first three hours, so a breakout was likely. Bars 1, 2, and 3 were sideways and overlapping. Since bars 1 and 2 were dojis, this was a barbwire pattern. However, bars 3, 4, and 5 had good bodies and small tails. This meant that the market was transitioning from barbwire into an ordinary low 2 short setup in a bear trend, and it led to a two-bar bear spike and then a tight bear channel. Most bulls who were scaling in would have sold out of their longs on a low 2 short in a bear trend, especially if there was a bear signal bar. They then usually don't look to buy again for at least a couple of bars. This is why low 2 shorts are so effective in bear trends. The bulls step aside, and the bears become more aggressive.