Chapter 30
Profit Taking and Profit Targets
All pullbacks and reversals begin with profit taking. Experienced traders look to exit on strength, and then look to reenter on a pullback. For example, if a bull trend is just beginning and is especially strong, bulls will buy more as the market breaks above the most recent swing high. However, as the trend matures and develops more two-sided trading, they will no longer buy on a stop above the most recent swing high. Instead, as the rally weakens, they will look to take some profits above that high, or even a little below. If most bulls are taking profits around the previous high and not buying more on the breakout, the market will begin to have a pullback. This means that the bulls would rather buy at a lower price and they believe that there will be a pullback that will allow them to do this, so they are no longer willing to chase the market up, buying above prior highs. If the profit taking is very heavy and if there is aggressive, relentless shorting as well, the pullback will grow into a large correction (a trading range) or even a reversal. Bulls will also look to take profits on any sign of strength, like at the close and just above a large bull trend bar, or at the close of the next bar or two, especially if it is a small bar or has a bear close. They will take more profits below the low of the next bar. This is why so many large trend bars, which are breakout attempts, are followed by small bars and pullbacks, which means that the breakouts failed. Traders will also have a stop order below the low of the prior bar, below the most recent higher low, or at breakeven. This is because if the market reverses strongly before reaching their target, they might come to believe that they will be able to exit and then buy again at a better price. Bears initiating shorts see the same thing, and usually begin looking for scalps by selling at new highs or around the closes of strong bull trend bars. As the pullbacks get deeper, they will begin to swing parts of their positions. Initially, they usually get stopped out of the swing portions of their trades, but eventually they will get large swing profits as the corrections get deeper, or when the trend finally reverses.
Traders behave similarly in bear trends. Bears will short below swing lows when the trend is strong, but as it weakens, they will instead buy back their shorts around and below the most recent swing low, and look to short again higher. A bull scalper will buy new lows and scalp out on a small rally, around where the bears are shorting again. Both the bulls and the bears wait for a relatively large bear trend bar that breaks to a new low, at which point both will buy around its close. As the bear rallies get stronger, the bulls will be more willing to swing some of their positions. At some point, the market will transition into a large bull swing or trend, and the process will begin in the opposite direction. Understanding trend bars that create breakouts is one of the most important skills that a trader can acquire. Traders need to be able to assess whether a breakout is likely to succeed, whether it will be met with profit taking and a pullback, or whether it will be followed by a reversal. Each of these is discussed in detail elsewhere in the three books.
When you enter a trade, your goal is to have the market reach your profit target before it hits your protective stop. Unlike protective stops, which should always be working in the market whenever you are holding a position, profit targets can be either in the market or in your head. For example, if you are swing trading in a strong trend, you might take profits on some of your position along the way (this is scaling out of your trade) and you might choose to hold on to some of your position until there is a signal in the opposite position. Once that opposite signal triggers, you should exit. Very few traders have the ability to reverse a position by simultaneously exiting a profitable swing position and entering a new trade in the opposite direction.
Scalpers often have order cancels order or one cancels the other (OCO) orders working as soon as they enter. For example, they might buy AAPL for a 100 cent scalp and risk 50 cents when they buy a pullback where they are 60 percent or more certain that the trade will be successful. As soon as they enter, their initial order might automatically generate both a protective sell stop order at 50 cents below their entry price and a sell limit order at 100 cents above their entry price. Since this bracket order is OCO, as soon as one of the pair is filled, the other is automatically canceled. No matter how you manage your orders, you should check your account after every entry and exit to make sure that your current position and orders are what you think they should be. You don't want to be flat (have no position) and still have a buy limit order working when you thought that it should have been automatically canceled. Never assume that your broker's software will work as expected 100 percent of the time, or that you placed your trades and orders correctly. There is an inescapable failure rate with everything, and you should always confirm what you expect has been done after you believe it should have been done.
All trades should be made on the basis of the trader's equation, and beginning traders should look for trades where the probability of success is 60 percent or higher, and the reward is at least as large and preferably about twice the size of the risk, although a setup with that strong a trader's equation happens only a couple of times on an average day. For example, if the average daily range in the Euro FX Currency Futures or the foreign exchange (forex) equivalent, the EUR/USD, has lately been about 100 ticks (often referred to as pips), and there have been several 20-tick moves every day where a 10-tick protective stop would not have been hit, a trader might look to enter trends on pullbacks to the moving average, so that the probability of a winning trade is likely 60 percent or greater. The trader who carefully selects a setup has about a 60 percent chance of making 20 ticks while risking about 10 ticks, and this has an excellent trader's equation. In 10-Year U.S. Treasury Note Futures, if the average daily range has been about 32 ticks (16/32 of a point) and many signal bars have been four ticks tall, a trader could again look to enter on pullbacks to the moving average, risking about six ticks and using a profit target of eight ticks. This again has a strong trader's equation.
Trade management is different for scalps than it is for swings. A trader who is taking a scalp believes that the profit potential is limited either because there is no trend or because he is trading against the trend. Scalping in a trading range can be a profitable strategy, but only the most experienced traders should consider trading against the trend. The chances of making money are far greater if a trader can patiently wait for a pullback and enter in the direction of the trend, rather than hoping that a countertrend trade will be successful. Once you believe there is a trend, you must accept that 80 percent of reversal attempts will fail and evolve into flags. This makes it almost impossible for most traders to enter countertrend trades on stops and consistently make a profit. For example, if you think that a small bear reversal bar at the top of a strong bull trend will be followed by a pullback to the moving average, and you short on a stop at one tick below the low of the bar, you must realize that very smart bulls have limit orders to buy at the low of that bar, and the odds are on their side. If you are trading the Emini, you need the market to fall ten ticks below the low of that bar for you to make an eight-tick profit on your short, but most pullbacks in a strong bull trend will turn into high 1 or high 2 buy setups before that happens, and you will lose money. If you see that there is a strong trend and you want to buy a pullback, do not fool yourself into believing that you have enough talent to be able to profitably trade a short scalp as you wait for the buy setup to form. Invariably, you will lose money on the short scalp and not take the buy setup when it forms. You will be hoping for more down and be in denial that the pullback is about to end, and you will miss the long that might be good for several points of profit.
After the trend has turned into a trading range, then countertrend trading is really not countertrend, because the trend has temporarily ended. However, many traders try to pick the top of a bull trend or the bottom of a bear trend, believing that the market is about to enter a trading range and thinking that their risk is small, only to watch their accounts slowly melt away.
Whenever traders enter any trade, they need a plan to take profits, because otherwise the market will eventually turn on them and their profits will turn into losses. Trade management depends entirely on the trader's equation, and any combination of risk, reward, and probability that results in a consistent profit is an effective strategy. As a general rule, most traders should restrict themselves to high-probability trades where the risk is at least as great as the potential reward. Ideally, traders should look for setups where the chance of success is at least 60 percent and the potential reward is about twice the size of the risk, but usually they will have to settle for a reward that is about the same size as their risk, or maybe a little bigger. This most often happens in pullbacks in trends.
When swinging a trade in a strong trend, it is easy to take profits too early because it is so difficult to believe that the trade might run five or more times more than the size of your stop. However, when a trend is strong, that can be the case. If you believe that the trend is strong, it is reasonable to take about half of your position off after the market has gone your way for a distance equal to about twice the size of your original protective stop. For example, if your initial stop in the Emini was two points and you shorted in a strong bear trend near what you think will be the start of a big swing down, exit half of your position on a limit order at four points below your entry. At that point, trail your stop. You might take another quarter off at three times your original stop size, at six points, then let the last quarter run, and exit only if a strong buy signal develops or at the close of the day, whichever comes first. However, exiting the entire position at twice the risk is a reasonable approach if you are uncomfortable scaling out of a trade. You can always enter again on the next signal.
The trader's equation of every trade changes with every tick. If the trader's equation is still favorable but not as strong as it was, experienced traders will often either tighten their protective stops or exit with a smaller profits. If the trader's equation becomes marginal, traders should look to exit as soon as possible, with as big a profit or small a loss as they can. If it becomes negative, they should exit immediately at the market, even if that means taking a loss. One way to decide if you should exit your trade is to imagine that you are not holding a position. Then look at the market and decide if you think that it would be wise to enter at the market and use that protective stop. If you would not, then the trader's equation for your current position is weak or negative and you should exit.
Remember, a profit target is the flip side of a protective stop and is there to protect you from yourself. It forces you to take profits at a time when the trader's equation is still positive, and prevents you from holding too long and then exiting once the trade has come all of the way back to your entry price, or worse, once it has turned into a loser. Just as it is better for most traders to always use a protective stop that is actually in the market, it is also better to use a profit-taking limit order that is always in the market.
Figure 30.1 Pullbacks End at a Confluence of Support Types
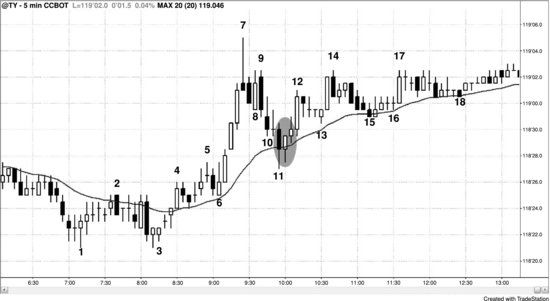
When there is a trend, entering on a pullback to the moving average is a reliable approach where the probability of success is usually at least 60 percent and the potential reward is greater than the risk. In Figure 30.1, the strong four-bar bull spike up from bar 6 was followed by a sharp pullback to the moving average, where the bull inside bar after bar 11 was a reasonable signal bar for a long. Since the bar was four ticks tall, the initial risk was six ticks. Some traders saw the setup as a high 2, and others saw it as a tight wedge, where the lows of bars 8 and 10 were the first two pushes down. Fibonacci traders saw it as a 62 percent retracement, and it was also a breakout test of the bar 4 high, missing the breakeven stops by a tick. Whenever a pullback ends, there is usually a confluence of mathematically logical reasons for the location of the bottom of the pullback. Different firms will use different reasons, but when there are many present, enough firms will buy in the area so that they overwhelm the bears and the pullback ends.
The market was likely to find resistance at the bar 9 high, which bears saw as the start of the channel down following the spike down from bar 7 to the bar 8 low. They were hoping for a double top bear flag, and many waited to short until the market tested the bar 9 high. This temporary loss of bears increased the chances that the level would be reached. The bar 9 high was exactly 10 ticks above the signal bar high, which is exactly how many ticks the bulls needed to be able to exit on a limit order with eight ticks’ profit (4/32 of a point). Everything in major markets is mathematical because so much of the trading is done by computers and they have to rely on math for their decision making.
Figure 30.2 Buying Pullbacks in a Bull Trend
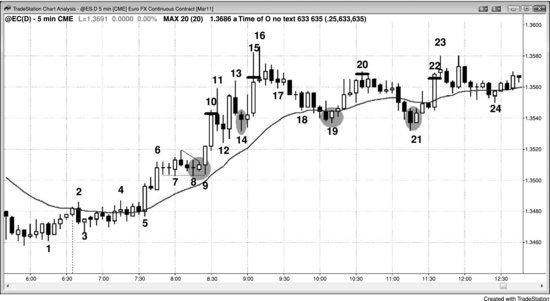
Buying pullbacks in the Euro FX Currency Futures (or the forex equivalent, the EUR/USD) is a reliable approach to trading. In the Euro, if traders carefully select their setups, they can often have a profit target that is about twice as large as their stop. Notice in Figure 30.2 how the bar 9 triangle breakout raced up without hesitation. The small bull inside bar was the buy signal and its high was just eight ticks above the low of the ledge, so the risk was 10 ticks. Since the inside bar was a buy signal, it was reasonable to buy as bar 9 went above it and became an outside bar. A trader could have had a profit-taking limit order located 20 ticks above the entry price, and would have been filled near the top of bar 10 (at the small horizontal black line).
The trader could then have bought the bar 14 double bottom (it was also a high 2 with the bar 12 high 1, and a breakout pullback from the breakout above the bar 12 small bull flag) and exited with 20 ticks of profit on bar 15, just above the bar 13 high. The bar 14 signal bar was 14 ticks tall, so the initial risk was 16 ticks. Since this was a pullback in a trend, the chance of success was assumed to be at least 60 percent.
Bar 19 was a bull reversal bar and the first pullback to the moving average in a strong bull trend. The bar was eight ticks tall, so the risk was 10 ticks and a trader could have exited just below the top of bar 20, which was exactly 22 ticks above the signal bar high. Since the limit order was 21 ticks above the signal bar high, the longs could have exited with their 20-tick profit. The market was likely in a trading range at this point, since bar 16 was a spike down (a doji top is a spike up and then a spike down, both within the same bar), and the move down to bar 19 was in a channel. The market was likely to test the top of the channel and form a double top, and the trading range was likely to grow, which it did. Because of this, it would have been better to scalp the long above bar 19. There was room for a 20-tick profit target to be filled below the top of the channel, so this was a reasonable location to exit the entire long scalp.
Traders could have bought again above the bar 21 two-bar reversal, since it was a double bottom with bar 19 and the first moving average gap bar (the first bar in the trend with a high below the moving average). The risk was 11 ticks, and traders could have exited with 20 ticks’ profit just below the bar 22 high.
If traders bought the bar 9 triangle breakout, they could have changed their plan once they saw the strength of the two-bar bull spike. Instead of exiting their entire position at 20 ticks, they could have exited half there and then maybe place a limit order to exit another quarter at another 10 or 20 ticks higher. They could then have let the remainder run until the close of the day or until there was a clear short signal. The sell climax at bar 16 was likely to lead to a pullback to the moving average, and it would have been reasonable for traders to exit below bar 16 (or below the bear inside bar two bars later), and buy again at the moving average. However, if they had been scaling out and had only a quarter of their position left, they could have also held until the close, because they would have known that buyers were likely to return at the moving average, and they might have been able to push the market to a new high before the close.
The bar 21 long was still in a trading range, but it was a double bottom bull flag with bar 19; therefore there was a reasonable chance that the market might reach a new high before the close. Although a trader could have scalped out of his entire position at 20 ticks on the correct assumption that most attempts to break out of the top of a trading range will fail, this two-legged correction had a higher chance of leading to a successful breakout, and strong bull trend days often rally to a new high at the end of the day. A trader therefore could have swung a quarter to a half of his long, just in case.