Part II
Magnets: Support and Resistance
There are two types of magnets: support and resistance. When a magnet is below the market, it is a support level, which means that it is an area where bulls will initiate positions and bears will take profits on their shorts. When a magnet is above the market, it is a resistance level, which means that it is an area where bulls will take profits on their longs and bears will initiate shorts. Support and resistance are magnets that draw the market toward them. When you become aware of a magnet not too far from the current price, trade only in the direction of the magnet until after it is reached. At that point, you will have to decide if it looks like the market will reverse, go sideways, or ignore the magnet and keep trending. Magnets tell you the likely destination, but not the path, and there may be big pullbacks along the way. Also, the market might be in a trading range for dozens of bars, but within striking distance of a magnet. Although you should be aware of the magnet, there still can be reliable trades in both directions as the market decides if it will test the magnet and how it will get there.
Traders are constantly looking at support and resistance. The market has inertia and a strong propensity to continue what it has been doing. When it is trending, most attempts to reverse the trend will fail. For example, if the market is trending down, most support levels will fail to hold or reverse the market. However, all bull reversals happen at support levels (and all bear reversals happen at resistance levels), so if the market begins to reverse up, the potential reward is often many times larger than the risk. Even though the probability of success is often only 40 percent, the trader's equation is still positive and the reversal trade is therefore mathematically sound. Inertia also means that when the market is in a trading range, most attempts to break out will fail, and the market will repeatedly reverse up from the support created by the bottom of the range, and reverse down from the resistance at the top. Even though most attempts to reverse a trend will fail, all trend reversals and all pullbacks begin at support and resistance levels, so knowing where they are can lead traders to take profits and to enter reversal trades at optimal locations.
Most Emini trading is done by computers, and their algorithms are based on logic and numbers. When they buy a falling market or sell a rally, they are doing so because they calculated that the particular price was a logical location for them to place their trades. If enough algorithms are using similar prices, the market can reverse, at least for a bar or two, and often enough for a profitable trade. Although some algorithms use numbers that are not directly based on the Emini price chart (for example, they might use data based on the options markets or other related markets), unless many programs are coming up with similar numbers, it is unlikely that there will be enough force to change the direction of the market. When the market reverses, it always does so at support and resistance levels; with practice, an individual trader can usually spot them. Because some of these reversals lead to profitable trades, and because these levels are sensible areas to take profits, it is useful to know where possible turning points are.
One of the important reasons to look for magnets is that they are logical areas to take partial or full profits. You should always be faster to take profits on a trade than you should be to look for an entry in the opposite direction. This means that you need a stronger setup to initiate a trade in the opposite direction than you need to take profits. If the move toward the magnet is weak and if it is against the direction of a larger trend, you can also look to initiate a trade in the opposite direction, expecting a reversal. The market will usually overshoot the magnet, at least by a small amount, and if the move toward the magnet is not a strong trend, the market will usually reverse, at least for a bar or two. If the trend resumes and goes even further past the magnet and then reverses a second time, this is usually a reliable setup for a trade in the opposite direction, especially if there is a strong reversal bar.
Any significant type of price action can form support or resistance, and common examples include:
- Trend lines.
- Trend channel lines.
- Any type of moving average on any time frame.
- Measured move targets.
- Prior swing highs or lows.
- Bull entry bar lows and bear entry bar highs.
- Bull signal bar highs and bear signal bar lows.
- Yesterday's high, low, open, and close.
- The high, low, open, or close of any bar, especially if the bar is a large trend bar.
- Daily pivots.
- Fibonacci retracement levels and projections.
- Any type of band.
Support and resistance are terms created by traders to describe any price as having enough of a mathematical edge for a trader to place a profitable trade. These terms were created by traders to help them spot trades. The high of every bar on every time frame is at some resistance level, the low of every bar is at support, and the close is where it is and not one tick higher or lower because computers put it there for a reason. The support and resistance may not be obvious, but since computers control everything and they use logic, everything has to make sense, even if it is often difficult to understand. Every price on the chart has some mathematical edge, but the edges are usually too small to be tradable except by high-frequency trading (HFT) programs, many of which are designed to scalp for a penny of profit. By definition, a price is support or resistance only if it has a directional probability imbalance. For example, if a market falls to a level of support, traders believe that there is about a 60 percent chance or better that there will be at least a bounce big enough for a scalp, which is every trader's minimal trade. If the chance was only 52 or 53 percent, traders would probably not consider that high enough to use the term and instead would just consider the price as unremarkable. If the market is in the middle of a trading range, the low of the prior bar is always at least a minimal area of support in the general sense of the word, but that does not mean the expected bounce is big enough to place a profitable trade. If the expected bounce is only a couple of ticks, it is not support from a trader's perspective. If the current bar is still forming and it is on its low and is one tick above the low of the prior bar, there might be a 53 percent chance of the market bouncing two ticks before it falls two ticks. However, that is too small an edge and too small a price movement for traders to place a trade (although a high-frequency program might make that trade), and therefore traders would not call it support. The opposite is true for resistance.
Support and resistance exist because the market has memory. Once the market returns to a prior price, it will tend to do the same thing that it did the last time it was there. For example, if the market falls through the bottom of a trading range and then rallies back to the bottom of the range, it will usually sell off again because that's what it did when it was last at that price level. The traders who failed to exit their longs and rode through the bear leg will be eager to get a second chance to exit them with a smaller loss, and they will hold until the market rallies back and tests the breakout. At that point, they will sell out of their longs and this will create selling pressure. Also, the shorts who took profits at the bottom of the sell-off will be eager to short again on the rally. The combined selling by the bears and the liquidating bulls will create resistance to a further rally and usually drive the market back down.
When the market falls back to a price and hits it several times and bounces each time, it is finding support at that price level. If the market rallies to a price level and keeps falling back, the area is resistance. Any area of support or resistance acts as a magnet, drawing the market to the price. As the market approaches, it enters the magnetic field, and the closer it gets, the stronger the magnetic pull is. This increases the odds of the market touching the price. That greater magnetic pull in part is generated by the vacuum effect. For example, if the market is having a bear rally toward a bear trend line but has not yet hit it, the sellers will often step aside and wait for the test. If they believe the market will touch the line, it does not make sense for them to sell just below the line when they can soon sell higher. The absence of selling creates a buy imbalance and therefore a vacuum effect that quickly sucks the market up. The result is often a bull trend bar. Then, the bull scalpers sell out of their longs for a profit and the bears sell to initiate new shorts. Since there was no clear bull reversal at the low, most of the bulls bought for scalps, expecting only a pullback and then a resumption of the bear trend.
Once the market gets to the target, traders think that the market will now more likely go down far enough to place a profitable trade, and they appear out of nowhere and short aggressively and relentlessly, driving the market down. The weak bulls who bought at the top of that strong bull trend bar are stunned that there is no follow-through, but they misunderstood the significance of the bull trend bar. They thought that traders were suddenly convinced that the market was going to break above the trend line and a bull leg would begin. They were oblivious to the vacuum effect and did not consider that the bears were just waiting for the market to get a little higher. The strong bull trend bar was due to the bears briefly stepping aside rather than the bears buying back their shorts. The bulls who kept buying needed to find bears to take the other side of their trades and they could only find them higher, where the bears thought the market would begin to reverse. The market will continue down to an area of neutrality and usually beyond to the point that the bulls now have a mathematical edge. This is because the market never knows that it has gone far enough until it goes too far. Then it trades up and down above the area of neutrality, which becomes tighter and tighter as the bulls and bears are better able to define it. At some point, both perceive that the value is wrong and the market then breaks out again and begins a new search for value.
Every countertrend spike should be considered to be a vacuum effect pullback. For example, if there is a sharp bear spike on the 5 minute chart and then the market suddenly reverses into a bull leg, there was an area of support at the low, whether or not you saw it in advance. The bulls stepped aside until the market reached a level where they believed that value was considerable, and the opportunity to buy at this great price would be brief. They came in and bought aggressively. The smart bears were aware of that magnet, and they used it as an opportunity to take profits on their shorts. The result was a market bottom on the 5 minute chart. That bottom, like all bottoms, occurred at some higher time frame support level, like a bull trend line, a moving average, or a bear trend channel line at the bottom of a large bull flag. It is important to remember that if the 5 minute reversal was strong, you would buy based on that reversal, regardless of whether you saw support there on the daily or 60 minute chart. Also, you would not buy at that low, even if you saw the higher time frame support, unless there was evidence on the 5 minute chart that it was forming a bottom. This means that you do not need to be looking at lots of different charts in search of that support level, because the reversal on the 5 minute chart tells you that it is there. If you are able to follow multiple time frames, you will see support and resistance levels before the market reaches them, and this can alert you to look for a setup on the 5 minute chart when the market reaches the magnet. However, if you simply follow the 5 minute chart carefully, it will tell you all that you need to know.
In general, if the market tests an area of support four or five times, the likelihood of breaking through that support increases and, at some point, the breakout becomes more likely than not. If the buyers who lifted the market at this level fail repeatedly to do so again, they will give up at some point and be overwhelmed by sellers. For example, if the market is resting above a flat moving average, traders will buy every touch of the moving average, expecting a rally. If instead the market continues sideways and they don't even get enough of a rally to allow for a profitable scalp, at some point they will sell their longs, thereby creating selling pressure. They will also stop buying touches of the moving average. This absence of buying will increase the probability that the market will fall through the moving average. The bulls have decided that the moving average was not enough of a discount for them to buy aggressively, and they will do so only on a further discount. If it does not find those buyers within 10 to 20 bars after falling below the moving average, the market will usually either trend down or continue in a trading range, but now below the moving average. Traders will begin shorting rallies to the moving average, which will increase the chances that the market will begin to form lower highs and that the moving average will start to trend down. Once the market falls through support, it usually becomes resistance; and once the market breaks above resistance, it usually becomes support.
This can also happen with a trend line or a trend channel line. For example, if a bull market pulls back to a trend line four or more times and it does not rally far above the trend line, at some point the bulls will stop buying tests of the trend line and they will begin to sell their longs, creating selling pressure. This is added to the selling of the bears, and since the bulls have stopped buying, the market will fall through the trend line. Sometimes, however, the market will instead suddenly accelerate to the upside and the bears will stop shorting every small bounce and instead will buy back their shorts, driving the market higher.
Institutional trading is done by discretionary traders and computers, and computer program trading has become increasingly important. Institutions base their trading on fundamental or technical information, or a combination of both, and both types of trading are done by traders and by computers. In general, most of the discretionary traders base their decisions primarily on fundamental information, and most of the computer trades are based on technical data. Since the majority of the volume is now traded by HFT firms, and most of the trades are based on price action and other technical data, most of the program trading is technically based. In the late twentieth century, a single institution running a large program could move the market, and the program would create a micro channel, which traders saw as a sign that a program was running. Now, most days have a dozen or so micro channels in the Emini, and many have over 100,000 contracts traded. With the Emini currently around 1200, that corresponds to $6 billion, and is larger than a single institution would trade for a single small trade. This means that a single institution cannot move the market very far or for very long, and that all movement on the chart is caused by many institutions trading in the same direction at the same time. Also, HFT computers analyze every tick and are constantly placing trades all day long. When they detect a program, many will scalp in the direction of the program, and they will often account for most of the volume while the micro channel (program) is progressing.
The institutions that are trading largely on technical information cannot move the market in one direction forever because at some point the market will appear as offering value to the institutions trading on fundamentals. If the technical institutions run the price up too high, fundamental institutions and other technical institutions will see the market as being at a great price to sell out of longs and to initiate shorts, and they will overwhelm the bullish technical trading and drive the market down. When the technical trading creates a bear trend, the market at some point will be clearly cheap in the eyes of fundamental and other technical institutions. The buyers will come in and overwhelm the technical institutions responsible for the selloff and reverse the market up.
Trend reversals on all time frames always happen at support and resistance levels, because technical traders and programs look for them as areas where they should stop pressing their bets and begin to take profits, and many will also begin to trade in the opposite direction. Since they are all based on mathematics, computer algorithms, which generate 70 percent of all trading volume and 80 percent of institutional volume, know where they are. Also, institutional fundamental traders pay attention to obvious technical factors. They see major support and resistance on the chart as areas of value and will enter trades in the opposite direction when the market gets there. The programs that trade on value will usually find it around the same areas, because there is almost always significant value by any measure around major support and resistance. Most of the programs make decisions based on price, and there are no secrets. When there is an important price, they all see it, no matter what logic they use. The fundamental traders (people and machines) wait for value and commit heavily when they detect it. They want to buy when they think that the market is cheap and sell when they believe it is expensive. For example, if the market is falling, but it's getting to a price level where the institutions feel like it is getting cheap, they will appear out of nowhere and buy aggressively. This is seen most dramatically and often during opening reversals (the reversals can be up or down and are discussed in the section on trading the open in book 3). The bears will buy back their shorts to take profits and the bulls will buy to establish new longs. No one is good at knowing when the market has gone far enough, but most experienced traders and programs are usually fairly confident in their ability to know when it has gone too far.
Because the institutions are waiting to buy until the market has become clearly oversold, there is an absence of buyers in the area above a possible bottom, and the market is able to accelerate down to the area where they are confident that it is cheap. Some institutions rely on programs to determine when to buy and others are discretionary. Once enough of them buy, the market will usually turn up for at least a couple of legs and about 10 or more bars on whatever time frame chart where this is happening. While it is falling, institutions continue to short all the way down until they determine that it has reached a likely target and it is unlikely to fall any further, at which point they take profits. The more oversold the market becomes, the more of the volume is technically based, because fundamental traders and programs will not continue to short when they think that the market is cheap and should soon be bought. The relative absence of buyers as the market gets close to a major support level often leads to an acceleration of the selling into the support, usually resulting in a sell vacuum that sucks the market below the support in a climactic selloff, at which point the market reverses up sharply. Most support levels will not stop a bear trend (and most resistance levels will not stop a bull trend), but when the market finally reverses up, it will be at an obvious major support level, like a long term trend line. The bottom of the selloff and the reversal up is usually on very heavy volume. As the market is falling, it has many rallies up to resistance levels and selloffs down to support levels along the way, and each reversal takes place when enough institutions determine that it has gone too far and is offering value for a trade in the opposite direction. When enough institutions act around the same level, a major reversal takes place.
There are fundamental and technical ways to determine support (and resistance). For example, it can be estimated with calculations, like what the S&P 500 price earnings multiple should theoretically be, but these calculations are never sufficiently precise for enough institutions to agree. However, traditional areas of support and resistance are easier to see and therefore more likely to be noticed by many institutions, and they more clearly define where the market should reverse. In the crashes of both 1987 and 2008–2009, the market collapsed down to slightly below the monthly trend line and then reversed up, creating a major bottom. The market will continue up, with many tests down, until it has gone too far, which is always at a significant resistance level. Only then can the institutions be confident that there is clear value in selling out of longs and selling into shorts. The process then reverses down.
The fundamentals (the value in buying or selling) determine the overall direction, but the technicals determine the actual turning points. The market is always probing for value, which is an excess, and is always at support and resistance levels. Reports and news items at any time can alter the fundamentals (the perception of value) enough to make the market trend up or down for minutes to several days. Major reversals lasting for months are based on fundamentals and begin and end at support and resistance levels. This is true of every market and every time frame.
It is important to realize that the news will report the fundamentals as still bullish after the market has begun to turn down from a major top, and still bearish after it has turned up from a major bottom. Just because the news still sees the market as bullish or bearish does not mean that the institutions do. Trade the charts and not the news. Price is truth and the market always leads the news. In fact, the news is always the most bullish at market tops and most bearish at market bottoms. The reporters get caught up in the euphoria or despair and search for pundits who will explain why the trend is so strong and will continue much longer. They will ignore the smartest traders, and probably do not even know who they are. Those traders are interested in making money, not news, and will not seek out the reporters. When a reporter takes a cab to work and the driver tells him that he just sold all of his stocks and mortgaged his house so that he could buy gold, the reporter gets excited and can't wait to find a bullish pundit to put on the air to confirm the reporter's profound insight in the gold bull market. “Just think, the market is so strong that even my cabbie is buying gold! Everyone will therefore sell all of their other assets and buy more, and the market will have to race higher for many more months!” To me, when even the weakest traders finally enter the market, there is no one left to buy. The market needs a greater fool who is willing to buy higher so that you can sell out with a profit. When there is no one left, the market can only go one way, and it is the opposite of what the news is telling you. It is difficult to resist the endless parade of persuasive professorial pundits on television who are giving erudite arguments about how gold cannot go down and in fact will double again over the next year. However, you have to realize that they are there for their own self-aggrandizement and for entertainment. The network needs the entertainment to attract viewers and advertising dollars. If you want to know what the institutions are really doing, just look at the charts. The institutions are too big to hide and if you understand how to read charts, you will see what they are doing and where the market is heading, and it is usually unrelated to anything that you see on television.
Most major tops do not come from climaxes made of huge bars and volume, which are more common at major bottoms. More often, a top comes from a trading range, like a double top or a head and shoulders top, followed by a breakout in the form of a bear spike. However, tops can be climactic, and bottoms can be trading ranges.
The chapters on trading ranges (further on) and channels (in book 1) describe how to use support and resistance to place trades. For example, traders will buy near the bottom of a channel or other type of trading range and short near the top, and then take profits and reverse on the test of the other side of the channel or trading range.
In a strong trend, the market extends beyond most magnets. For example, in a bull trend, beginning traders will discover that the rally continues up far beyond every measured move target and trend channel line that they draw. These beginners will mistakenly be shorting at every perceived resistance level, finding their losses growing all day long. They incorrectly keep shorting tops that look great but are bad, and refuse to buy pullbacks that look bad but are great. However, once there finally is a pullback or a reversal, it will always occur at a resistance level. Even in strong trends, measured move targets often work precisely to the tick. Obviously, this is in part because computers can calculate them accurately. Computers control the market and their profit taking has to be at some calculated level, which is always at some magnet. Additionally, if a trade is minimally “good,” meaning that the strategy is profitable, the reward has to be at least as large as the risk to create a positive trader's equation. This usually results in some profit taking once the reward reaches the size of the risk, because this is the minimum level that the market has to reach to make the strategy profitable. Minor swings often end precisely at measured move projections, and many strong trends end exactly at, or within a tick, of a significant measured move target, as the price gets vacuumed to the magnet.
Figure PII.1 Dow Jones Industrial Average Monthly Chart
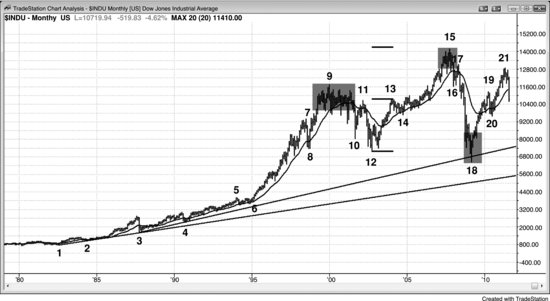
The monthly chart of the Dow Jones Industrial Average (Figure PII.1) shows several types of support and resistance (all are magnets).
Trend lines and trend channel lines are important support and resistance areas. The bar 18 bottom of the 2009 crash reversed up from below a monthly trend line drawn from the 1987 crash low to the October 1990 pullback. It also was at the trend channel line created by bars 8 and 12 (creating a dueling lines pattern, discussed in a later section). All major reversals up from bear markets occur at support and all tops occur at resistance, but most support and resistance do not stop trends. However, if there is a strong reversal pattern and it forms at a support or resistance level, institutions will take profits and many will even enter in the other direction. Market bottoms more often come from sell climaxes, like the crashes of 1987 and 2009. Market tops more often come from trading ranges, like around bars 9 and 15.
The bar 15 high was close to a measured move up based on the height of the bar 12 to bar 13 bull spike.
The moving average repeatedly acted as support, like at bars 3, 4, 6, 8, 14, and 20, and resistance, like at bars 11 and 17.
Trading ranges act as support and resistance. The breakout below the bar 9 trading range was resistance to the bar 11 rally, and the bar 15 trading range was resistance to the bar 17 rally. Once the market rallied up to bar 15, bar 16 found support at the top of the bar 9 trading range.
Swing highs and lows act as support and resistance. Bar 12 found support at the bar 8 low and formed a double bottom. Bar 13 formed a double top with bar 11, but the market went sideways and soon broke above that resistance.
Figure PII.2 Support Can Become Resistance, and Resistance Can Become Support
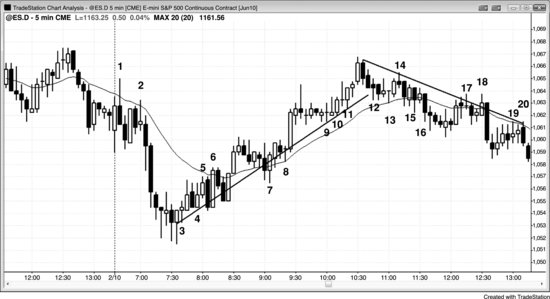
Support became resistance and resistance became support in the 5 minute Emini chart shown in Figure PII.2. This was true for both the moving average and for trend lines.
Bars 1, 2, 5, 6, 17, 18, 19, and 20 found sellers on rallies to the moving average, and bars 7, 8, 13, 15, and 16 found buyers on minor pullbacks to the moving average.
Bars 12, 13, 15, and 16 were repeated tests of the moving average, and the buyers were not getting rewarded and soon stopped buying the pullbacks. The market then fell below the moving average and the bears began to short small rallies up to the moving average, creating a series of lower highs and lows.
The bull trend line was a best fit line drawn with the objective of having as many bars as possible test it. Buyers were clearly buying in the area of the trend line, and it was tested more than a dozen times without a sharp rally away from the trend line. This lack of acceleration made the bulls more cautious over time, and eventually they became unwilling to buy in the area of the trend line. Once the market fell below the trend line, bulls became even more hesitant to buy, and began to sell out of their longs, and bears became more aggressive. Lower highs and lows formed and traders began to draw bear trend lines where they shorted rallies.
Incidentally, any upward-sloping channel should be thought of as a bear flag, even if it is part of a bull market, because eventually there will be a break below the trend line and the market will behave as if the channel was a bear flag for trading purposes. Likewise, any downward-sloping channel should be thought of as a bull flag and its eventual breakout should be traded as if a bull leg is underway.