Part III
Pullbacks: Trends Converting to Trading Ranges
Even when a chart is in a strong trend, it will have periods of two-sided trading, but as long as traders believe that the trend will resume, these are only pullbacks. These trading ranges are small enough for traders to view them as just brief pauses in the trend, rather than the dominant feature of the chart. All pullbacks are small trading ranges on the chart that you are viewing, and all trading ranges are pullbacks on higher time frame charts. However, on the chart in front of you, most attempts to break out of a trading range fail, but most attempts to break out of a pullback succeed. On higher time frame charts, the trading range is a simple pullback, and if you are trading on that chart, you can trade it like any other pullback. Since the bars are larger on a higher time frame chart, your risk is greater, and you have to reduce your position size. Most traders prefer to trade off a single time frame and not switch back and forth taking different-sized positions and using different-sized stops and profit targets depending on the time frame.
If the market is in a strong trend and everyone expects the trend to continue, why would a pullback ever happen? To understand why, consider the example of a bull trend. The reversal down into the pullback is due to profit taking by the bulls and, to a lesser extent, scalping by the bears. Bulls will take profits at some point because they know that it is the mathematically optimal thing to do. If they hold forever, the market will almost always work back down to their entry price and will eventually go far below, creating a large loss. They never know for certain where the optimum place is to take profits, and they use resistance levels as their best estimate. These levels may or may not be obvious to you, but because they offer opportunities to traders, it is important to look for them constantly. Trend scalpers and swing traders, as well as countertrend scalpers, expect the pullback and trade accordingly. When the market reaches a target where enough bulls think that they should take profits, their lack of new buying and their selling out of their longs will cause the market to pause. The target can be any resistance level (discussed in the chapters on support and resistance in Part II of this book), or a certain number of ticks above an important signal bar (like six, 10, or 18 in the Emini). The bar might have a bull body that is smaller than the bull body of the prior bar, it might have a tail on the top, or the next bar might be a small bar with a bear body. These are all signs that the bulls are less willing to buy at the top of the swing, that some bulls are taking profits, and that bears are beginning to short for scalps. If enough bulls and bears sell, the pullback will become larger and the current bar might fall below the low of the prior bar. In a strong bull spike, traders will expect that the bull trend will immediately resume, so both the bulls and bears will buy around the low of the prior bar. This creates a high 1 buy signal and is usually followed by a new high. As a bull trend matures and weakens, more two-sided trading will develop, and both the bulls and the bears will expect a pullback to fall for more ticks and last for more bars. The market might form a high 2 buy signal, a triangle, or a wedge bull flag. This creates a small downtrend, and when it reaches some mathematical target, the bulls will begin to buy again, and the bears will take profits and buy back their shorts. Neither will sell again until the market rallies far enough for the process to repeat.
Some of the buying also begins to dry up as bulls become unwilling to continue buying only one- to three-tick dips. They grow cautious and suspect that a larger pullback is imminent. Because they believe that they will be able to buy six to 10 ticks or more below the high, there is no incentive for them to buy any higher. Also, there is an incentive for them to take partial or full profits because they believe that the market will soon be lower, where they can buy again and make additional profits as the market rallies to test the most recent high. Momentum programs sense the loss of momentum and will also take profits and not enter again until momentum in either direction returns. Bears also see the weakening of the trend and begin to sell above the highs of bars and above swing highs for scalps, and they scale in higher. Once they see more selling pressure, they will also short below the lows of bars, expecting a deeper pullback.
Most bulls will exit their longs on a weaker sell signal than they would need to take short positions. They initially look to take profits on strength, like above a swing high or the high of the prior bar or on the close of a large bull trend bar. After taking profits on strength, they will then look to take profits on the remainder of their positions on weakness, and begin to sell out of their longs below bear reversal bars; they suspect that the pullbacks will become larger. Most will not join the bears in shorting, because most traders are unable to reverse a trade consistently well. They have been thinking that the market was going up, and usually need to get out of their longs for several minutes before they can convince themselves that they should take a trade in the opposite direction. If they believe that the market is only pulling back and not reversing, they will instead look to buy back their longs once they think that the pullback has ended. Since most cannot or will not reverse, they don't want to be short when they are looking to buy. If they took the short scalp, they would most likely not be able to reverse back to long, and they would find themselves trapped out of a bull swing because they tried to make a small bear scalp. It does not make mathematical sense to try to make one point on a low-probability short and end up missing two to four points on a high-probability long.
In a bull trend, there is a series of higher highs and higher lows. When the trend is strong, bulls will buy for any reason, and many will trail their protective stops. If the market makes a new high, they will raise their stops to below the most recent higher low. If enough bears short and enough bulls take profits, the reversal can be stronger than what traders initially expected. This often happens later in a trend, after several prior pullbacks were followed by new bull highs. However, both the bulls and the bears believe that the market will turn back up above the most recent swing low, and both will usually buy at or above that low. This results in either a double bottom bull flag or another higher low. The sell-off can be sharp, but as long as enough traders believe that the bull trend is intact, traders will buy and the market will test the old high, where bulls will take partial or full profits, and the bears will short again.
As the bull trend matures, traders will only look to buy a deeper correction, and they expect the market to make two-legged corrections, where the second leg falls below the low of the first. The price action tells traders when a deeper correction like this is likely, and when they believe that it is, they will no longer trail their protective stops below the most recent swing low. They will look to take profits higher, like above the most recent swing high, and then look to buy again around that low, reestablishing their longs. It does not make sense for them to rely on a stop below the most recent higher low once they believe that the market is likely to have a two-legged correction and, therefore, fall below that low. They will exit most or all of their position before that happens, but still remain bullish. The bull trend is no longer forming higher highs and higher lows. However, this lower low is usually still above the most recent higher low on a higher time frame chart, so the larger bull trend is still intact. This two-legged pullback is a large high 2 buy setup, and as the trend matures, these pullbacks get larger and have subdivisions. If the trend has truly reversed, there will be a series of lower highs and lows, but there is usually a clear reversal (reversals are discussed in book 3). In the absence of a clear reversal, a two-legged down move is just a type of bull flag and is usually followed by a new bull high. For example, the first leg down might be a small bear spike and the second leg down is a small bear channel. If the move down is strong, even if it is in a tight, complex channel and is not a bear spike, traders will expect it to be the first of at least two legs down. Bulls who bought the pullback will take profits below the trend high, and bears will begin to short aggressively below the old high, expecting a lower high and second leg down.
Once the market begins to make lower highs, the bulls will usually only look to buy deeper pullbacks, and their absence of buying helps to create those deeper pullbacks. The bears see the same price action, and transition to holding on to their shorts for larger profits, expecting the sell-offs to become larger. The market repeatedly sells off around (slightly above, at, or below) the old high, but continues to rally from around the old low. Upside and downside breakout attempts fail, and the market loses its direction, creating near-term uncertainty. This is the hallmark of a trading range. There will be repeated attempts by the bulls to resume the trend and by the bears to reverse the trend, and 80 percent of both fail. Since a trading range in a bull trend is just a bull flag on a higher time frame chart, the odds favor an upside breakout. There will always be some pattern that the bulls and bears will recognize as a sign that the bull trend is about to resume. When a credible one appears, fewer bears will be willing to scalp shorts on the rally, and the bulls will begin to continue to buy toward the top of the range. With fewer bears willing to short and fewer bulls willing to sell out of their longs, the rally will break above the trading range. If the breakout is strong, the bears who were building a swing position, expecting a larger correction or a reversal, will buy back their shorts and not look to short again for at least several more bars. With neither the scalping nor the swinging bears now shorting and the bulls not taking profits, the market usually runs for about a measured move up, equal to about the height of the trading range. Bulls will then begin to take profits and bears will again short. If the selling is strong, there will be a pullback, a trading range, or even a reversal down.
The opposite happens in a bear trend. The pullbacks are initially due to bears taking profits on new lows, but there is always some buying by aggressive bulls who think that the market will rally far enough for them to make a profitable scalp. Once the market has rallied to some resistance level, usually in a low 2 or low 3 pattern, the bulls will sell out of their longs as they take profits, and the bears will short again. The bears want the market to continue to make lower highs and lows. Whenever they see a sharp rally, they will aggressively short when it approaches the most recent lower high. They sometimes don't short heavily until the market reaches the most recent swing high, which is why double top bear flags are so common. As long as the market continues to make lower highs, they know that most traders will see the bear trend as being intact, and therefore likely to be followed by another lower low, where they can take partial or full profits on their shorts. Eventually a pullback will evolve into a trading range, and there will be some rallies above the most recent lower highs. On a higher time frame chart, there will still be lower highs and lows, but on the chart that you are trading, this higher high is a sign that the bear trend has lost some of its strength. As bear trends mature and weaken, they often form two-legged rallies where there is both a higher low and a higher high, but the bear trend is still intact. This is the basis for a low 2 short setup, which is simply a two-legged rally. There will be some pattern within the range that will tell both bulls and bears that the bear trend is likely to resume, and it will always be at a resistance level, like a measured move or a trend line. This will make bulls less willing to buy near the bottom of the range and bears more willing to continue to sell all the way to the bottom. The market then breaks to the downside, the bull scalpers stop buying, and the bull swing traders sell out of their longs. The market then falls for about a measured move, where the bears will begin to take profits and the aggressive bulls will once again begin to buy. If the buying by the bulls and the bears is strong enough, there will be a pullback, a trading range, or a trend reversal up.
The final leg of a pullback is often a micro channel against the trend (a bear micro channel at the end of a bull flag or a bull micro channel at the end of a bear flag). The breakout of a micro channel usually only goes for a bar or two before there is a pullback, especially if the micro channel has four or more bars. If the trend is strong, there is often no pullback and therefore entering on the breakout of the micro channel is a reasonable trade. When the trend is not very strong, the breakout from the micro channel usually has a failure attempt within a bar or two. As is the case with all breakouts, traders have to assess the strength of the breakout compared to the strength of the signal bar for the failed breakout. If the breakout is significantly stronger, especially if the underlying trend is strong, the reversal attempt will likely fail and lead to a breakout pullback setup that will give traders a second chance to enter in the direction of the breakout. If the breakout is relatively weak, like a small trend bar with big tails, and the reversal bar is strong, especially if the context is likely to lead to a reversal (like a bull flag just below the top of a trading range), the reversal attempt will probably succeed and traders should take the reversal entry. If the breakout and reversal are about equally strong, and there is no strong underlying trend, traders will assess the strength of the next bar. For example, if there is a bull flag in the middle of a trading range, and the bull trend bar that breaks out of the flag is followed by an equally strong bear reversal bar, and the market trades below the low of that bar, traders will evaluate the appearance of that bear entry bar. If it becomes a bull reversal bar, they will assume that the market is just forming a pullback from the breakout of the bull flag, and will buy above the high of the bar. If instead it is a strong bear trend bar, especially if it closes on its low and below the low of the bull breakout bar, traders will see the pattern as a bear breakout and look to get short, if they did not already short below the bear reversal bar.
In the strictest sense, a pullback is a bar that moves against the trend enough to take out the prior bar's extreme. In a bull trend, a pullback is a move where a bar extends at least one tick below the low of the prior bar. However, a broader definition is more useful, and any pause (including an inside bar, an opposite trend bar, or a doji bar) in a trend's momentum should be considered to be a pullback, even though there may be only sideways action and not an actual move backward. As even the strongest trend progresses, it at some point begins to give evidence of how deep a pullback will be. Most commonly, it will be an area of two-sided trading. For example, after the spike in a spike and channel bull trend, the market has a pause or pullback that creates the start of the channel. Once the trend channel ends and a sell-off (pullback) begins, it will usually test down to the bottom of the channel. That is where bears started selling, and as the bull channel goes above their short entry price, they begin to worry. They and other bears sell more as the bull trend advances, but once the trend turns down into a pullback, those bears will be very happy to exit all of their entries at their earliest and lowest short entry price, which was the start of the channel. Once they are flat, they will not look to sell in that area, because they saw how far the market rallied after their earlier short trade. However, if they are still bearish, they will short again on a rally. If the rally ends below the prior high, it will create a lower high and usually leads to a second leg down. If the bears are particularly strong, that lower high could be the start of a new bear trend and not just a second pullback in an incipient trading range.
The same is true for a wedge at the end of a trend. If a bear trend forms a downward-sloping wedge, the market will try to correct to the top of the wedge where the earliest bulls began to buy. If the market can reach their earliest entry price, then they can exit that trade at breakeven and with a profit on all of their lower entries, and they will likely not want to buy until the market falls again. They learned from their first trade that they bought at too high a price; they did not like riding through the open losses of their long positions as the market continued to fall and do not want to experience that again. This time, they will wait for a pullback and hope the market forms a higher low or even a lower low. They expect that the original low of the wedge will be support on any subsequent pullback and that buying near that level with a stop a little below that price gives them an entry with a defined and limited risk, and they like that.
The tendency of the market in a trend to test the earliest area of two-sided trading allows perceptive traders to anticipate when a pullback might form and how far it will likely extend. They won't want to enter countertrend at the first sign of two-sided trading, but that two-sided trading tells them that countertrend traders are beginning to take positions and at some point before too long the market will likely pull back to that price level. After the trend channel or wedge or stairs pattern begins to develop signs of a reversal (see the chapter on trend reversals in book 3), they will take countertrend trades and look to exit with a profit in the area where the two-sided trading began (the start of the channel).
Since a pullback is a trend, even though it is usually small compared to the larger trend from which it is pulling back, like all trends it will commonly have at least two legs. One-legged and three-legged pullbacks are also common, as are small channels and triangles, but all pullbacks are relatively brief, and traders will expect the trend to resume soon. Sometimes the legs are visible only on a smaller time frame chart, and other times they are large and each leg breaks down into smaller legs, each of which also has two legs. Because traders expect the major trend to resume soon, they will fade breakouts in a pullback. For example, if there is a strong bear trend that finally has a pullback with two legs up, there will usually be far more bears than bulls as the market breaks out above the high of the first leg up. Even though the market is breaking out above a swing high in a bull trend, the bulls buying the breakout will usually be overwhelmed by bears who will short it, because they expect the breakout to fail and for the bear trend to resume very soon. They will short on limit and market orders at and above the swing high. They see this breakout as a brief opportunity to reestablish shorts at a high price. Since 80 percent of attempts to reverse a trend will fail, the odds strongly favor the bears. This is especially true for the first two-legged pullback in a strong trend.
Any move that has two legs should be traded as if it is a pullback, even if it is with the trend. Sometimes the final leg in a trend is a two-legged, with-trend move to a higher or lower high in a bull trend or a lower or higher low in a bear trend. For example, if there is a bull trend that has a sell-off that falls through the bull trend line and this trend line breakout is followed by a two-legged pullback, that pullback simply tests the prior extreme and can even exceed the old extreme. This means that the pullback from that trend line breakout can result in either a lower high or even a higher high and still be part of a transition into a new bear trend. Strictly speaking, the bear trend does not begin until after the final high, but that final high is often just a higher high pullback from the breakout below the bull trend line.
What qualifies as two legs? You can create a line chart based on closes and often clearly see a two-legged move. If you are using bar or candle charts, the easiest two-legged move to see is one in which there is a countertrend move, then a smaller with-trend move, and then a second countertrend move (a textbook ABC pullback). So why does the move often reverse after the second leg? Look at a two-legged pullback in a bull trend as an example. Bulls will buy the new low (the C leg), thinking that the second leg down will be the end of the trend. Also, short scalpers who were looking for a two-legged correction will be buying back their shorts. Finally, aggressive bulls who bought the low of the first leg down (the A leg) will now be adding to their long positions on the move to a lower low. If all of these buyers overwhelm the new bears who shorted on the breakout below the first leg down, a rally will ensue and it will usually test the old high at a minimum.
However, oftentimes the two legs are clearly visible only on a smaller time frame chart and have to be inferred on the chart that you are viewing. Since it is easier to use a single chart for trading than to be checking multiple charts all day long, traders have an advantage if they can see the two legs on the chart in front of them, if only by inference.
In a bull market, when there is a series of bull trend bars, a bear trend bar can be assumed to be the first leg of a pullback (the A leg) even if the low of the bar is above the low of the prior bar. If you examined a smaller time frame chart, a countertrend leg would likely be evident. If the next bar has a with-trend close but a high below that of the bar that ended the bull swing, then this is the B leg. If there is then a bear bar or a bar with a low below the low of the prior bar, this will create the second leg down (the C leg).
The more that has to be inferred, the less reliable is the pattern, since fewer traders will see it or have confidence in it. Traders will likely commit less capital and be quicker to exit.
There is an obvious point here. If the trend that is now pulling back ended in a climax or any significant trend reversal pattern, the trend has changed and you should not be looking to enter pullbacks in the old trend. It is over, at least for maybe 10 bars or so and maybe for the rest of the day. So after a strong rally, if there is a wedge top or a lower low after a break of the bull trend line, you should now be looking for setups to short and not pullbacks in the old bull trend to buy. When it is not clear that there was a probable trend reversal, setups in both directions are likely to work, at least for scalps. The more likely it is that a trend reversal has taken place, the more important it becomes to avoid trades in the old direction, since it is now likely that there will be at least two legs in the new direction. Also, the amount of time and number of points in this move will usually be roughly proportional to the clarity of the reversal. When you have a great reversal setup, you should swing part or, rarely, even all of your position.
All pullbacks begin with a reversal pattern of some type. It is usually strong enough to entice countertrend traders into taking a position against the trend, but not strong enough to be a reliable countertrend setup. Since the setup and the pullback are not strong enough to change the direction of the always-in trade, traders should not be looking for a countertrend trade. Instead, they should be looking for a setup that signifies a possible end of the pullback and then enter in the direction of the trend. However, since the pullback began with a reversal, many traders would be overly cautious and talk themselves out of a great trade. You are never going to be 100 percent certain of any trade, but when you are reasonably confident that a trade looks good, you have to trust the math, take the trade, and simply accept the reality that you will lose some of the time. That is just the nature of the business, and you cannot make a living as a trader unless you are willing to take losses. Remember, a major league baseball hitter who fails 70 percent of the time is considered to be a superstar and makes millions off that other 30 percent.
When the market is in a weak trend, or in the early stages of transitioning from a trading range into a trend, it will sometimes have a flag, and then a flag breakout, and then a pullback, and that pullback becomes another flag. The market will sometimes do this several times before a strong breakout materializes.
One- and two-bar pauses are more difficult to trade than pullbacks that last many bars and actually pull back from the extreme. For example, if there is a strong bull move in which the last bar was a small bar with a high just a tick or two below the prior bar's high and that bar was a large bull trend bar and followed one or two other large bull trend bars, if you buy one tick above this bar, you are buying at the high of the day. Since lots of institutions fade every new high, there is a substantial risk that the move might reverse and hit your stop before your profit target is reached. However, if the trend is very strong, this is an important trade to take. Part of what makes this trade so difficult is that you have very little time to analyze the strength of the trend and to look for possible trend channel line overshoots or other reasons why the trade might fail.
An even more difficult pause is a small doji with a high one tick above the high of the prior strong bull trend bar. Buying above the high of the doji is sometimes a good trade, but for most traders, it is too difficult to assess risk quickly enough and it is better to wait for a clearer setup. A reason against buying a pause bar breakout is if the last trend bar or two had fairly large tails, which indicates that countertrend traders were able to assert some influence. Also, if the prior with-trend entry followed a larger pullback, like a high 2, you should be hesitant since each pullback usually gets deeper, not shallower. However, if the market just broke out and had three bull trend bars with closes near their highs, then the chance of a successful scalp when you buy above the pause bar that follows these bars is good. In general, these high 1 longs (or low 1 shorts in bear trends) in the early stages of a strong bull trend are the only pause bars entries that most traders should consider. Also, remember that a pause bar after a one-bar breakout is just as likely to be an entry in the opposite direction, since one-bar breakouts often fail, especially if they are countertrend.
If a pullback is small compared to the trend, it is usually safe to enter as soon as it ends. If it is large enough to be a tradable, strong countertrend move, it is better to wait until a second signal sets up. For example, if there is a protracted bear channel in a strong bull trend, rather than buying the first reversal back up, it is safer to wait for a pullback from that breakout and buy the breakout pullback.
All bull pullbacks end for a reason, and that reason always is that the market has reached some kind of support. Sometimes they end quietly and other times with strong trend bars against the main trend and come close to reversing the trend. This is true of large pullbacks, and one- or two-bar pullbacks from breakouts of small flags. Even the 1987 and 2009 stock market crashes ended at the monthly bull trend line, and were therefore just pullbacks in a bull trend. Most end at a cluster of support levels, even though many traders may not see some or all of them. Some traders will buy a pullback in a bull trend because they are focused on one support level, whether it is a bull trend line, a channel line along the bottom of the bull flag, a prior high or low, some moving average, or any other type of support, and others will buy because they see a different support level in the same area. Once there are enough buyers coming in to overwhelm the bears, the trend will resume. The same is true of bear pullbacks. They always end at a cluster of resistance levels, although it is often easy to not see the resistance that the market is seeing. Once the market gets close to the key price, the vacuum effect often dominates. For example, if buyers believe that the market is getting close to an important support level, they will often step aside and wait for that level to be hit. This can result in a very strong bear spike, but once the support is hit, the bulls come in and buy aggressively and relentlessly. The same is true for the bears who created the pullback. They, too, see the support level, and the closer the market gets to it, the more confident they are that the market will get there. The result is that they sell aggressively and relentlessly until the level is reached, and then they suddenly stop selling and quickly buy back their shorts. The pullback can end with a large bear trend bar that looks like it might flip the always-in trade to short, but the follow-through selling over the next bars does not develop. Instead, the bull trend resumes, sometimes slowly at first. With both the bulls and the bears buying, the reversal can be sharp and go a long way. The vacuum effect is always present, even during the most dramatic reversals, like the 1987 and the 2009 stock market crashes. In both instances, the market was in a free fall, but strongly reversed up once the market fell a little below the monthly trend line. As dramatic as both crashes were, they were just examples of the vacuum effect at work.
This same behavior happens on a one- or two-bar pullback from the breakout of a flag. For example, if there is a low 2 bear flag at the moving average in a strong bear trend and it triggers a short, the entry bar might be followed by a bull trend bar. This represents a failed breakout and could be the start of a bull trend or a larger bear rally. However, it usually fails, and when a failure fails, it becomes a pullback in the larger trend. Here, it becomes a breakout pullback short setup. Traders will expect it to fail, and aggressive bears will short on its close and just below and above its high. More conservative traders will wait for confirmation that this bear trend bar is just a pullback from the breakout of the bear flag. They will short on a stop below the low of the bear bar, or the next bar or two, if the pullback continues a little longer.
Since a pullback is only a pause in a trend and not a reversal, once you identify what you believe is a pullback, you believe that the trend will resume and there will be a test of the trend's extreme. For example, if there is a bull trend and then the market sells off for several bars and if you see that sell-off as a buying opportunity, then you believe that it is just a pullback in the bull trend. You are expecting a test of the bull trend's high. It is important to note that the test does not have to reach a new high. Yes, it is often a higher high, but it can be a double top or a lower high. After the test, you will then decide whether the bull trend is intact or has transitioned into a trading range or even a bear trend.
Pullbacks are often strong spikes that make traders wonder if the trend has reversed. For example, in a bull trend, there might be a large bear trend bar or two that break below the moving average and maybe several ticks below a trading range. Traders will then wonder if the always-in direction is in the process of flipping to down. What they need to see is follow-through selling in the form of maybe just one more bear trend bar. Everyone will watch that next bar closely. If it is a large bear trend bar, most traders will believe that the reversal has been confirmed and will start shorting at the market and on pullbacks. If the bar instead has a bull close, they will suspect that the reversal attempt has failed and that the sell-off is just a brief, but sharp, markdown in price and therefore a buying opportunity. Beginning traders see the strong bear spike and ignore the strong bull trend in which it is occurring. They sell the close of the bear trend bar, below its low, any small bounce over the next few bars, and below any low 1 or low 2 sell setup. Smart bulls are taking the opposite side of those trades because they understand what is happening.
The market is always trying to reverse, but 80 percent of those reversal attempts fail and become bull flags. At the time the reversal attempt is occurring, the two or three bear bars can be very persuasive, but without follow-through selling, the bulls see the sell-off as a great opportunity to get long again near the low of a brief sell climax. Experienced bulls and bears wait for these strong trend bars and sometimes step aside until one forms. Then they come into the market and buy because they view it as the climactic end of the selling. The bears buy back their shorts and the bulls reestablish their longs. This is the opposite of what happens at the end of a trend when the strong traders are waiting for one large trend bar. For example, in a strong bear trend near a support area, there will often be a late breakout in the form of an unusually large bear trend bar. Both the bulls and the bears stopped buying until they saw it form. At that point, both buy the sell climax, because the bears see it as a great price to take profits on their shorts and the bulls see it as a brief opportunity to buy at a very low price.
If traders see what they believe is just a pullback, then they believe that the trend is still intact. When they are evaluating the trader's equation, the probability is never known with certainty, but since they are making a trade in the direction of the trend, they can assume that the directional probability of an equidistant move is 60 percent. It might be higher but it is unlikely to be much lower. Otherwise, they would have concluded that the pullback had lasted so long that it had lost its predictive value and had become an ordinary trading range, which has about an equal probability of the eventual breakout being up or down. Once they determine their risk, they can then set a profit target that is at least as large as the risk and reasonably assume that they have about a 60 percent chance or better of being successful. For example, if they are buying a breakout of a bull flag in Goldman Sachs (GS) and their protective stop is below the bull flag, about 50 cents below their entry, they can assume that they have at least a 60 percent chance of making at least a 50 cent profit on their long. Their profit target might be a test of the bull high. If it is and that high is $2.00 above their entry, they likely still have about a 60 percent chance of success, but now their potential reward is four times their risk, and this creates a very favorable result from the trader's equation.
Once you believe that the market has reversed, it usually will pull back to test the prior trend's extreme before the new trend unfolds. For example, assume that there is a bear trend and that the prior pullback was strong enough to break above the bear trend line and now the market is reversing up from a lower low test of the bear trend's bottom. This is a possible trend reversal into a bull trend. If that first leg up is in the form of a strong spike, you then believe that the odds of a reversal are now even greater. The pullback from that first strong leg up will usually result in a higher low, but it can also result in a double bottom with the bear's low or even a lower low. How can it be that you believe that the trend has reversed up into a bull trend, yet the market has now fallen to a lower low? A lower low is one of the hallmarks of a bear trend, and it can never be a part of a bull trend. Yes, that is the conventional wisdom, but you stand to make more money as a trader if you use broader definitions. You might stop yourself out of your long if the market falls below the old bear low, but you might still believe that the bulls really control the market. That spike up was a breakout of the old bear trend and converted the market into a bull trend. It does not matter if the pullback from the breakout falls below the bear low. Suppose the market stopped exactly at the old low instead of going one tick lower. Do you really think that is of major importance? Sometimes it is but usually close is close enough. If two things are similar, they will behave the same. It also does not matter if you consider the bottom of the bull spike or the pullback to the lower low as the start of the bull trend. Strictly speaking, the spike was the first attempt at a reversal and it failed once the market fell below the bottom of the spike. However, it was still the breakout that showed that the bulls took control over the market, and it really does not matter that the pullback fell to a lower low and that the bears briefly regained control. All that matters is that the bulls are in control and will likely be so for many bars, so you need to be looking to buy pullbacks, even that first pullback to the lower low.
Pullbacks to lower lows in bull trends or higher highs in bear trends are common in the small legs that take place on every chart. For example, assume that there is a bear trend and then there is a tight channel rally to the moving average that lasts about eight bars. Since the channel is tight, it is strong and this means that the first bear breakout will likely fail, even though it is in the direction of the trend. Traders usually wait for a pullback back up before looking to short. However, that pullback will often be in the form of a higher high, creating an ABC pullback in the bear trend. They will short below the low of the prior bar, confident that a low 2 short at the moving average is a great trade in a strong bear trend. Many traders do not think of this ABC as a bear breakout (the B leg is the breakout below the channel that constitutes the A leg) and then a breakout pullback to a higher high (the C leg), but that is what it actually is, if you think about it.
There is a special type of higher high or lower low pullback that is common in major trend reversals, which are discussed in book 3. For example, if there is a bull trend that has a strong move down below the bull trend line, and then a weak rally (for example, a wedge) to a new high, this higher high is sometimes the start of a new bear trend. If the trend then reverses down into a bear trend, this weak rally to the higher high is simply a pullback from the bear spike that broke the bull trend line. That bear spike was the actual start of the bear trend, even though the pullback from the spike rallied to above the top of the bear spike and created a new high in the bull trend. After the bear trend has gone on for 20 or more bars, most traders will look back at the higher high and see it as the start of the bear trend, and that is a reasonable conclusion. However, as the trend was forming, astute traders were wondering if the market had reversed into a bear trend, and they did not care if the rally up from the bear spike tested the bull high as a lower high, a double top, or a higher high. From a strictly technical perspective, the trend began once the bears took control of the market during the bear spike and not with the test of the bull high. The confirmation of the trend reversal came once the market sold off strongly from the higher high. Although the higher high is actually simply a pullback from the bear spike, it does not matter which of the two highs you think is the start of the bear trend, because you would trade the market the same way and look to short below the higher high. The same is true when a bear trend reverses into a bull trend from a lower low after a strong rally breaks above the bear trend line. The bulls took control of the market on the spike that broke above the bull trend line, but most traders would say that the new bull began with the lower low. However, that lower low was simply a pullback from the strong bull spike.
Any trend that covers a lot of points in very few bars, meaning that there is some combination of large bars and bars that overlap each other only minimally, will eventually have a pullback. These trends have such strong momentum that the odds favor resumption of the trend after the pullback and then a test of the trend's extreme. Usually the extreme will be exceeded, as long as the pullback does not turn into a new trend in the opposite direction and extend beyond the start of the original trend. In general, the odds that a pullback will get back to the prior trend's extreme fall substantially if the pullback retraces 75 percent or more. For a pullback in a bear trend, at that point, a trader is better off thinking of the pullback as a new bull trend rather than a pullback in an old bear trend.
The most frustrating thing about waiting for a pullback is that sometimes it never seems to come. For example, when there is a rally and you are now confident that it would be smart to buy a pullback, the market goes up bar after bar and does not pull back until it has gone so far that now you think it might reverse instead of pulling back. Why is that? Every bull trend is created by buy programs that use every imaginable algorithm, and strong trends occur when many firms are running programs in the same direction. Once you are confident that the bull trend is strong, so is everyone else. Experienced traders understand what is going on, and they realize that any pullback will almost certainly be bought and it will be followed by a new high. Because of that, instead of waiting for a pullback, they are doing just what the institutions are doing. They are buying at the market and on tiny pullbacks that are not evident on the chart in front of them. Maybe they are buying on a one- or two-tick pullback. The programs will keep buying because the probability is that a trend will continue until it reaches some technical level. At that point, the math will favor a reversal. In other words, the math overshot neutrality and now favors a reversal, and because it does, the firms will aggressively trade in the opposite direction and the new trend will continue until once again it overshoots neutrality and the odds again favor a move in the opposite direction.
For example, if AAPL is up $4.00 at $280 and it has gone up for seven straight bars on the 5 minute chart, it will probably go up for the eighth bar and even more. Traders are willing to buy at $280 because they understand the logic of the directional probability of an equidistant move. Since they are confident that at some point soon the market will be higher than it is right now and they are not confident that it will be lower soon, they buy at the market and on small dips. Although they may not think in terms of directional probability, all trend trading is based on it. When AAPL is trending up strongly, they would rather buy at $280 because they believe that the market will reach $281 before it falls back to $279. They also likely believe that it will reach $282 and maybe $283 before it falls back one dollar. They may not think of this in terms of math and the exact probability is never certain, but in this situation, there is probably about a 70 percent chance that AAPL will go two or three dollars higher before it pulls back one dollar. That means that if you take this trade 10 times, you will make two dollars in seven cases for $14 profit and you will lose one dollar three times. Your net profit is $11, or more than a dollar per trade.
If instead they wait for the $1.00 pullback, it might not come until AAPL is at $283. They then could buy it at $282, but that is two dollars worse than what they could have paid earlier if they just bought at the market.
If after they bought at $280, AAPL fell to $279, many traders would buy more because they believe that the odds are probably better than 70 percent that it would rally to a new high and they could get out of their first long at breakeven and have a dollar profit on their lower entry.
This is important for traders who are waiting to enter on pullbacks. When the trend is strong, it is often better to enter at the market than to wait for a pullback.
Figure PIII.1 Pullbacks Begin with Reversals
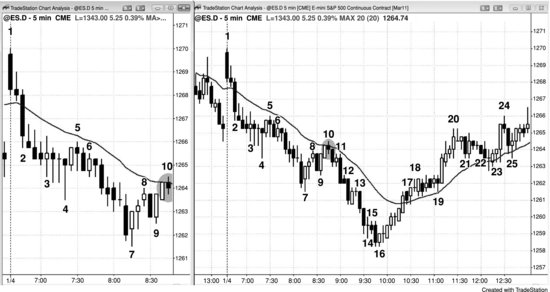
All pullbacks begin with a reversal, and it is often strong enough so that traders are too afraid to take the with-trend signal when it finally develops. In Figure PIII.1, the chart on the left shows what the 5 minute chart looked like at the time of the bar 10 low 2 sell setup at the moving average, and the chart on the right shows the entire day. Bar 7 was a strong bull reversal bar, and it was followed by a strong two-bar reversal and higher low at bar 9. However, the market had not touched the moving average in more than 20 bars, so the bear trend was strong and the bears were likely going to look to short a two-legged rally to the moving average, especially if there was a bear signal bar. When the perfect setup finally formed, many beginners were so focused on bars 7 and 9 that they ignored the bear trend that preceded them, and the reality that a low 2 short at the moving average where there is a bear signal bar is a reliable sell setup. The rally was created by profit-taking bears and scalping longs, and both planned to sell into strength on a two-legged pullback to around the moving average. The longs took profits and the bears reestablished their shorts. Nothing is ever going to be 100 percent certain, but a low 2 at the moving average in a bear trend where there is a bear signal bar is usually at least 60 percent likely to be a successful short for bears who shorted on a stop at one tick below bar 10. In this particular case, the signal bar was only three ticks tall, so a bear would have been risking five ticks for a test of the bear low, which was about two points lower. Many bears shorted this first pullback to the moving average with a limit order located one tick below the moving average. Other bears saw this as the first two-legged bear rally, and therefore expected it to fail. When they saw the bar 9 bull reversal, they placed limit orders to short at or above the bar 8 high and were filled on the rally to bar 10. They expected any reversal to be the start of a bear flag and thought that any breakout to the upside would be a brief opportunity to reestablish shorts at a higher price; they aggressively seized that opportunity, overwhelming bulls who bought the breakout above bar 8.
The bar 10 low 2 bear flag broke out with a strong bear trend bar, but was followed by a bar with a bull body. This was an attempt to have the breakout fail. The bulls wanted the market to form a failed low 2 and then a rally, and flip to always-in long. However, traders know that most reversal attempts fail, and many shorted the bull close and had limit orders to short above its high. Because the bears did not know whether the market would trade above the high of this bull bar, if they were hoping to short at or above the bar but wanted to guarantee getting short even if their limit orders up there did not get filled, many also placed stop orders at one tick below its low. If their limit orders at the high of the bar were filled, many would have canceled their stop entry orders. If their limit orders were not filled, the stop below the bar would have ensured that they got short. Most would have already shorted the low 2 breakout, but some would have added on as the market went their way. This is particularly true of computerized program trading where many programs continue to short as the market continues to fall.
Incidentally, one of the cardinal rules about trading reversals is to exit on the market's second attempt to resume the trend. In this case, it was premature to expect bar 7 to be a lasting bottom. Once the market formed a low 2 at the moving average, and especially with the bar 10 signal bar having a bear body, all the longs must exit. Very few had the ability to reverse to short, and those who did not have that ability exited their small long scalps and missed a big short trade. It is far better to wait patiently to short a rally to the moving average in a bear trend than it is to scalp a long.
Once the bull trend was clear, traders expected the first two-legged pullback to fail. When they saw the bull trend bar after bar 21, they placed buy limit orders at the bar 21 low, since they expected that the breakout below bar 21 would fail. It would have been the first two-legged move down in a strong bull trend, and most firsts against a strong trend fail. They also believed that the moving average would be support and that there would be aggressive buyers there. Their buy limit orders were filled as the market fell to the moving average. Other bulls entered on a buy stop above the bar 23 high, since it was a high 2 buy setup in a bull trend with a bull signal bar at the moving average, which is a very strong buy setup.
The bar 24 bear reversal bar had a tail on the bottom and was slightly less strong than the bull breakout of the bear micro channel from bar 20 to the bar before bar 23. The breakout bar was a large bull trend bar, and it followed two bull bars. Some traders shorted below bar 24, expecting the bull breakout to fail. Others waited to see what the next couple of bars would look like. The short entry bar was a strong bear bar but held above the low of the bull breakout bar, so the market did not yet flip to always in short. The next bar had a bull body, and therefore did not confirm the selling. Bulls bought above its high, believing that it was a reasonable breakout pullback buy setup at the moving average in a bull trend, or in a bull leg in a developing trading range.
Figure PIII.2 Every Pullback Begins with a Reversal
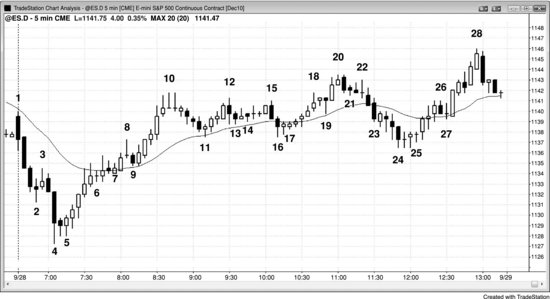
Every pullback begins with some kind of reversal setup. The reversal is needed for many with-trend traders to begin to take profits, and for countertrend trades to initiate trades. Yes, institutions create the reversal pattern as the with-trend institutions take profits and the countertrend institutions begin to scale into reversal trades. However, lots of other institutions and traders wait for the early signs of a reversal before initiating their trades, and the cumulative effect of all traders creates the pullback. If the trend is strong and the reversal setup is weak, the pullback sometimes lasts only a bar or two, like at bars 3, 9, and 19 in Figure PIII.2. Sometimes it is just a pause and creates a sideways pullback, like bar 7.
There was a four-bar bear spike down to bar 2, but the third and fourth bars had shrinking bear bodies, indicating a loss of momentum. The tails on bar 2 are a sign of two-sided trading. Some traders thought that this could be signaling an opening reversal and the low of the day and they bought above bar 2.
The five-bar bull spike up from bar 5 was enough to make most traders believe that the always-in trade had flipped to long. They expected higher prices, and they believed that any sell-off would be bought aggressively and result in a higher low. However, there were three pushes up to bar 8, and this wedge top could have two legs down. This resulted in a one-bar pullback that was followed by another strong leg up. Since the rally up from bar 5 was so strong, many traders believed that any pullback would be bought.
Once everyone believes that there are strong buyers below, they just buy at the market. They don't know if the market will pull back soon but they do believe that whether or not it does, it will soon be higher. Rather than risk missing too much of the trend, they start buying at the market, and they keep buying until they think that the market might finally be starting to pull back.
Bar 10 had a couple of doji bars after a parabolic move in a spike and climax bull trend. The five bars up from bar 5 formed the bull spike. It was also a new high of the day. Some traders began to short what they thought could be the high of the day, but it resulted in only another pullback.
Some traders saw bar 18 as a possible double top with bar 10, and they shorted below the inside bar signal bar. Since there were seven consecutive bull bodies, most traders expected more uptrend so they bought below the low of that signal bar instead of shorting there.
Bar 26 was a bear reversal bar and a possible lower high after a reversal down through the bar 16 bottom of the trading range. However, more traders believed that the day was a strong bull trend day and they bought at and below the low of bar 26.
Figure PIII.3 Breakout Pullbacks
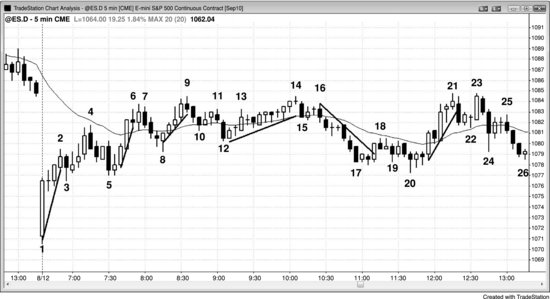
When a channel is steep, it is better not to enter a reversal trade on the breakout through the trend line and instead wait to see if there is a breakout pullback that sets up a second signal. In Figure PIII.3, the spike up to bar 2 was too steep to short the first breakout below the trend line. Instead, traders should consider shorting only if there is a breakout pullback that tests the high of the spike. The test can be a lower high, a double top, or a higher high. Here, there was a higher high just below the moving average at the bar 4 bear reversal bar.
The spike up to bar 6 was also too strong to short on the breakout below bar 6. The bears were hoping for a successful breakout below the bull trend line with good follow-through to the downside. Instead, traders should wait for a breakout pullback before considering going short. Here, the bar after bar 6 became an outside up bar, and it was a higher high test of the high of the tight channel from bar 5 up to bar 6. It was followed by a bear inside bar, forming an ioi (inside-outside-inside) higher high short setup.
The channel from bar 8 up to bar 9 had four consecutive bull trend bars and was therefore too strong to short the first breakout below the channel. Instead, traders should wait to see what the breakout pullback looked like. It was a lower high at bar 11, and they could go short at one tick below its low.
The bull channel from bar 12 to bar 14 was very tight and therefore traders should not short the breakout below the trend line. Instead, they should wait to see if there was a good breakout pullback short setup. Bar 16 formed a lower high test of the channel high, and traders could short as bar 16 fell below the low of the prior bar and became an outside down bar. Alternatively, they could wait for the bar to close. Once they saw that it had a bear body and it closed below the low of the prior bar, they could short below the low of the bar 16 outside down bar, which is a higher-probability short since that bear close gave them additional confirmation that the bears were strong.
The sell-off down to bar 17 was in a tight channel and there were seven bars without a bull close. This is too strong to buy the first attempt to break out to the upside. The breakout pullback was to a lower low at bar 20, and the buy setup was an ii (inside-inside) pattern.
The rally to bar 21 was in a steep bull channel with seven bars with higher lows and highs. This is too strong to short the first breakout below the bull channel. The breakout pullback to bar 23 formed a double top with the bar 21 channel high. The following bar was a strong bear inside bar, which was a good signal bar for the breakout pullback short.
The move down to bar 5 was a bull flag, and it was followed by a breakout and then a pullback to bar 8, which was at the bottom of another bull flag. It then broke out to bar 9 and formed another pullback to bar 12, which was another bull flag buy setup. The market often has breakouts that lead to pullbacks that become flags. This usually happens in weaker trends and in trading ranges, as it did here.
Although bars 5 and 12 were strong bear trend bars and attempts to flip the always-in position to short, they did what most such attempts do—they failed. The bears needed one more strong bear trend bar before they could convince traders that the short-term trend was down and lower prices were likely over the next several bars. When it became clear that the bulls were buying relentlessly and the bears could not push the market down, they bought back their shorts. Their buying, combined with the continued buying by the bulls who saw the strong bear trend bars as great opportunities to buy at a low price, resulted in the resumption of the bull trend. Bulls like to see strong bear trend bars into support. They know that they represent attempts by the bears to reverse the trend and that most will be brief and fail. They often step aside and wait for one to form, and they see it as a likely end of the pullback. This gives them a brief opportunity to buy at a low price. Experienced traders can buy at the close of the bear trend bar, at and below its low, and at the close of the next couple of bars. Most traders should instead wait for a bull reversal bar and buy above its high, or wait for the reversal up, and then buy above a pullback from the breakout of the bull flag (like above the two-bar sideways pullback that followed the bar 13 breakout of the bar 12 high 2 bull flag).