Part IV
Trading Ranges
The broadest and most useful definition of a trading range is that it is simply an area of two-sided trading. It can be as small as a single bar (a doji bar) or larger than all of the bars on your screen. It can be mostly horizontal, which indicates that the bulls and bears are in balance, or it can be slightly sloping. If it slopes up, the bulls are more aggressive. If it slopes down, the bears are stronger. If it slopes too much, it should be considered to be a trend channel and not a trading range. It can have very large swings lasting many bars or it can be very tight with each swing lasting only a bar or so, creating a narrow channel. When it is horizontal, the lines that contain it are support and resistance lines, with the support line below and the resistance line above.
The term trading range is usually applied to any section of a chart that is not trending and is mostly horizontal, but using the broader definition is more useful to traders because once you know that there is two-sided trading, you can look for opportunities to trade in both directions. Many beginners are too eager to look for reversals and can't resist trading them before the market is likely enough to transition from a trend to a trading range. However, once there is enough evidence that the transition is taking place, there are often high probability countertrend scalp and even swing setups. The key is to wait for enough evidence before taking them. Some patterns are usually not thought of as trading ranges but actually fit the broader definition of any area of the chart where there is two-sided trading taking place, which is most of the time. A trend has brief spikes where there is little two-sided trading, but most of the price action in a trend has some two-sided trading taking place and is therefore some type of trading range.
A pullback is a trading range where traders believe that the trend will soon resume. A traditional trading range is an area where there is uncertainty and the trend could resume or reverse, but most attempts to break out fail. A rising channel in a bull and a falling channel in a bear are sloping trading ranges, since both have two-sided trading, but the trend traders are more aggressive than the countertrend traders. They are also the first leg in a trading range that is not yet evident. For example, after the market spikes up in a strong series of large bull trend bars with only small tails and very little overlap, it soon enters a phase where there is more overlap of the bars, larger tails, some bear bodies, a shallower slope, and some pullbacks, even if they last for only a single bar. This is a bull channel, but all channels are basically trading ranges because they represent two-sided trading. If the channel is steeply up and the pullbacks are small, the bears are there but are getting overwhelmed by the bulls. A channel is made of a series of small trading ranges, each followed by a small breakout that leads to another small trading range. As the channel matures, the swings become larger as the bulls become less aggressive and the bears more aggressive. There will be a break below the channel and then usually a test to the bottom of the channel. At that point, the market had a leg up (the bull channel) and a leg down (the test of the bottom of the channel), and most traders will see the overall pattern as a trading range. It might form a double bottom bull flag or, at some point, the bears will take control and there will be a spike down and the process will reverse.
Here are some characteristics that are commonly found in trading ranges:
- There is a sense of uncertainty about the direction of the impending breakout. In fact, uncertainty is the hallmark of a trading range; whenever most traders are uncertain, the market is in a trading range (trends have a sense of certainty and urgency). Usually, however, a trading range is ultimately a trend resumption setup, which means that it is just pullback on a higher time frame chart.
- Almost all of the trades look like they are no more than 55 percent certain.
- There are both legitimate bull and bear setups forming at the same time.
- There are several changes in direction on your screen.
- The overall price action is mostly horizontal, with the bars on the left and right edges of the screen in the middle third of the screen vertically.
- Most of the bars are in the middle of the screen, and there are sharp reversals near the top and bottom.
- The market runs stops repeatedly, often with strong trend bars, but then reverses direction on the next bar. For example, the market will have two bear trend bars that fall below a strong swing low, but then the market reverses up on the next bar.
- There are many bull and bear trend bars but few instances where there are three or four consecutive bull trend bars or bear trend bars.
- Many bars have prominent tails.
- Many bars overlap 50 percent or more of the bar before.
- There are many areas where there are three or more bars that each overlap by 50 percent or more of the range of the prior bars.
- There are many dojis, which can be large or small.
- The moving average is relatively flat.
- The price action off the screen to the left was also in a trading range.
- There was just an impressive buy or sell climax.
- The vacuum effect is present, resulting in strong bull spikes at the top and strong bear spikes at the bottom, with both failing to break out and instead reversing back into the range.
- Many legs subdivide into two smaller legs and then reverse into a two-legged move in the opposite direction.
- Low 1 and low 2 short setups at the bottom and high 1 and high 2 buy setups at the top usually fail.
- Signal bars often look weak, even for second entries.
Any area of two-sided trading, even if it lasts for only a single bar, is a trading range. When you refer to a trading range as a pullback, you believe that the odds are favorable that the trend will soon resume and you will, therefore, likely be taking trades only in the direction of the trend. Every trader will have different criteria, but, in general, if you are about 60 percent or more certain that your trade will soon be followed by a resumption of the trend, then you believe that the pattern is a pullback. If instead you are less certain that your trade will be followed by a breakout, then the pattern is a trading range. A trading range is just a pullback that has lasted so long that it has lost its short-term predictive power, and 80 percent of the breakout attempts up or down will fail. If you buy near the bottom, the market will probably trade to the top, but instead of breaking out, there will be a sell setup and the market will return to the area of your long entry. If you short near the top, the market will probably trade down far enough to scalp a profit, but then rally back again to around your entry price. Ultimately, the odds favor that the trend that preceded the trading range will resume because it is simply a pullback on a higher time frame chart; however, if it lasts for days on the chart that you are trading, you will miss many trading opportunities if you simply place that single with-trend trade and wait for the breakout. Although you can trade it as a pullback on a higher time frame chart, most traders find it easier to make money if they watch and trade only a single chart, even though they are aware of setups on higher and lower time frame charts.
With a pullback, you should usually look to trade only in the direction of the trend, unless the pullback is likely to be large enough for a countertrend scalp. Most traders should still wait for the with-trend setup because countertrend scalping is a losing strategy for everyone except the most experienced traders. If you trade countertrend, you should do so only if you believe that the market will enter a trading range instead of just a pullback. With a trading range, you can trade in both directions, knowing that most breakout attempts up and down will fail. However, if there is a particularly strong setup at the bottom of a trading range in a bull market, you can consider swinging all or just part of your trade. Likewise, if there is a strong sell setup at the top of a trading range that followed a strong bear trend, you should swing part or all of your short position.
The final leg down in most trading ranges in bull markets is a bear channel, which is a last-ditch attempt by the bears to create a top and a new bear trend. A bear channel is a bull flag. Bulls can buy the reversal up from the bottom of the trading range or on the breakout pullback that usually follows soon afterward. When the trading range is in a bull market, the rallies tend to be stronger than the pullbacks, especially as the trading range nears its end. In addition, each pullback functions as a flag. The next rally is a breakout from that bull flag, and the next pullback is a breakout pullback setup, as well as another bull flag. One of those bull flags will be the final one, and its breakout will become the next leg up in the resumption of the bull trend. Since all trading ranges are pullbacks on higher time frame charts, that breakout will also be the breakout of that higher time frame bull flag. The opposite is true of trading ranges in bear trends, where the final leg is usually a bull channel, which is a bear flag.
Channels usually eventually evolve into trading ranges, and traders are always looking for the earliest signs of the transitions, because a channel is a trend, and traders are less willing to trade against it than they are in a trading range, where traders trade in both directions. Once traders believe that it has become a trading range, there will be spikes and channels in the opposite direction. Sometimes the trend will reverse (most reversal patterns are trading ranges), but more likely, the market will be in a trading range for at least 10 or 20 more bars.
Every channel has two-sided trading and is usually the start of a trading range. However, as long as the highs and lows keep trending, the channel is still in effect and the market has not yet converted to a trading range. For example, in a rising channel, the bulls will buy all pullbacks aggressively when the market gets near the most recent higher low, because they want everyone to see the market as still in a channel, which is a type of bull trend, and not in a trading range. This will make other traders more likely to buy, the rally more likely to continue, and their profit grow. Sometimes the market will fall below a minor higher low and find buyers. This new low is the basis for a new, flatter trend line (from the bottom of the channel) and a less steep, broader channel. It indicates that the price action is becoming more two-sided and therefore more like a trading range, but still in a channel. Once the market clearly enters a trading range, traders will start selling rallies, which will reduce the ability of the bulls to keep pushing the market higher and limit their ability to profit. As long as they can keep the market trending up, they know that most traders will only look to buy. The market will often pull pack to the most recent higher low and set up a double bottom bull flag. This is acceptable to the bulls because they know that it is a bullish setup and that the market will expect about a measured move up if the setup triggers (by trading above the high of the signal bar). At least they then have an idea of how much higher the rally might go, and this will give them a profit-taking target.
When the market is in its spike phase of a trend, it is very one-sided and pullbacks are created by institutions taking profits, not by them trading in the opposite direction. As pullbacks get deeper, countertrend traders begin to scalp. Once pullbacks grow into trading ranges, more countertrend traders are scalping and some are scaling into shorts. The with-trend traders become less confident about how much further the trend can go, and they transition from swing trading into more scalping. That is why in a trading range, scalping by both the bulls and bears is dominant. Both are buying low and selling high. The buying at the bottom is being done by bulls initiating longs and bears taking profits, and the selling at the top is by bears shorting and bulls taking profits. Since a trader's job is to follow the institutions, he too should be scalping, and buying near the bottom and selling near the top of the range. Whenever the market is in a trading range, traders should immediately think, “Buy low, sell high, and scalp.”
Trading ranges have two-sided trading, where the bulls are stronger near the bottom and the bears are stronger near the top. Every rally in a trading range is essentially a bear flag and every selloff is effectively a bull flag. Because of this, traders trade the top of the range the way they trade a bear flag in a bear trend. They sell above and below bars, and above resistance and below support areas. They sell above bars, including strong bull trend bars, and above every type of resistance, because they see each move up as an attempt to break out of the top of the range, and they know that most breakout attempts fail. They sell below bars and below every type of support, because they see each move down as equivalent to a breakout of the bottom of a bear flag in a bear trend. They expect that attempts to break above the trading range will fail, that the bear flag breakouts will succeed, and that the market will soon reverse down and test the bottom of the range.
They trade the bottom of the range the way they trade a bull flag in a bull trend. They buy above and below bars, and above resistance and below support areas. They buy below bars, including strong bear trend bars, and below every type of support, because they see each a move down as an attempt to break out of the bottom of the range, and they know that most breakout attempts fail. They buy above bars and above every type of resistance, because they see each move up as equivalent to a breakout of the top of a bull flag in a bull trend. They expect that attempts to break below the trading range will fail, and that the bull flag breakouts will succeed, and that the market will soon reverse up and test the top of the range.
When the chart is trending, the trading ranges are relatively small and better described as pullbacks since they are just brief pauses in the trend and are followed by a test of the trend's extreme. If no test comes and the market reverses, what at first appeared to be a pullback has evolved into a reversal pattern. If the chart is composed of upswings and downswings across the entire screen, then neither the bulls nor the bears are dominant and they are alternating control over the market and the chart is then in a trading range. Each swing is a small trend that is potentially tradable, especially on a smaller time frame. On a larger time frame, the trading range will be a pullback in a trend. For example, a 5 minute chart that is a large trading range will likely be just a pullback in a trend on the 60 minute chart, and a 60 minute trading range will be a pullback on a daily or weekly chart.
Many traders use descriptive names like flags, pennants, or triangles, but the name is irrelevant. All that matters is that two-sided trading is taking place. The market is in breakout mode and at some point it will break out in either direction into another trend. Both the bulls and the bears believe that this price area is an area of good value, and both are initiating trades. Value exits at extremes. The market is either too cheap, as it is at support, or too expensive, as it is at resistance. The middle of a trading range is also an area of value for both the bulls and the bears, because both see it as an extreme. The bulls believe that the market is bottoming and therefore at a low, and the bears see it as topping and at a high. If the market drops a little, the bears will sell less and the bulls will become more aggressive at this better, more extreme price. This will tend to lift the market back toward the middle of the range. If the price goes up near the top of the range, the bulls will buy less, since they will see the market as a little expensive. The bears, in contrast, will be even more eager to sell at these better prices.
Even a steep channel represents breakout mode. For example, if there is a steep bull channel, the market can break out of the top of the channel and the trend can accelerate to the upside. When this happens, the breakout usually fails after one or two attempts and usually within about five bars, and if the market reverses back into the channel, it usually pokes through the opposite side of the channel and often is followed by a larger correction or a reversal. Even if a breakout spike lasts several bars, there is usually a pullback soon that tests the channel, and it often reenters the channel, breaks out of the other side, and then is followed by at least a two-legged correction and sometimes a trend reversal.
On a 5 minute Emini chart, when the market is in a relatively tight trading range where the swings are only two to four bars long before the market reverses toward the other side of the range, there is often much more going on than what appears to be happening. It is easy to ascribe the price action simply to random drift with light trading; but if you look at the volume, you will often discover that the bars are averaging 10,000 contracts or more. This is not light trading. What is probably happening is that many institutions are running buy programs while other institutions are running sell programs within the range. When the market gets near the top of the range, the sell programs are selling more aggressively; when it is near the bottom, the buy programs are overwhelming the sell programs. Neither side can win. At some point, either the buy programs will overwhelm the sell programs at the top of the range and the market will break out into a rally, or the sell programs will overwhelm the buy programs at the bottom of the range and the market will have a bear breakout. However, the trading range might have a dozen or more up and down swings before that happens, and since those dozen or so breakout attempts fail before one finally succeeds, it is far better to bet against them than to enter on each breakout attempt. It is important to understand that breakouts are common on every chart but most fail, as was discussed in Part I in the chapter on breakouts.
Trading ranges are always trying to break out, and because of this, the swings toward the top and bottom often have strong momentum with one or two, and sometimes three or four, large trend bars with small tails. On a test of the bottom of the range, the bears are trying to generate enough momentum to intimidate the bulls and attract other sellers so that there will be a breakout with follow-through. However, as the down leg begins, the bulls see the building downward momentum and are anticipating what the best price will be where they can buy aggressively again. The bears are also looking for a good price to take profits. What could be better than a couple of large bear trend bars that break below a swing low, especially if it is at another support area like a trend line or measured move target? Both the bulls and the bears wait for the market to test the bottom of the range, not caring if it undershoots it or overshoots it. As the market is falling toward the bottom of the range and the bulls and the bears expect it to go further to make a clear test, they have no incentive to buy when they believe they can buy even more cheaply if they wait a little more. When these institutional traders have stepped aside like this, there is a relative imbalance in the market, and the momentum often picks up as the market falls. This is the vacuum effect and it quickly sucks the market to the bottom of the range. Some large program traders trade momentum, selling aggressively when the momentum is strong and continuing to sell until the momentum down stops. This creates large bear trend bars that then are followed by a reversal up. It is common to see a large bear trend bar or two as the market tests the low of the range. Once it reaches a support level, which is usually a small measured move target, the buyers come in and aggressively buy. The bears buy back their shorts for a profit and the bulls buy new longs. This stops the momentum, causing the momentum traders to also stop selling and begin to buy back their shorts. With so many large traders buying aggressively and relentlessly, the market begins a swing up.
If you are an institutional bull or bear, this is perfect. You want to buy now that the market is at the bottom of the range, and what could be better than an overextended bear bar for your signal to buy? You believe strongly that the market will be going up, and here you have the market spiking down, showing extreme bearish strength. This is a great opportunity to buy since you believe the value is excellent and you know that if you are right, it will be at this low price only briefly. The institutional traders will appear out of nowhere and will buy aggressively. Some will buy on the close of that last big bear trend bar, whereas others will wait to see if the next bar is a pause bar. They will be even more confident if it has a bull close. If it is a pause bar, they will see that as more evidence that the bears are unable to follow through on their selling and are therefore weak. They might also wait for the market to trade above the high of the prior bar and actually reverse. There will be large bulls and bears buying at all of these signs and on all time frames, and they will have every imaginable signal telling them to enter.
Some of the profit-taking bears scaled in lower as the market fell. This made their average entry price fall as well, enabling them to aggressively buy back all of their shorts before the market reverses up to their average entry price to make sure that they have a profit when they exit. Since the shorts are buying and not selling and the bulls are now buying aggressively, there is a relative buy imbalance and the market again moves up toward the top of the range. The opposite happens at the top of the trading range, and strong bull trend bars often lead to selling by both the bulls taking profits and the bears initiating new shorts.
This is why trading ranges always race toward the top and toward the bottom and they always look like they are about to break out, only to reverse. It also explains why most breakouts of trading ranges fail and why there are bull trend bars that break out of the top and bear trend bars that break out of the bottom. The closer the market gets to the top or bottom of the range, the more traders believe that it will exceed the old extreme, at least by a tick or two. The top and bottom of a trading range have a magnetic pull that gets greater as the market gets closer to the top or bottom because large traders who expect the market to reverse are just waiting for the best price and then they suddenly enter aggressively, reversing the market. This is true for all trading ranges, including bull and bear channels, triangles, and bull and bear flags.
Never get trapped by the strong momentum surges toward the top or bottom of a trading range. You need to be following what the institutions are doing, and what they are doing is selling strong bull trend bars at the top of the range and buying strong bear trend bars at the bottom, exactly when the market looks like it has the strength to break out. Only traders who are very experienced reading charts should fade the market on the close of breakout bars. Almost all traders are more likely to be successful if they wait to enter on a stop as the market reverses back into the range. Also, they should take the trade only if the signal bar is not too large, because they need to be entering near the extreme of the range and not in the middle.
Eventually a breakout will be successful, but the prior five to ten attempts will all look very strong and fail. Because of this math, it is far better to expect failure. When a successful breakout happens, look to enter the new trend on a pullback or even during the breakout if it looks strong enough, and the overall context makes a breakout likely to succeed. But until then, follow the institutions; as soon as they are able to create a reversal (a failed breakout) near the top or bottom of the range, take the reversal entry. In Part I, the chapter on breakouts discusses how successful breakouts typically appear.
Since a trading range in a bull trend is a bull flag, and it is just a pullback on a higher time frame chart, a trader could buy the breakout on a stop and use a protective stop well below the bottom of the trading range. The chance of any one breakout being successful is about 20 percent, but the chance that the market will eventually break to the upside is about 60 percent. However, it might break to the upside and to the downside several times before the bull trend resumes, so if traders buy a breakout and do not want to get stopped out, they need to place their protective stops far enough below the trading range so that the repeated failed downside breakouts will not stop them out. Few traders are willing to risk that much and wait that long, so the majority of them should not buy most trading range breakouts. Sometimes a breakout above a trading range in a bull trend is a good entry on a buy stop, but only when the bull trend clearly has started to resume before the breakout. Even then, it is usually better to enter within the trading range as the bull trend is resuming or to wait for the breakout and either buy after the breakout, once it is clearly strong, or buy a breakout pullback, when one eventually forms.
The media makes it sound like traders oscillate between fear and greed. That is probably true for beginners, but not for experienced traders, who rarely feel either. Another pair of emotions is much more common with them, and also much more useful: uncertainty and urgency. A trend is an area of certainty, or at least relative certainty. Your personal radar can tell you if the market is more likely in a trend instead of a strong leg within a trading range. If you have a sense of uncertainty, the market is more likely in a trading range; if instead you have a sense of urgency and you are hoping for a pullback, then the market is more likely in a trend. Every trend is made of a series of spikes and trading ranges, and the spikes are brief. When they exist, there is a directional bias to the probabilities. This means that during a spike in a bull trend, the odds of the market moving X ticks higher before it moves X ticks lower are more than 50 percent, and can be 70 percent or more if the trend is strong. Both the bulls and the bears agree that the market needs to move to a new price level, where uncertainty will return. A trading range is that area of uncertainty, and whenever you are uncertain about the direction of the market, it is likely in a trading range. Within the middle of a trading range, the probability of the market moving up or down X ticks is about 50 percent most of the time. There are brief fluctuations in this probability, but most of them last for too few ticks to be traded profitably. This search for uncertainty is the basis of measured moves. The market will continue its higher-probability directional move until the odds fall below 50–50, meaning that a reversal is likely (the odds are greater that the market will now move in the opposite direction). Most of the time, that will occur at some area of support or resistance, like a prior swing point or trend line or trend channel line, and most of the time it will be in the area of some measured move. The reversal is a move toward what will become the middle of a trading range where there is a 50 percent chance of the market moving up or down X ticks before it goes X ticks in the opposite direction.
When you are completely neutral about a trading range, the directional probability of an equidistant move is 50 percent, and the market is around what will become the middle of the range. As the market works toward the top of the range, the odds favor the market going down, and the directional probability is 60 percent or more that the market will fall X ticks before it goes up X ticks. Near the bottom of the range, that is reversed, and the directional probability favors a rally. If there has been a strong bull trend leading up to the range and there has not been a clear top, then there is a directional bias in favor of the bulls, even when the market is in the middle of the trading range. If the trend was very strong, then the directional probability in the middle of the range might be 53 to 55 percent, although it is impossible to ever be certain. Just be aware that trading ranges are continuation patterns on higher time frame charts, and if there was a strong bull trend leading up to it and no clear top, the odds of an upside breakout are greater. Following a strong bull trend, when the market falls to the bottom of the range, the directional probability of an equidistant move is greater than at the bottom of a trading range that formed after a bear trend, so instead of 60 percent in favor of a rally, maybe it is 70 to 80 percent. In fact, the odds of a rally that is twice or three times X ticks before a sell-off of X ticks might even be 70 percent or higher. For example, if the trading range is 50 ticks tall and you bought above a bull reversal bar on a two-legged pullback to the bottom of the range, and the bar is eight ticks tall, there might be a 70 percent chance of the market rallying 20 or 30 ticks before hitting your stop 10 ticks below your entry. Likewise, near the top of the range, the directional probability of an equidistant move is less than in a trading range that followed a bear trend, and instead of a 70 percent to 80 percent chance of the market falling X ticks before rallying X ticks, those odds might be more like 60 percent. Again, no one can ever know the exact odds, but it is helpful to be aware of the bias because it should influence you when you are thinking about taking a trade. You should be more inclined to buy near the bottom of a trading range in a large bull market than you are to short at the top.
Neither the bulls nor the bears know the direction of the breakout, but both are comfortable trading within the range; and because of the tendency of bulls to buy less and bears to sell more at the top of the range and to do the opposite at the bottom, the market spends most of the time somewhere in the middle. This area of comfort has a magnetic pull, and whenever the market moves from it, the market gets drawn back into it. Even if there is a successful breakout that runs several bars, it usually will get pulled back into the range, and that is the basis for final flags, which are discussed in book 3. It is also common to see a breakout in one direction that runs for several bars, then a reversal, then a breakout in the opposite direction, and then a pullback into the range. The magnetic effect of a trading range can affect the market for several days, and it is common to see the market trend away from a strong trading range, like a relatively tight range that lasted 10 or more bars, only to come back into the range two or three days later.
What causes either the bulls or the bears in a trading range to change their perspective, eventually allowing a breakout to succeed? Rarely, there will be a news item like a Federal Open Market Committee (FOMC) report that is expected at a specific time in the middle of the day, but most of the time the breakout is unanticipated. There will always be a news-related reason for the breakout given on TV, but most of the time it probably is irrelevant to what is taking place. Once the market breaks out, CNBC will find some pundit who will confidently explain how it was the direct result of some news item. If instead the market broke out in the opposite direction, the pundit would then argue the opposite interpretation of the same news item. For example, if the market broke out to the upside on an FOMC interest rate cut, the pundit would argue that lower rates are good for the market. If it broke to the downside on the same rate cut, the pundit would argue that the rate cut is proof that the Federal Reserve thinks the economy is weak and therefore the market is overpriced. Both explanations are irrelevant and have nothing to do with what just took place. Nothing is ever that simple and, in any case, it is irrelevant to a trader. Most of the volume every day is generated by programs; there are dozens of big ones running before and during the breakout, and they are designed independently of one another by different firms that are each trying to take money from the others. The logic behind the programs is unknowable and therefore irrelevant. All that matters to traders is the net result. As a trader, you should follow the institutions, and if they are driving the market up, you should follow them and be a buyer. If they are driving the market down, you should follow them and be a seller.
Almost invariably, the breakout will be unfolding over the course of 10 or more bars before it finally succeeds, which might be an hour before the news was released. The market has already made up its mind about the direction of the breakout, no matter what the news will be, and if you can read the price action, you can often position yourself before the breakout occurs.
For example, if the bulls begin to become impatient because they thought that the market should have broken out of the upside by now, they will start to sell out of their longs. This will add to the selling pressure of the bears. Also, those bulls will likely want significantly lower prices before looking to buy again, and their absence of buying at the bottom of the range will remove buying pressure; the result will be that prices will fall down in a bear trend to a lower level where the bulls see value again, and another trading range will form. In an upside breakout, the opposite happens. Bears are no longer willing to short within the range and they will buy back their shorts, adding to the buying pressure of the bulls. They will look to short again only at a significantly higher price, which creates a thin area where the bulls move the market up quickly in a bull breakout. The market will continue to move up quickly in a bull trend until it reaches a level where the bears once again believe that there is value in shorting and the bulls start to take profits on their longs. Then, two-sided trading will resume and another trading range will form.
If the sideways price action has lasted for about 5 to 20 bars and is very tight, then a trader has to be particularly careful because the bulls and bears are in very tight balance. Trading breakouts in this situation can be costly since every brief up move is sold aggressively by the bears and the new bulls are quick to exit. This results in tails at the tops of the bars near the top of the range. Likewise, every sharp move down is quickly reversed, creating tails at the bottoms of the bars near the bottom of the range. There are, however, ways to profitably trade this type of market. Some firms and many traders are scaling into longs and out of shorts every few ticks lower and doing the opposite every few ticks higher. However, this is tedious and minimally profitable at best for individual traders, and they will find themselves too tired to trade well once a successful breakout finally occurs.
In general, all trading ranges are continuation patterns, meaning that they more often than not break out in the direction of the trend that preceded them. They also tend to break out away from the moving average. If they are below the moving average, they usually break to the downside, and if they are above it, they tend to break out to the upside. This is especially true if the trading range is adjacent to the moving average. If they are far from the moving average, they may be setting up a test back to the moving average. If a bull swing pauses in a trading range, the odds favor the ultimate breakout taking place to the upside. However, there may be several failed breakouts of the top and bottom before the final breakout, and sometimes the market breaks out countertrend. Also, the longer a trading range continues, the greater are the odds that it will become a reversal pattern (accumulation in a bear trading range, distribution in a bull trading range). This is because the with-trend traders will become concerned that they are failing to make the trend resume, and they will begin to cover their positions and will stop adding to them. Because of these uncertainties, traders need to be careful and look for low-risk price action setups. Trading ranges on a 5 minute chart that last for hours with many big, hard-to-read swings can be small, clean, and easy-to-read trading ranges on a 15 or 60 minute chart, so it sometimes is helpful to look at higher time frames. Many traders, in fact, trade higher time frame charts.
The chart on your screen is in a trading range most of the time, with the bulls and the bears in general agreement about value. Within the trading range, there are small trends; and within those trends, there are small trading ranges. When the market is trending, the bulls and the bears are also in agreement about value, and the agreement is that the value area is somewhere else. The market is moving quickly to a trading range where both bulls and bears feel there is value, and they will fight it out until it becomes clear that one side is right and the other is wrong, and then the market will trend again.
Some trading range days are composed of two or three large trending swings; during the swings, the market behaves like a strong trend. However, the first reversal usually does not begin until after the first hour or so, and a trend day is usually underway before then. When a trend starts too late, there is a good chance that the day will be a trading range day and that there will be at least a second reversal and a test of the middle of the range.
The middle third of the day, from around 8:30 a.m. until 10:30 a.m. PST, can be difficult for traders on days that are not clearly trending (in other words, most days). If the market is trading in the approximate middle of the day's range (or just the middle of a trading range within the day's range) and it is now in the middle of the day's trading hours, the chance of a tight trading range with overlapping bars, big tails, and multiple small reversals is significant, and most traders would be wise to trade sparingly. It is usually better to forgo any less than perfect entry under these circumstances and instead wait for a test of the high or low of the day. A trader who is not yet successful should not trade when the market is in the middle of the day while it is also in the middle of the day's range. This change to one's trading alone can mean the difference between being a loser and a winner.
Sometimes there will be an extremely great-looking pattern setting up midday in the Emini and you will get one tick of slippage on the entry. If the market does not race to your profit target within seconds, the chances are high that you have been trapped. In this case, it is almost always better to place a limit order to get out at breakeven. Whenever something looks too good to be true, so obvious that everyone will look to enter, the odds are high that it is exactly as it appears to be—not true.
Whenever there is a spike up and then a spike down, or vice versa, the market has formed a climax reversal, which is discussed in the third book. A spike is usually followed by a channel; but since there have been spikes in both directions, the bulls and bears will continue trading aggressively as they try to overpower each other and create a channel in their direction. This two-sided trading that usually takes place after a climax is a trading range, and it can be as brief as a single bar or can last for dozens of bars. The eventual breakout will usually lead to a measured move that approximates the height of the spike.
A trading range can sometimes appear to be a reversal setup but in fact be just a pause in the trend. For example, if there is a strong bull trend on the 60 minute chart and the 5 minute chart has a strong spike down that lasts several bars, which is followed by a pullback rally that lasts several bars and then a second spike down for several more bars, the pattern might look strongly bearish on the 5 minute chart, but it could be a simple high 2 or double bottom buy setup on the 60 minute chart. This is especially true if the ABC ends at the 60 minute moving average. You do not have to look at the 60 minute chart, but you should always be aware of the direction of the trend that preceded the trading range. This will give you more confidence to place the trade, which here is a large high 2 buy pattern and not the start of a new bear trend.
Sometimes the low of a bear trend day, especially a climactic one, can come from a small trading range that has large bars, often with large tails or large reversal bodies. These reversals are less common at tops, which tend to be less climactic than bottoms. These trading ranges are often other signals as well, such as double bottom pullbacks or double top bear flags.
Even though trading ranges are flags on higher time frame charts and usually break out in the direction of the trend, some break out in the opposite direction. In fact, most reversal patterns are some type of trading range. A head and shoulders pattern is an obvious one. A double top and a double bottom are also trading ranges. This is discussed further in the chapter on trend reversals in book 3, but it is important to realize that most trading ranges within trends break out in the direction of the trend and do not lead to reversals. Therefore, all reversal patterns are actually continuation patterns that occasionally fail to continue and instead reverse. Because of this, it is far better to look for with-trend entries when you see a reversal pattern than to look for reversal entries. This means that if there is a bull trend and it is forming a head and shoulders top, it is far better to look for a buy signal as the market tries to break out to the downside than it is to short on the breakout.
All trends contain trading ranges of different sizes and some trends are predominantly trading ranges, like trending trading range days, which were discussed earlier in book 1, Chapter 22. You should be aware that the market often tries to reverse the final trading range in the last hour or so, so if the day is a bear trending trading range day, look for a buy setup at the low of the day going into the final hour or two of the day.
Some experienced traders are good at knowing when a trend is evolving into a trading range, and they will scale into countertrend trades once they believe it is happening. For example, if the day is a bull trending trading range day and the breakout has reached the area of the measured move based on the height of the lower trading range, and if the rally has been in a relatively weak bull channel, bears will begin to short above prior swing highs. They will also watch for a relatively large bull trend bar and short its close or above its high, since it could be a buy climax and be the end or near the end of the bull channel and, therefore, near the top of a trading range. Only very experienced traders should attempt this, and most of those traders will trade small enough so that they can scale into their short positions if the market continues higher. If it does go higher and they scale in, some would take profits on their entire position once the market pulls back to their first entry. Others will exit the first entry at breakeven and hold the remainder for a test of the bottom of the channel. As the bull channel is progressing, beginners will see only a bull trend, but experienced traders will see the first leg of a developing trading range. Once the day is over and beginners look back, they will see the trading range and agree that it began at the bottom of the bull channel. However, as that bull channel progressed, beginners did not realize that the market was in both a bull channel and a trading range. As beginners, they should not be shorting in a bull trend, and should consider trading in a trading range only if there is a strong signal, preferably a second signal. The experienced traders who shorted were scalping because they saw the market as entering a trading range and not reversing into a bear trend. When the market is in a trading range, traders should generally only be scalping until the next trend begins, at which point they can once again swing part or all of their trades.
The single most difficult aspect of trading in a trading range is the trading range dilemma. Since most breakouts fail, your profit goals are limited, which means that you are scalping. However, when you reduce your reward yet keep your risk the same, you need a much higher probability of success to satisfy the trader's equation. Otherwise, you are trading a strategy that is guaranteed to eventually blow your account (i.e., drop it to below the minimum margin requirements for your broker to allow you to place trades). The dilemma is that you have to scalp, but scalping requires a very high probability of success, and that high degree of certainty cannot exist for long in a trading range, where by definition uncertainty prevails. If the range is particularly tight, the chance of success is even smaller. One way to improve your chance of success is to enter with limit orders as the market is going against you. For example, some traders will short above a weak-looking high 1 or high 2, or above a swing high or bull trend bar at the top of the range. They might also buy below a weak low 1 or low 2, or a swing low or bear trend bar at the bottom of the range. Another approach is to take a smaller initial position and scale in if the market goes against you.
If the range is large enough, most traders try to short small bear reversal bars at the top of the range and buy small bull reversal bars at the bottom of the range, especially when there are second entries, like shorting a low 2 at the top of the range or buying a high 2 at the bottom of the range. Remember, although both high 2 and low 2 setups are valid in trading ranges, traders trade them differently from when they form in trends. When there is a bull trend, traders will buy a high 2 near the top of a leg, but when there is a trading range, they will buy a high 2 only if it is at the bottom of the range. Similarly, bears will short a low 2 at the bottom of a bear trend but they will short a low 2 in a trading range only when it is at the top of the range.
Since a trading range is simply a horizontal channel, you trade it like any other channel. If the swings are small, you scalp; if they are large, you can scalp or swing some of your position to the opposite end. If the trading range is very large and has lasted several days, entire days can be strong trends and still be within the trading range. When that happens, trade the day like any other trend day. If the swings are very small, the trading range is a tight trading range, which is discussed Chapter 22. The tighter the range, the fewer trades you should take. When the range is a tight trading range, you should rarely take any trades.
When the market is in a trading range, look to buy near the bottom of the range and short near the top. In general, if the market has been going down for about 5 to 10 bars, only look to buy, especially if the market is near the bottom of the range. If the market has been going up for five to 10 bars, only look to short, especially if it is near the top of the range. Trade in the middle of the range only if the swings are large enough to make a profit. For example, if the trading range is 10 ticks tall, you do not want to buy six ticks above the low of the range, since the odds of the market going six ticks further up are not great and that is what you would need to make a four-tick profit. If the trading range is six points tall, you can buy a higher low and enter in the middle of the range since there is room above to make a scalper's profit before the market encounters the resistance of the top of the range. The chapter on channels in book 1 discusses how to trade them, and since a trading range is simply a horizontal channel, the techniques are the same.
Most of the bars will be in the middle of the range, and the market spends very little time at the extremes. When it is at the extremes, it usually got there with a strong trend bar, making many traders believe that the breakout will be successful and strong. There will often be three or more large, overlapping bars with a signal bar forcing bulls to buy near the high tick, and this usually is a trap. For example, suppose the market just raced to the bottom of the range with a couple of strong bear trend bars but has been sideways for a couple of bars, sitting just below the moving average; now there is a strong bear reversal bar, but it mostly overlaps the prior bars, and the entry price would be within a tick or so of the bottom of the bear flag. In this situation, don't take the trade. This is usually a bear trap, and it is much better to place a limit order to buy at the low of that bear reversal bar than to place a stop order to go short at one tick below its low. Take this fade only if you are experienced with your read.
The best entries are second entries at the top or bottom of the range where the signal bar is a reversal bar in your direction that is not too large and does not overlap the prior bar too much. However, the appearance of the signal bar is less important for trading range reversals than for trend reversals. Short setups at the top of the range often have signal bars with bull bodies, and buy setups near the bottom of the range often have bear bodies. A strong reversal bar is not usually mandatory unless a trader is looking to take a reversal trade in a strong trend.
Most traders will lose money if they scalp, even if they win on 60 percent of their trades. This is especially true if their risk is about twice as large as their potential reward. This means that traders have to be very careful with trading range trades. Given that 80 percent of breakout attempts fail, a trading range trader has to have limited goals, and many of the best trades will be big scalps or small swings. For example, if the average daily range in the Emini has recently been approximately 10 to 15 points, the average protective stop will be about two points. If traders are shorting below a strong bear signal at the top of a trading range that is at least six points tall, especially if they are taking a second signal, they have at least a 60 percent chance of making two points while risking two points. This results in a minimally profitable trader's equation and is therefore a successful strategy. If it appears that the move could fall four points, traders might take a quarter to half off at two points and try to swing the remainder for about four points. They might move the stop to breakeven after taking two-point partial profits, or they could tighten it from two points to maybe one point (four ticks) or five ticks. At that point, they are risking five ticks to make four points, and even if the chance of success is only 40 percent, they have a winning trader's equation. Some traders who took partial or full profits at two points will place limit orders to short again at their original entry price, but risk only about five ticks this time. They might try for two to four points on their trade, depending on the overall market. If the entry bar or the following bar becomes a strong bear bar, they will be inclined to hold for a larger move.
If the trading range is only three or sometimes even four points tall, entering on stops is usually a losing strategy. The trading range is then a relatively tight trading range, which is discussed later, and only very experienced traders should trade it. Most of the trades require limit order entries, and beginners should never buy when the market is falling or sell when it is rallying, because they invariably will choose situations in which the move will go so far that they will become frightened and exit with a loss.
Regardless of how tall the range is, if you are looking to trade and the leg that is testing the top or bottom of the range is a tight channel, it is better to wait for a breakout pullback, which is a second entry. So if the market has been going up for 10 bars and is near the top of the trading range, but these 10 bars are in a micro channel, do not short below the low of the prior bar—the upward momentum is too strong. Instead, wait to see if there is a pullback from this micro channel breakout. The pullback can be any test of the top of the channel, including a lower high, double top, or a higher high. Then look to short below the low of the prior bar and place a protective stop above the high of the signal bar. The setup is more reliable if that signal bar is a good bear reversal bar, especially if it is not too large. If it is too large, it will likely overlap one or more bars too much and will have you shorting too far below the high of the range. When this happens, it is usually better to wait for a pullback before shorting.
Any short setup is also more reliable if there is other evidence of strong bears entering the market within the prior 10 bars, like two or three bars around this level with large tails on top, or several recent bars with strong bear bodies. This represents building selling pressure and increases the chances that the trade will be successful. Similarly, if you are looking to buy at the bottom of the range and there are a few bars at this level with large tails on the bottom or several bars with bull bodies, then the bulls are becoming aggressive, and this buying pressure increases the chances of a profitable long trade. If there is support or resistance like a dueling lines pattern near your entry, the odds of a successful trade increase.
Trading ranges always look like they are breaking out, but the majority of breakout attempts fail. The extremes are often tested by large trend bars, and, if you are an experienced trader, you can fade the close of one of these bars. Although it is safer to wait for the breakout to fail before entering (breakouts and failures were discussed in Part I), if you are confident that the trend bar is just running stops beyond a swing high or low, you can enter of the close on the bar, especially if you can scale in if the market goes against you. For example, if the market has been in a quiet trading range for the past three hours and just formed a two-legged move down below a prior swing low, and the close was on the low of the bar, you can consider buying at the market on the close of the bar. If most of the up legs have had more momentum than the down legs, the odds are better, and they are better still if the trend bar is testing a trend line, a trend channel line, a measured move target, or other support level.
Since not all of the swings reach the extreme of the range, you can consider scaling into a trade. For example, if the market has been going up for eight bars and is forming a low 3 below the top of the trading range, you can consider shorting the low 3 setup and using a wide stop of maybe four points in the Emini on a day when the average range has been about 10 points. If the low 3 succeeds and you have a profitable trade, you exit. If the low 3 fails, it is likely that there will soon be a low 4 and that it will be successful. If so, you can scale into the trade by shorting a fixed number of ticks above your entry, or above the high of a prior bar or swing high, or on a stop on the low 4 signal. You can then exit both short positions near the bottom of the range or maybe at the entry price of the first short. This entry would then be a breakeven trade and the second, higher entry would be profitable. Scaling in and out of trades is discussed in Chapter 31.
Because trading ranges are two-sided, pullbacks are common. If you take a trade in a trading range, you have to be willing to sit through a pullback. However, if the trading range might be turning into a trend, you should exit if the market goes against you and wait for a second signal. Your odds of success are greater if you have the ability to scale in as the market goes against you.
If the market is at the bottom of the range and the downward momentum is weak and the market reverses up for a bar or two, it might be setting up a low 1 short. Since you should short a low 1 setup only in the spike phase of a bear trend and not in a trading range, it is unlikely that this low 1 would be profitable. You then believe that the odds are that a short below the low of the prior bar would go up eight ticks before it falls six ticks. That means that it makes sense to place a limit order to buy at or a couple of ticks below the low of the prior bar, expecting a failed low 1 short and a higher low. Also, if you believe that the market is forming a bull channel, you expect the low 2 to fail as well, and you therefore can place a limit order to buy at or below the low of the low 2 signal bar. You can do the opposite near the top of the range as the market is turning down and forming low-probability high 1 and high 2 buy setups. Place a limit order to short at or just above the high of the high 1 or high 2 signal bar.
Since the legs in a trading range often subdivide into two smaller legs, you can fade the breakout of the prior leg. Buying a breakout above a swing high usually yields a profitable trade only in a strong bull trend, and shorting below a swing low is usually profitable only in a strong bear trend. If the market just pulled back from the first leg down in a trading range, the odds of a successful short trade where you enter on the breakout of the bottom of that first leg are small. Instead, you can consider placing a limit order to buy a few ticks below that low for a scalp up.
Because most breakout attempts fail, never overstay any trade hoping for a successful breakout. Look to exit longs on scalp profit targets or on tests of the top of the range, and take profits on shorts on limit orders that give a scalper's profit or exit on a test of the bottom of the range. Never rely on martingale trading. This is discussed in Chapter 25, but it is a gambling technique where you double or triple the size of your next trade if you just lost on your prior trade. If you keep losing, you keep doubling or tripling the size of your prior trade until you win. Almost invariably when you are thinking about this, the market is in a tight trading range and will likely have four or more consecutive losers; you would therefore abandon the approach because it would require you to trade far more contracts than you can handle emotionally, and this will leave you with a huge loss. A breakout or a winning trade is never overdue, and the market can sustain unsustainable behavior much longer than you can sustain your account. Be fussy and take only reasonable entries, and never base any entry on the idea that the market is overdue for a good trade.
Figure PIV.1 Most of the Bars on Any Chart Are within Trading Ranges
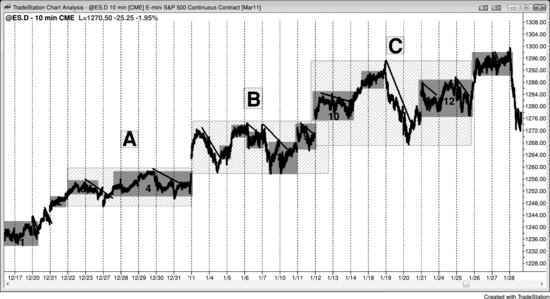
The market is composed of trading ranges separated by brief trends, and each trading range is made up of smaller trends and trading ranges. Figure PIV.1 is a 10 minute chart of the Emini that shows about six weeks of price action. If a trader were watching only a 5 minute chart with about a day and a half of data, it would be easy to overlook the big picture. Some of the days were small trading range days, but those days were in the context of a large bull market. The large trading ranges are labeled with letters and the small trading ranges with numbers (the numbers refer to the trading ranges and not the bars). Although trading ranges repeatedly try to break out of the top and bottom and 80 percent of those attempts fail, when the breakout does come, it is usually in the same direction as the trend that preceded it. Most reversal patterns are trading ranges, like the rightmost trading range (13), but most reversal attempts turn into flags and break out in the direction of the trend.
While the market is in a trading range, traders can take trades in both directions, looking for small profits on each trade, but when there is a strong buy setup at the bottom of a trading range in a bull trend, a trader can swing part or all of the trade. For example, within the large B trading range, there were three pushes down, creating a triangle, and each push down tested the top of the large A trading range. The small 8 trading range also had a double bottom, and it was a bull flag down from the 6 trading range. A day trader might have swung a long into the close of the day, but traders willing to hold a position overnight saw that this was a good buy setup for a trade that could last several days.
Notice how the final leg down of most trading ranges is a bear channel, which is a last-ditch attempt by the bears to create a top and a new bear trend. A bear channel is a bull flag. Bulls can buy the reversal up from the bottom of the trading range or on the breakout pullback that usually follows soon afterward. The opposite is true of trading ranges in bear trends, where the final leg is usually a bull channel, which is a bear flag.
Figure PIV.2 Multiple Early Reversals Often Lead to a Trading Range Day
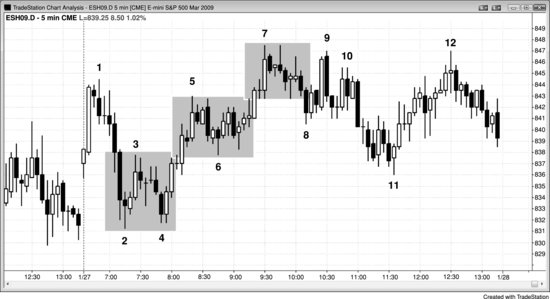
Multiple reversals in the first couple of hours usually result in a trading range day. Big traders often come into the day expecting a trading range day, and when enough do, their scalping and reversing often result in one forming. As shown in Figure PIV.2, today broke out but then reversed down at bar 1 and reversed up at bar 2. The reversal failed at bar 3, but the attempt at a bear channel failed at bar 4, and the market reversed up again. The bull spike up to bar 5 had two pauses along the way, indicating hesitancy. After the spike up, the market went sideways for about 10 bars and had many small reversals within the bull flag, as well as five bear bodies, again showing that the market was very two-sided, which is the hallmark of a trading range. Bar 7 was a bull trend bar to a new high of the day, but was immediately followed by a bear inside bar instead of two or three more bull trend bars. The market then had several large dojis; two of them had big tails on the top, showing that traders aggressively sold into the close of the bars (selling pressure). This shows that the bears were very strong at the high of the day, which is what commonly happens in a trading range. The directional probability of an equidistant move rose in favor of the bears. In this case, the odds of a two-point move down before a two-point move up might have been 60 percent. Although it is impossible to know exactly, traders believed that the shorts had the edge. Most traders suspected at this point that the day was a trading range day and the odds of a move down below the middle of the range were good. If traders shorted at any point after bar 7 and risked about two to three points, they probably had about a 60 percent chance of the market testing below the midpoint of the day, which was five to eight points lower, depending on where they shorted. Risking two points to make five points with 60 percent certainty is a great trade.
The middle of the day on a trading range day is a magnet and usually gets tested repeatedly during the day, including after the breakout to a new high. Also, since trading range days usually close in the middle of the day's range, look to fade tests of the extremes, like at bars 7, 9, 10, and 12. Traders were shorting above swing highs, like above bars 1, 3, and 5, and they were adding on, maybe at one or two points higher. If they added on, many traders would have exited some or all of their positions when the market returned to the original entry price. This would be a breakeven trade, but they would have a profit on their higher entries. If the market immediately went their way, they would scalp out of most or all of their positions because on trading range days it is better to scalp unless you are shorting at the very top or bottom of the day, where you can swing part of your position for a test of the middle of the day or even a test of the opposite extreme. Bulls bought below bars 6 and 8, and many were willing to scale in lower.
In general, doing the opposite of what you would do on a trend day is effective, especially if you can scale in. Once traders believe that the day is a trading range day, they will place trades based on that belief. Instead of looking to buy a high 1 or high 2 near the high, it is better to short above those signal bars. Instead of looking to short a low 1 or low 2 near the bottom of the range, it is better to buy below those bars. Traders enter on limit and market orders. Some look at a smaller time frame chart, wait for a reversal bar, and then enter on stops on the reversal. Traders will be scalping all day, expecting just about every move to not go far before reversing again. They will short above the high of prior bars and add on higher, and they will buy below the low of prior bars and add on lower. They will also fade large trend bars near the top and bottom of the developing range. The bulls saw the large bull trend bar that formed two bars before bar 1 as a brief opportunity to take profits at a high price. The bears also doubted there would be follow-through buying and shorted. Both the bulls and the bears sold at the close of the big bull trend bar, above its high, on the close of the two bear bars that followed, and below the low of the bear bars.
Once the market formed a large bear trend bar before bar 2 that tested below the day's low and near the low of yesterday, both the bulls and the bears started buying. The bears were buying back their shorts, and the bulls were initiating new longs. Both bought on the close of the bar and below its low. Bar 2 had a large tail on the bottom, showing that traders were eager to buy. The next bar had a bull close, and they bought that close and above its high. Traders sold on the close of the bar 7 breakout to a new high, even though it was a bull trend bar. They were confident that the day was a trading range day, so they waited to short until the market went above the opening high. As the market was going up, they believed that a new high of the day was likely, and since they thought the market would go a little higher, it did not make sense for them to short when they could do so at an even better price a few minutes later. This absence of the strongest sellers created a vacuum that sucked the market up quickly. Since they were confident that the new high would fail, they were very happy to sell on the close of a strong bull trend bar. The bulls were selling out of their longs to take profits, and the bears were selling to initiate new shorts. Both wanted to sell when the market was at maximum strength, since they believed that it should head down. Traders sold on the close of the bear inside bar that followed bar 7 and below its low. The next bar was a small doji bar, which was a weak high 1 buy setup, and many traders sold above its high, expecting it to fail. They also sold below the low of the high 1 entry bar, since it was then a one-bar lower high. Two bars later, they saw the doji signal bar for the high 2 buy setup as a weak signal, and sold above its high. Once the high 2 entry bar closed near its low, they sold below its low, since this was a failed high 2 sell signal.
The strong bull trend bar was a high 4 entry bar, but it was also a big bull trend bar near the high of a trading range day. The bull scalpers sold out of their longs, and the bears shorted on the close of the bar and below the bar 9 lower high two-bar reversal (this made the move down to bar 8 a final flag).
Once the market fell to the middle of the range, and especially after it broke below the bar 6 swing low, the bulls thought the breakout would fail. Most breakouts fail in general, and this is especially true on trading range days, and in the middle of the day and in the middle of the range. Traders started buying the bear closes and the pushes below the lows of the prior bars. By bar 11, the consensus was clear and the market created a bull reversal bar, signifying urgency to the upside. There was no one left who was willing to short down there, so the market had to go up to find a price that the bears once again believed offered value for shorting. This price is where they aggressively shorted earlier in the day, and their renewed selling created the double top at bar 12.
Bar 12 had a bull body, which is a bad signal bar for a reversal trade, but in a trading range (or at the end of a bear rally in a bear trend), signal bars are often not strong, but are still acceptable. At least it had a tail at the top, a small bull body, and a close in the middle.
Figure PIV.3 Swing Trades in Trading Ranges
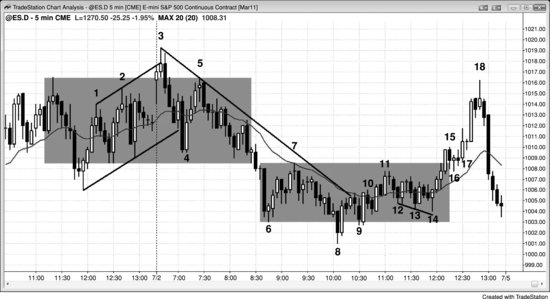
In Figure PIV.3, there are two trading ranges where traders could have swung part of their position for a possible breakout into a trend. In the upper range, traders could have shorted below the low of bar 3, which was the signal bar for the wedge reversal of the high of yesterday. Since the move down to bar 4 broke below the bull trend line, the market might then form a lower high and then a reversal into a bear trend. This allowed traders to short again below the low of bar 5, well before the breakout below the bottom of the trading range.
The market then formed a lower trading range. The bar 11 rally to the top of the range broke the bear trend line, so traders should be looking for a lower low or higher low and then a possible trend reversal up. The market formed a wedge bull flag at the bar 14 higher low, and bar 14 was a strong bull reversal bar. This allowed bulls to buy several bars before the breakout actually took place. There were high 1 breakout pullback long setups at bars 16 and 17.
In general, the stronger the trend, the more important the signal bar is for a reversal trade. Trading range signal bars are often less than perfect. Acceptable short setups can have signal bars with bull bodies. Likewise, acceptable long setups can have signal bars with bear bodies. Examples include bars 3, 5, and 7, the bar after bar 11, and bar 18.
Experienced traders saw the breakout down to bar 6 as a likely evolution of a trading range day into a trending trading range day. Aggressive bulls bought the close of bar 8, since it was a large bear trend bar in the area of a measured move down in what they thought was likely a developing lower trading range. Other bulls bought as bar 8 fell below the low of bar 6, and others bought at a fixed number of ticks below bar 6. Some bought at one point below and tried to buy more at two, three, or even four points below. Some thought that the breakout might be a five-tick failed breakout and used that as their reason to buy four ticks below. A few traders sold the breakout below bar 6 and reversed to long at their scalper's profit target, one point below their entry price. Others bought on bar 8 as it fell through the trend channel line (not shown) created by yesterday's low and bar 6, or after the market bounced a few ticks up from the bar 8 low after falling below the trend channel line. Since these bulls believed that the market was evolving into a trending trading range day and was forming the lower trading range, they were in scalping mode, as most traders are when the market is in a trading range. The swings today were relatively large, so many bulls were scalping for three or four points instead of just one or two. They needed to be adequately rewarded for taking relatively risky (lower-probability) trades, where the risk was large (the bulls who were scaling in were probably risking four to six points). Since experienced traders believed that the market was in a trading range, bear scalpers were shorting rallies near the top of the developing trading range, like around bar 7 or bar 11. Since bar 14 was a possible start of a test back into the upper range and was followed by several bull trend bars, most bears would have stopped looking to short at that point.
Figure PIV.4 Middle Third of the Range and of the Day
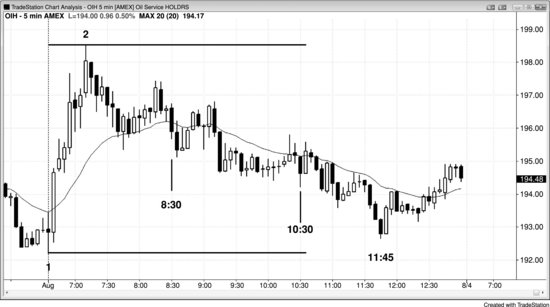
When the day is not a clear trend day, traders should be very careful during the middle third of the day when the market is around the middle third of the day's range. In Figure PIV.4, there are lots of overlapping bars, small dojis, and tiny failed breakouts, making the price action difficult to read. This is a barbwire type of tight trading range and is discussed more in Chapter 22. With experience, a trader can be successful trading under these circumstances, but the vast majority of traders would more likely give back most or all of the profit that they made in the first couple of hours. The goal is to make money, and sometimes your account is much better served by not placing trades and instead waiting for strong setups. In the chart, the sideways action lasted until 11:45 a.m. PST, which is relatively late in the day. The time parameters are only guidelines. The overriding factor is the price action, and on trading range days the best trades are fades of the highs and lows of the day, but this takes patience.
Figure PIV.5 Spike Up and Then Down Usually Leads to a Trading Range
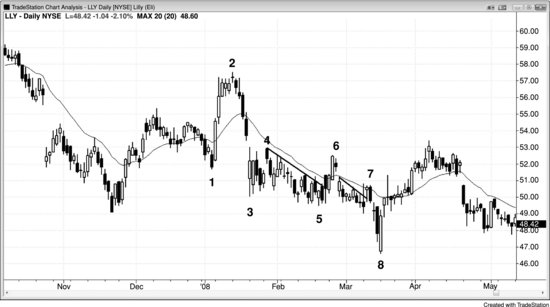
Whenever the market has a spike up and then a spike down, or vice versa, it tends to enter a trading range as the bulls and bears both fight to create follow-through in their direction. In Figure PIV.5, Eli Lilly (LLY)'s daily chart shows a sharp up move that ended at bar 2 and was followed by a sharp down move. There was no clear buy pattern; instead there was a low 2 breakout pullback entry at bar 4. Bars 6 and 7 were short signal bars following brief bear trend line breaks (bar 6 was a first moving average gap bar). The bar 8 low of this spike and channel bear trend was not quite a measured move, and was followed by a test of the bar 4 start of the bear channel.
A sharp move up and then down, like the move up to bar 2 and then down, is a climactic reversal and a two-bar reversal on some higher time frame chart. It is a single reversal bar on an even higher time frame chart. Bar 8 was a sell climax and a two-bar reversal, and the move would be a single reversal bar on some higher time frame chart. It was followed by a trading range, which grew into a bull channel.
Figure PIV.6 Pullbacks Can Grow into Trading Ranges
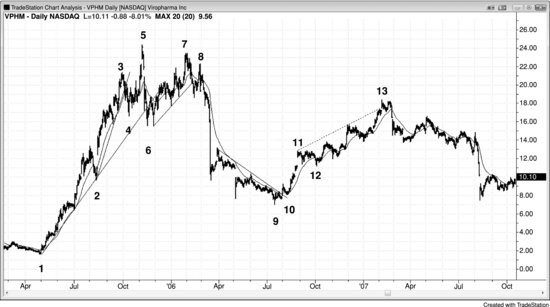
Strong trends are followed by pullbacks that can grow into trading ranges and sometimes reversals, as shown in Figure PIV.6. Here, the daily chart of ViroPharma Inc. (VPHM) had a strong bull trend followed by a strong bear trend, and the entire chart evolved into a large trading range. A big move up followed by a big move down is a buy climax and is usually followed in turn by a trading range as the bulls and the bears continue to trade, both trying to generate follow-through in their direction.
At some point after the bar 1 bottom, the momentum traders controlled the market and drove it much higher than the fundamentals warranted. There was then a sharp move down to bar 9, where there was a three-push pattern (a wedge variant) that resulted in the spike and channel up to bar 13, effectively creating a large trading range. Bar 13 was an overshoot of the trend channel line, and the attempted breakout above the channel failed. Spike and channel bull trends, no matter how strong they appear, are usually followed by a test of the beginning of the channel, which was the bar 12 low.
Bar 10 was a breakout pullback higher low second chance to get long.
After many momentum players dumped their longs on the rally up from the bar 4 trend line break, the bulls were able to drive the market to a new high at bar 5, but this area found aggressive sellers who were able to break the major bull trend line as they pushed the market down to the bar 6 low, setting up a large reversal down from the bar 7 lower high test of the bar 5 trend high. The reversal down came off of the three pushes up to bar 7. At this point, the momentum players were out and looking for another stock. The rally up to bar 7 had several swings, indicating two-sided trading and therefore less momentum than in the prior rallies and in the sell-off down to bar 6. It became the pullback that led to the bear channel that followed the spike down to bar 6.
The market continued to sell off until value traders thought that the fundamentals were strong enough to make the stock a bargain around bar 9. Bar 9 was also a three-push-down buy. It could also have been near some Fibonacci retracement level, but that is irrelevant. You can just look and see that the pullback was deep, but not so deep that the force of the rally from bar 1 was totally erased. The bulls still had enough force left to rally the stock, especially since the value traders were back in play. They felt that the stock was cheap based on fundamentals, and their intention was to keep buying as the stock continued to drop (unless it dropped too far).
The final leg down in a trading range in a bull market is often a bear channel, as it was here. Some traders saw the entire move from bar 3 to bar 9 as a wedge bull flag, which is a bear channel. Others saw the bear channel as starting at bar 5, bar 7, or after the large bear spike that followed bar 8. That bear spike led to three pushes down and a wedge bear channel. Traders bought above bar 9 and on the breakout pullbacks at bars 10 and 12.
Figure PIV.7 A Trading Range Can Be a Reversal Setup

A trading range can be a reversal setup, especially when there are tails at the bottoms of the bars and two-bar reversals, which are reversal bars on a higher time frame chart. As shown in Figure PIV.7, yesterday had a bear spike and then the remainder of the day was a low-momentum bull channel. All bull channels are bear flags, and this one broke out to the downside on today's open. However, the market made three attempts (bars 8, 9, and 12) to break below yesterday's low and found buyers instead of sellers each time. The small trading range from bar 9 to bar 12 led to a reversal up instead of a downside breakout. The failed low 2 at bar 12 was the setup for today's strong bull trend.
Although a trader only needs to look at one chart to trade successfully, it is usually helpful to be aware of the big picture. The market was in a large trading range for four days, as shown in the inset of the 15 minute chart. The numbering is the same, but the 15 minute chart began before and ended after the 5 minute chart and has some additional numbers. Since there was a bull trend before the four-day trading range formed, traders were looking for an upside breakout. The final leg of a trading range in a bull market is often a bear channel, which is the last attempt by the bears to reverse the market down. Most reversal patterns are trading ranges, but most fail, like this one did. There were several possible choices for the start of the channel (bars 6, 7, and 8), and different traders saw each as the most important. However, they all agreed that bars 10 and 12 were reasonable buy setups. Bar 10 was a second attempt to reverse up after breaking below yesterday's low, and bar 12 was a breakout pullback from the bar 11 break above the bear trend line, as well as a higher low. The strong bull trend bars were signs of buying pressure, which is always good to see when looking to buy.
Deeper Discussion of This Chart
As shown in Figure PIV.7, yesterday's bull channel from bar 5 to bar 6 broke the bear trend line, and today's lower low was therefore a possible trend reversal.
Yesterday's bear flag became the final flag in the bear trend (but the bear trend was in a large four-day trading range in a bull market). Whenever there is a relatively horizontal bear flag, or a sloping one that is in a tight channel, it will have a magnetic pull on the market, and this often prevents breakouts from going very far. The tight trading range is an area of comfort for both bulls and bears, and both see the price level as an area of value. Traders were aware of this and were looking for signs of a reversal up after the breakout. The failed low 2 at bar 12 was also a double bottom pullback buy setup. Other traders saw it as a triple bottom or a triangle reversal. Most reversal patterns have multiple interpretations, and different traders prefer to describe them in their own particular way. It does not matter what you call it, because all that matters is that you were aware of the possible reversal and looked for some reason to get long.
Figure PIV.8 Buy Climax, Then Trading Range
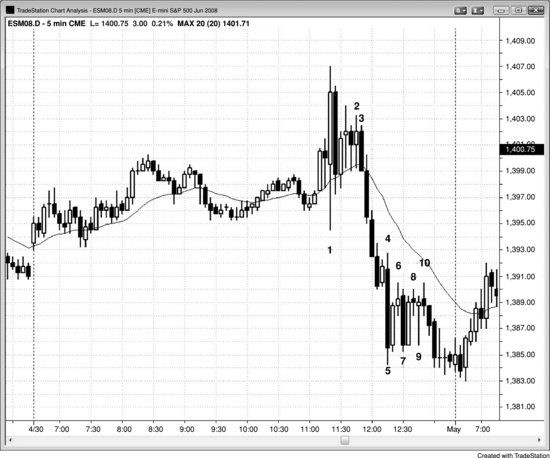
The FOMC report was released at 11:15 a.m. PST, and the 5 minute Emini formed a large bull outside bar at bar 1 in Figure PIV.8, but its high was never exceeded. It was followed by a large bear trend bar, setting up a buy climax, which is usually followed by a trading range. The trading range can be as short as a single bar or can last for dozens of bars. It did not take long for the bears to overwhelm the bulls and create a four-bar bear spike. Even though reports can be volatile, the price action is reliable; so don't get caught in the emotion, and just look for sensible entries.
Bar 5 began a trading range that had large two-bar reversals and tall dojis. Whenever a trading range forms with multiple large reversals at an extreme of the day, it is usually better to look for a reversal entry than a with-trend setup. The big, overlapping bars and tails indicated two-sided trading, and when there is strong two-sided trading, it is not prudent to be buying at the high of the day or selling at the low. The tight trading range that began at bar 5 was composed of large bars, bars with tails at the bottom, and two-bar reversals, all indicating that the bulls were willing to become aggressive. This was an area of strong two-sided trading and therefore an area where both the bulls and the bears felt there was value. Therefore, if the price drifted down in a downside breakout, the buyers would see the lower prices as an even better value and they would buy aggressively. The bears saw value in the range and were less willing to short below it. The relative absence of bears and the increased buying by the bulls usually causes breakouts to fail; the market generally rallies back into the magnetic area, and sometimes the market reverses.
All spikes are also breakouts and climaxes. The four-bar bear spike that began with bar 3 had shrinking bodies, indicating waning momentum. The sell climax was followed by a one-bar pause and then another large bear trend bar at bar 4, which created consecutive sell climaxes. When the emotional sellers have sold twice in a short period of time, there are usually very few traders left who are willing to sell at the low prices, and a bottom is often near. There was a third sell climax into the close and then a rally on the open the next day.
Deeper Discussion of This Chart
Bar 2 in Figure PIV.8 was a high 2 long entry bar but there was a problem with this setup. Whenever there are three or more bars that almost completely overlap and they are just above the moving average and there is a buy signal where the entry would be close to the top of this trading range, the odds favor it being a bear trap. If you took any trade, it made more sense to short above the high of the prior bar because this was a small, tight trading range, and most trading range breakouts fail. Yes, it was a high 2, but one that should never be bought.
Bar 3 was a failed high 2, so there were trapped bulls at the high of the day. It was also a strong bear trend bar, setting up a good short entry. Since the market was in a trading range at this point, those two small pushes up made bar 3 a low 2 short setup. Since it was near the high of the day, it was a good place to be looking for shorts. Finally, it was a double top bear flag after a large bear trend bar, and a climactic reversal.
Bar 6 was a low 1 short setup, but it followed consecutive sell climaxes, and the risk that the market would form a two-legged sideways to up correction was significant. The odds favored a higher low and a second corrective leg, but the bars were large enough to provide room for a short scalp, despite the likely higher low.
Bar 7 was the first bar of a two-bar reversal, and it was better to buy above the higher of the two bars and not simply above the bull bar. This was an example of how overly eager bulls get trapped. Since the market at this point had several big sideways bars, it was in a trading range and it was better to look for shorts near the top of the range and not to buy. Buy low, sell high is the best way to trade trading ranges.
Bar 8 trapped bulls into a bad high 2 long, and they would exit on the low 2 short below bar 8. The signal bar was small enough so that there was room for a short scalp, but after a pair of two-bar reversals and with a doji signal bar, this was a risky short.
Bar 10 was another bull trap that was bought by weak bulls at the top of a big, tempting doji. Again, smart bears would have looked for a small setup bar for a short entry because the bulls would have been forced to sell and there would have been no buyers left, making the market quickly reach the short scalp profit target. Since this was the third push up, it should have been expected to function like a wedge top, and it was followed by a bear leg into the close. Since this was a trading range, there was nothing for reversal patterns to reverse, and buying above tall bars near the top of the range was likely to result in trapped bulls. Smart bears were still shorting above the high of the prior bar and below the lows of small bars near the top of the range.
This trading range became a final flag that reversed up on the open of the next day with a high 2 entry on the third bar of the day. In fact, you can view the entire day up to the report as a final flag. The market broke to the upside just before the report and then sold off on bar 1 on the report, and once again tried to break to the upside from the trading range. When the market tries something twice and fails both times, it usually then tries the opposite. This made a downside breakout likely after the bar 1 buy climax.
The large bear trend bars that followed bar 10 created the third consecutive sell climax, which had a high probability of being followed by at least a two-legged rally, but sometimes instead there is just a two-legged sideways correction.
Figure PIV.9 Trading Ranges Leading to Reversals
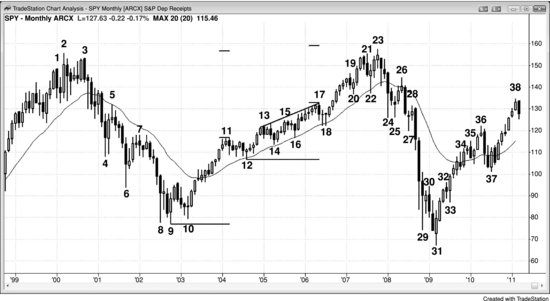
Sometimes a trading range can lead to a trend reversal instead of a continuation, as it did four times on the monthly SPY chart shown in Figure PIV.9. Reversal patterns are discussed more fully in book 3. The purpose of this chart is to demonstrate that trading ranges can be reversal patterns.
Bars 4, 6, and 8 or 9 were three pushes down, and the low 2 short setup that formed two bars after bar 9 led to a higher low instead of a new low. Bars 4, 6, and 8 were all large bear trend bars, and they therefore formed three consecutive sell climaxes. That means that on all three bars, traders were aggressively selling at any price instead of on pullbacks. These were traders who were desperate to sell. Although they were mostly longs who were finally giving up, some of them were late, weak bears who had decided that there were not going to be any significant pullbacks. They were upset that they had missed so much of the bear trend, and they were determined not to miss any more, so they shorted at the market and on small pullbacks. Once these emotional bears shorted and the emotional bulls gave up and sold, there were very few traders left who were willing to sell at the bottom of the bear trend. After three sell climaxes, traders would have shorted only if there was a significant rally that had a good short setup. They got the rally, but they did not get a short setup until the move up went on for so long that it became a new bull trend that lasted five years.
Bar 8 and the bar after it both had large tails on their lows. Bar 9 was a bull reversal bar that was the second bar of a two-bar reversal, which was a reversal bar with a tail on the bottom on a higher time frame chart. Bar 10 and the bar before it also had prominent tails at their lows. This meant that bulls were buying going into the close of all of these bars and they were overwhelming the bears at this price level. The bulls thought this area was a great value for longs, and the bears thought it was too low to short aggressively. Some traders saw bars 8, 9, and 10 as a triple bottom, and others saw it as a head and shoulders bottom. Others thought that bars 8 and 9 formed a double bottom and bar 10 was a successful test of the low, and some saw the move above bar 9 as a breakout and then the move down to bar 10 as a higher low breakout pullback. It never matters what words you use to describe what is going on as long as you see that the market is telling you that the bulls are taking control. After three sell climaxes and such a long bear trend, the odds favored at least a two-legged pullback to the moving average and possibly to the beginning of the channels at bars 5 and 7. The entire move down from bar 2 was in a channel, and a bear channel is a bull flag. Channels often reverse after the third push down, so smart traders knew that this trading range from bar 8 to bar 10 might have been a reversal instead of a bear flag.
The push up from bar 20 and the move down to bar 22 comprised a buy climax, despite the bull close of bar 22. Once the market reversed down from the double top at bar 23, the bears were hoping that bar 23 was a higher high pullback after the bear spike down to bar 22, and they kept shorting as they tried to create a channel or spike down. The bulls kept buying and were hoping for a trading range and then another leg up. The bar 24 bear spike was convincing enough so that most traders thought that lower prices were more likely than higher prices over the next several bars.
The bulls tried again to create a bottom at bars 24, 25, and 27, but this was right after a reversal down from a spike and channel top, which was likely to have two legs down and test the bar 12 bottom of the channel. Also, bar 24 was the spike down that turned the market into a probable bear swing. There was likely to be follow-through in the form of some type of bear channel because the bar 24 breakout below the bar 22 neckline of the double top was so strong. Bar 25 was relatively small compared to the down bars and had a bear body. There was another spike down to bar 27, which made the downward momentum too strong to be buying above bar 27, especially since bar 27 was only a small doji bar and not a strong bull reversal bar. With the momentum down being so strong, buyers would not have been willing to buy above a lower low, but they might have been willing to buy above a strong higher low had one formed. The buyers gave up two bars later, and the market collapsed in sell climaxes down to bar 29 and bar 31.
The bar before bar 29, and bars 29 and 31, had large tails at the bottoms, again showing that the buyers were aggressively buying into the close of each bar. This was a small three-push-down pattern (this was clear on the daily chart), and the spike down from bar 30 was a sell climax after a huge sell climax down to bar 29. Consecutive sell climaxes usually lead to a pullback, at least to the moving average, lasting at least 10 bars and having at least two legs, and sometimes they can lead to a trend reversal. This buying was coming in just below the price level where the bulls bought aggressively at the bottom of bars 8, 9, and 10. The market was trying to reverse up from the breakout below that swing low, which is something that is common in trading ranges. In fact, the entire chart was a large trading range, despite the several strong trends that lasted as long as five years. Since most breakout attempts fail, buying should have been expected when the market fell below the bar 9 low.
Deeper Discussion of This Chart
As shown in Figure PIV.9, traders began to flip to always-in short as the market fell below the bars 1, 2, 3 head and shoulders top. Some started shorting below the bar 3 bear trend bar and two-bar reversal that formed the lower high. Others shorted for a variety of reasons as the spike grew down to bar 4. Even though bar 5 was a bull reversal bar and a breakout above a two-bar reversal, it was the first attempt to break out above the tight bear channel down from bar 3 and therefore was likely to fail. The bulls needed more strength in the form of several bull trend bars before they would become aggressive. The bears saw bar 5 as a micro channel low 1 short and were hoping for a measured move down. The bottom at bars 8, 9, and 10 was just below a measured move down from the open of the bar 3 start of the spike to the close of bar 4, the final bear trend bar in the spike. This also contributed to the profit taking by the shorts in that area as well as to the buying by the bulls.
Bar 10 was a double bottom pullback buy setup.
On the rally up to bar 11, the always-in trade flipped to long for more and more traders as the rally progressed. By the time the market paused at bar 12, just about everyone was convinced that the bull momentum was so strong that more of a rally was likely. Once the always-in trade flips, traders should try to get into the market. If there is no pullback, then buy at least a small position and use a wide stop, like below the bottom of the spike. That was what the institutions were doing. They were buying in pieces all the way up because they were not certain when a pullback would come, but they were certain that prices would be higher in the near term and wanted to be sure to profit from the strong trend. If they had waited for a pullback, it might have occurred after many more bull trend bars, and the entry on that pullback might have been well above where prices were at the moment.
As a general rule, as soon as traders decide that there is now a bull trend underway, they should buy at least a small position at the market or on a tiny pullback within the bar or a pullback on a lower time frame chart, because the directional probability of an equidistant move is probably at least 60 percent. For example, if they believed that the always-in trade flipped to long on that second bull trend bar after bar 10, they should have assumed that there was at least a 60 percent chance of the market going up for a measured move up. Traders measured the height from the bar 9 bottom to the bar 11 top of the bull spike and added that to the top of the bar 11 spike. SPY traders also measured from the open of the first bar of the spike (the bar after bar 10) to the close of the second bar of the spike. If the SPY traders bought at the close of that second bull trend bar, they would have put their stops below the low of the first bull trend bar (one bar earlier), and their risk would have been about 12 points. As the spike continued to grow, the measured move target continued to grow, yet the risk would have been fixed at 12 points, and at some point they could have moved their stops to breakeven. If they held until the market reversed down at bar 17, they would have made about 50 points with an initial risk of 12 points, and a breakeven risk after the first few bars following their entry. As the trend progressed to new highs, they could have trailed their stops to below the most recent swing low. For example, after the market rallied above bar 11, their stops would then have been below bar 12, and they would have been protecting about nine points of profit.
After the spike grew for two or three more bars, traders could have taken some profits, moved their stops to breakeven, and assumed that the directional probability of the spike going up for a measured move equal to its height was about 60 percent or more before the market fell below the low of the spike.
The rally up to bar 11 was a bull spike, and the channel up to bar 17 had three pushes and a wedge shape. This could have been the end of the channel, but the market broke out to the upside instead of to the downside. Usually, upside breakouts of bull channels reverse back down before about five bars, but this one continued for about 10 bars. It is common to see the market rally for a measured move up if the breakout of a wedge top is to the upside. Bars 13, 15, and 17 formed a wedge top, and the bar 23 high was just below that measured move from the bar 12 low to the bar 17 high. Also, bull spikes often lead to measured moves based on the open or low of the first bar to the close or high of the last bar. The bar 23 top of the bull leg was a measured move up, adding the number of points between the low of bar 9 to the high of bar 11 to the high of bar 11. Bulls usually look to take partial or complete profits at measured move targets, and aggressive bears will begin to short at that level.
Bar 23 was an expanding triangle top with bars 19 and 21.
Bars 20, 24, and 27 formed a wedge bull flag, but it was weak because of the number and size of the bear trend bars. When the market broke below the bar 27 bottom of the wedge, it fell for more than a measured move down.
The entire rally from bar 10 to bar 23 was a bull channel and therefore a bear flag. Other traders thought that the channel began at bar 12. In both cases, traders believed that the market should test down to at least the area of the bar 12 low. The tails on bars 24, 25, and 27 showed that there was some buying, but the momentum down was so strong that the bulls were unable to reverse the market. The move down from bar 23 to bar 27 had very few bull bodies and they were relatively small, and the move was in a relatively tight bear channel. Bulls would not have bought the first breakout above that bear channel and instead would have waited for a breakout pullback in the form of a higher low, and they would have wanted to see several strong bull trend bars before they would have been willing to become aggressive. Compare this bottom to the top at bar 23. The market did not become always-in down until the strong, convincing bar 24 bear breakout, and many bears would not have shorted until there was a lower high. The market formed a low 2 lower high test of the moving average at bar 26, and the move down was dramatic.
The inside bar after the bar 29 sell climax was a good candidate for a final flag, especially since the breakout was another sell climax. This was another factor in the bar 31 reversal.