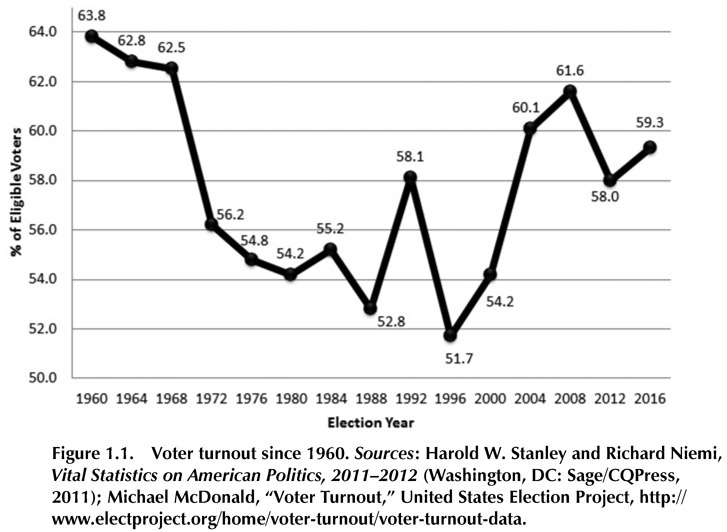
Larry J. Sabato1
All of us living in the twenty-first century now know how people felt in 1948, when the Chicago Tribune headline “DEWEY DEFEATS TRUMAN” was prematurely published, and the pundits and pre-election polls were dead wrong.
Yet 2016 was even worse than 1948. Instead of just a couple of prominent pollsters on the scene when President Harry Truman upset the heavily favored Republican Thomas E. Dewey, there were dozens of independent pollsters and hundreds of surveys taken nationally and in the battleground states. Some national surveys in 2016 did reasonably well, though many surveys—especially in the highly competitive states—did not. Rather than halting the polling weeks before the 1948 election (believing the result was a done deal), the 2016 pollsters continued measuring public opinion right up to election eve, which should have made surveys more accurate, but did not in many cases.2
Comparing Donald Trump’s upset to Harry Truman’s is not to equate the two, of course. Truman was the incumbent while Trump defeated the incumbent White House party. Truman had had a long career in politics and government, while Trump had never served a day in any public office. Truman won the popular vote by 4.5 percentage points; Trump lost it by 2.1 points However, their electoral vote totals were similar—Truman at 303 and Trump at 304.3
Their campaigning styles were also akin to one another. Truman loved to “give ‘em hell,” and Trump’s incendiary (and often inaccurate or outright false) charges were a new form of hell, augmented by his frequent use of Twitter to incite his millions of followers. Additionally, both Truman and Trump were underdogs, a status that confers a kind of freedom to roll the dice, and their unpolished speaking styles and populist approach attracted the white working class disproportionately.
Their opponents were of a sort, too. Dewey and Hillary Clinton made the classic mistake of frontrunners, sitting on their leads and saying little of consequence. “The little man on the wedding cake,” as Dewey was called, trafficked in platitudes and mainly attacked Truman. Reporters at the time noted the size and enthusiasm of Truman’s crowds, a contrast with the desultory Dewey followers who appeared to be carrying out an obligation rather than joining a cause.4 Trump’s crowds were normally huge and boisterous, full-throatedly chanting “Lock Her Up” (referring to Clinton, of course—urged on by Trump’s declarations that she ought to be in prison). The secondary target at Trump rallies were members of the working press, who were often attacked individually and collectively by Trump and then threatened personally by the candidate’s most ardent backers.
Like Dewey, Clinton was swimming in overconfidence and fooled by her campaign’s rosy internal polling—which turned out to be quite erroneous in many critical states. She took for granted the normally Democratic states of Michigan, Pennsylvania, and Wisconsin, waking up too late to impending losses behind the “blue wall” by tiny but decisive margins. Her husband, former President Bill Clinton, sensed the problem and urged a change in direction to appeal to the white working class that had powered his victories, but he was dismissed by the campaign leadership as stuck in the 1990s. Hillary Clinton never once traveled to Wisconsin after the Democratic convention—shocking political malpractice by her team. You never take your base for granted, especially when the demographics of a state such as Wisconsin (as well as Michigan and Pennsylvania) were not dissimilar from Ohio and Iowa, two states that even the Clinton team knew she was likely to lose.5
Both Hillary Clinton and President Obama, her foremost campaign surrogate, appeared hesitant to tout an economy that, while far from ideal, was dramatically better than the one Obama inherited in 2009. Trump defined the economy as in near-depression shape, yet Democrats were almost mute and failed to correct the record. A charge unanswered is a charge agreed to in the hothouse of a campaign.
Unlike Trump, most Clinton rallies were relatively small and the participants rarely stirred by her stilted rhetoric. Trump’s slogan, “Make America Great Again,” had far more power with his constituency than Clinton’s bland “Stronger Together” had with hers. Moreover, while both major-party contenders were unpopular, with high unfavorable ratings (and Trump more so than Clinton for much of the campaign), the Democratic campaign focused most of its energy on attacking Trump rather than trying to remake Clinton’s scandal-burdened image. Her campaign, reflecting the candidate’s ultra-cautious nature and entangling personal alliances, was layered with bureaucracy and rival power centers, so much so that it could take a day for everyone to sign off on an innocuous tweet—quite a contrast to the always tweeting Trump who cleared his missives with no one. The structure of Clinton World was complex; Trump World often began and ended with Trump himself, and that yields a significant tactical advantage.6
Even though Republicans insist otherwise, racial resentment and hostility to undocumented immigrants were powerful forces benefiting Trump. It was no accident that white nationalists were lavish in their praise of Trump, who for years had led the outrageous “birther” campaign that sought to delegitimize America’s first African-American president by falsely claiming he wasn’t born in the United States and was therefore ineligible to occupy the White House. Many in this movement also insisted Obama was secretly a Muslim—no sin, even if true, but a complete lie. Very belatedly and without any fervor or apology, Trump acknowledged after a torrent of criticism during the campaign that he had been totally wrong and President Obama was born in the United States.7
In the chapters that follow, our group of contributors will expand on these themes and many more, while slicing and dicing the 2016 election from quite a few perspectives.
At this writing prior to the onset of the Trump administration, we cannot say which Donald Trump will take the oath of office. Will it be the Trump that inspired his troops, the one that wants to “drain the swamp” of Washington, frustrate the establishment, keep and create millions of jobs, and solve the complicated problem of illegal immigration? Or will the Trump who takes possession of the Oval Office fail because of a lack of relevant experience, poor temperament, too many right-wing lieutenants, unsolved ethical challenges and conflicts-of-interest, and reckless policies? Will President Trump rise to the occasion and use his business background to become a shrewd deal-maker and effective chief executive, or will he validate the image critics have of him as a dangerous authoritarian and narcissistic con-man? There have been contrary indications during the transition.
What we can do at this juncture is try to understand the forces that produced one of the most shocking upsets in U.S. history. This election was Hillary Clinton’s to lose, and she lost it to one of the most unusual and controversial candidates ever, the first president to have no prior elective office or military experience but rather a billionaire businessman and reality-TV star.
Other authors in this anthology will analyze in detail the Clinton and Trump candidacies. For our purposes here and as already mentioned, it is sufficient to say that Clinton was not a compelling candidate—despite being the first major-party woman nominee. She never developed a potent message, especially on the loss of jobs that troubled white working-class voters in key states. The accumulated scars from decades of Clinton scandals (real and invented) took a toll, too, especially her decision to use a private server for email during her tenure as Secretary of State from 2009 to 2013. The Clinton high command complained, with some justification, that the emails were overemphasized by the media—but it was their job to push back and create a better image for their candidate. An FBI investigation of the emails was a nagging problem for Clinton, and erupted twice just days before the election, thanks to questionable actions by FBI Director James Comey. These bomb-shells almost certainly had an effect on undecided voters and wavering independents and Republicans. (More to come about this in later chapters.)
Almost daily disclosures of embarrassing emails from people closely associated with Clinton were another unsettling distraction. These missives were released by WikiLeaks and very likely stolen by hackers associated with the Russian government, which wanted Trump to win for reasons including a belief that Trump would be a friendlier occupant of the Oval Office. (President Obama ordered an intelligence agency investigation of Russia’s interventions in the U.S. election in December 2016.)8
Trump’s contrast with Clinton was stark. He attracted millions of followers so devoted that they were unmoved by many unsavory revelations about their nominee. His backers enabled Trump to survive more scandals than any modern presidential candidate has ever faced, including Bill Clinton when he ran in 1992. Trump smartly concentrated on rural and exurban areas that were filled with voters who regarded him as heroic and would prove to be essential to his victory. His election was driven by noncollege whites living in outlying suburbs and small-town America; their high turnout and massive margins for Trump were a big part of the Election Day story. They loved Trump’s rejection by the Republican governing class, which certified this billionaire as an outsider populist. Shunned by many respectable “establishment” GOP leaders, Trump made a virtue of his foes’ opposition, both in the primaries and the general election.
Timing helped Trump. Only once since 1952 have Americans given a third consecutive White House term to the same party: in 1988, when Vice President George H. W. Bush benefited from President Ronald Reagan’s popularity and the prosperity and peace that generally prevailed at the time. Despite the fact that President Obama had even higher job approval numbers than Reagan enjoyed in his final year as president, Obama and Clinton could not quite pull off an Electoral College majority. The no-third-term tendency was maintained.9
In examining the data, it is obvious just how tight the election was. A mere 77,744 votes combined in the states of Michigan, Pennsylvania, and Wisconsin gave Trump the 46 electoral votes that put him over the top. Clinton had millions of excess votes in New York, California, and the other 18 states (plus Washington, D.C.) she won—far more than Trump had from the 30 states he captured.10 However fanciful it seems, her campaign might have done better to spend a fraction of its massive war chest to relocate a couple hundred thousand Californians and New Yorkers to Michigan, Pennsylvania, and Wisconsin! No doubt Clinton’s team would have done precisely that, had they had an inkling of what was about to happen.
At least Clinton had the satisfaction of knowing she carried the popular vote, and by a record-setting plurality of 2.87 million in a solid turnout of 137 million votes total (59.3 percent of the eligible population—a bit larger than in 2012 (58.6 percent).11 This was roughly five times the plurality enjoyed by Al Gore over George W. Bush in 2000 (547,000 votes), and meant that Clinton won 48.0 percent (65,853,625) to Trump’s 45.9 percent (62,985,106). Clinton’s margin was just 1.8 percentage points smaller than President Obama’s 3.9 point edge over Mitt Romney four years ago, and because of the slightly larger turnout, Clinton received almost as many votes as Obama did in 2012 (65.8 million for Clinton versus 65.9 million for Obama). However, Trump secured almost 2 million more votes than did Romney. Nonetheless, we have to reach back to 1876 to find a popular-vote winner, Democrat Samuel J. Tilden, who garnered a larger national lead (exactly 3 points) yet still lost. Winning Republican Rutherford B. Hayes, who lagged behind Tilden by 250,000 votes, was called “His Fraudulency” during his single term.12
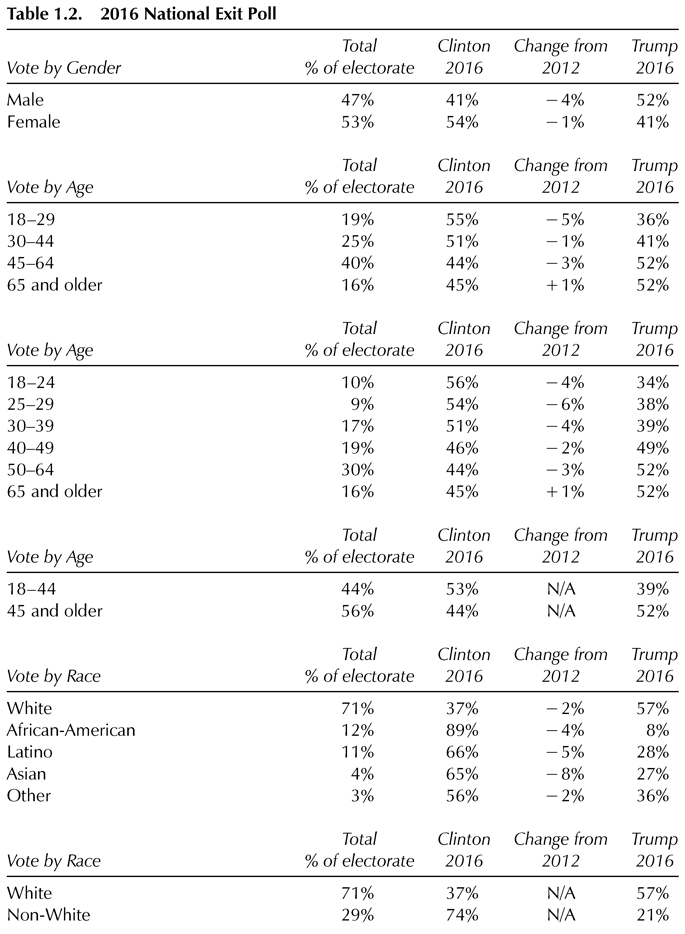
Like it or not, the Founders’ Electoral College still gets to pick the president. Trump was the undisputed champion there, with 304 votes to Clinton’s 227. Both sides played the game with the same rulebook, and Trump cameout ahead by a comfortable Electoral College margin. As president-elect, Trump and his staff declared his triumph to be “one of the biggest Electoral College victories in history.”13 This is patently untrue. Considering just the last ten presidential elections, Trump’s winning College margin was only the eighth largest.14 At the same time, Trump is much like Dr. Johnson’s dog, which was hailed for the feat of walking upright, not criticized for how well he did it. The odds were so heavily stacked against Trump that his election by any margin counts as a remarkable achievement.

Democrats have garnered a popular-vote plurality in six of the last seven presidential contests, but lost the Electoral College, and thus the White House, twice. This may happen more frequently in future close elections since, as I just mentioned in the case of 2016, Democrats pile up more excess votes in their sure-win states. Along with the extra influence accorded small states thanks to each state, regardless of population, being given the same two senatorial electoral votes, the special GOP advantage in the Electoral College compared to the popular vote is another reason why attempts to abolish the archaic institution will not succeed.15
Regionally, the candidates drew support in about the usual pattern, with one exception—the often-Democratic industrial Midwest, where Trump narrowly edged Clinton thanks to his notable strength in the Rust Belt—Trump carried the South, the Mountain West, and the Plains easily, while Clinton swept the Pacific states (save Alaska) and the Northeast, though Maine and New Hampshire were tighter than expected. Trump won an extra electoral vote in Maine by carrying the northern Second District.
California deserves a special word. The state is predictably Democratic, but rarely as much as it was in 2016. Clinton’s 61.5 percent exceeded Obama’s percentages in both 2008 and 2012 (60.9 percent and 60.2 percent, respectively), while Trump’s support in the Golden State was the GOP’s all-time, post-Civil War low. Governor Alf Landon of Kansas previously held the record, receiving a mere 31.7 percent when he challenged President Franklin D. Roosevelt in 1936. Trump’s proportion against Clinton was 31.5 percent. California alone provided Clinton with a plurality of over 4.2 million votes, which greatly exceeded her national lead of 2.9 million.16
That’s not to say there weren’t surprises in individual states. Trump won Arizona, Georgia, and Texas by smaller-than-usual percentages for a GOP nominee, and in Utah—where the Republican normally garners 60 percent or more—Trump couldn’t even muster a majority. The 2012 GOP presidential nominee, Mitt Romney, and the state’s dominant Church of Latter-day Saints made their objections to Trump quite clear, and an independent conservative candidate, Evan McMullin, a Utahan and a Mormon, secured 21.3 percent. Once reliably GOP Virginia prevented Trump from sweeping the South, and the Republican’s decisive loss in the Old Dominion makes it three in a row for Democrats in presidential contests. The result solidifies the new classification of Virginia as being more Mid-Atlantic than Southern in its statewide politics.
Similarly, Clinton carried Colorado, Maine, Minnesota, and Nevada by smaller-than-expected pluralities. She lost Iowa and Ohio, both of which had voted twice for Obama, by wide margins. Her team had believed she would carry both Florida, which she lost by 1.2 points, and North Carolina, which she lost decisively (3.7 points). Until election night, the campaign never really thought Clinton would fall short in any of the northern tier of states she failed to carry—though they did understand that Michigan and Pennsylvania had become close. Wisconsin was a shocker for everyone, since Trump had shown weakness there even in the GOP primary and had never led in any of the established state polls.
Some of the reasons for the upset have already been mentioned, and others will be explored in subsequent chapters.17 A combination of these factors pushed more of the late undecideds to Trump, many of whom were Republicans unhappy with Trump or weak backers of third-party candidates. In four critical states (Florida, Michigan, Pennsylvania, and Wisconsin) Trump scooped up the late undecideds by wide margins, easily enough to tip the states away from Clinton right at the end.18 Some millennials, opposed to Trump but fans of Bernie Sanders rather than Clinton, also melted away in the final days to third parties or, mainly, to nonvoting status. Clinton’s campaign manager has publicly blamed low turnout by young voters for his candidate’s loss.19
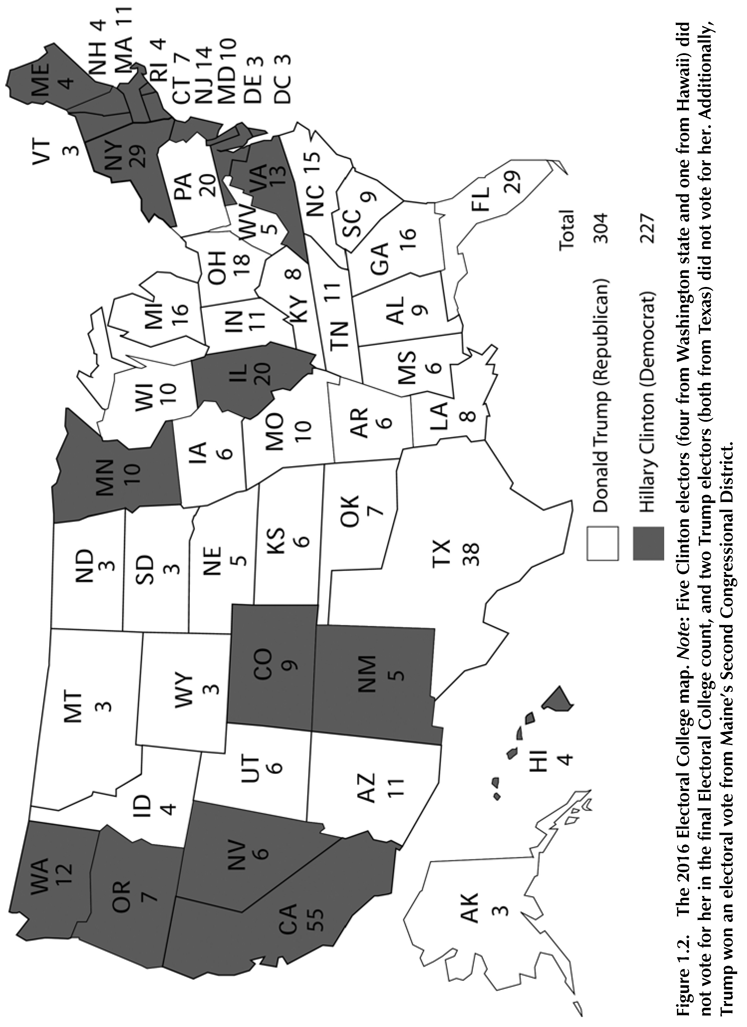
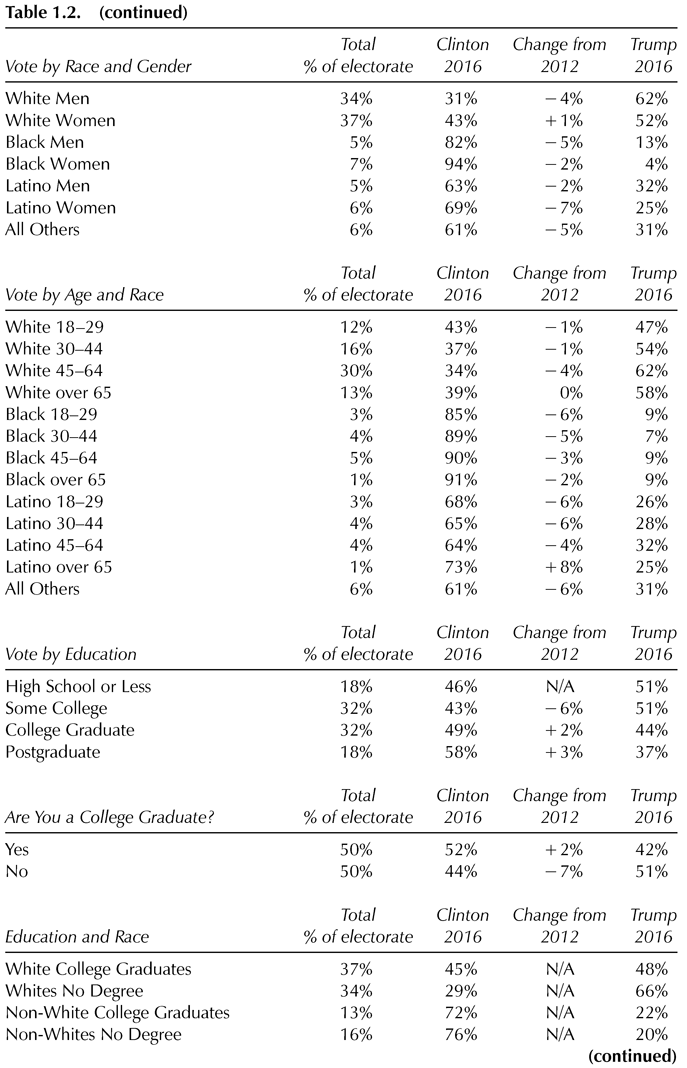
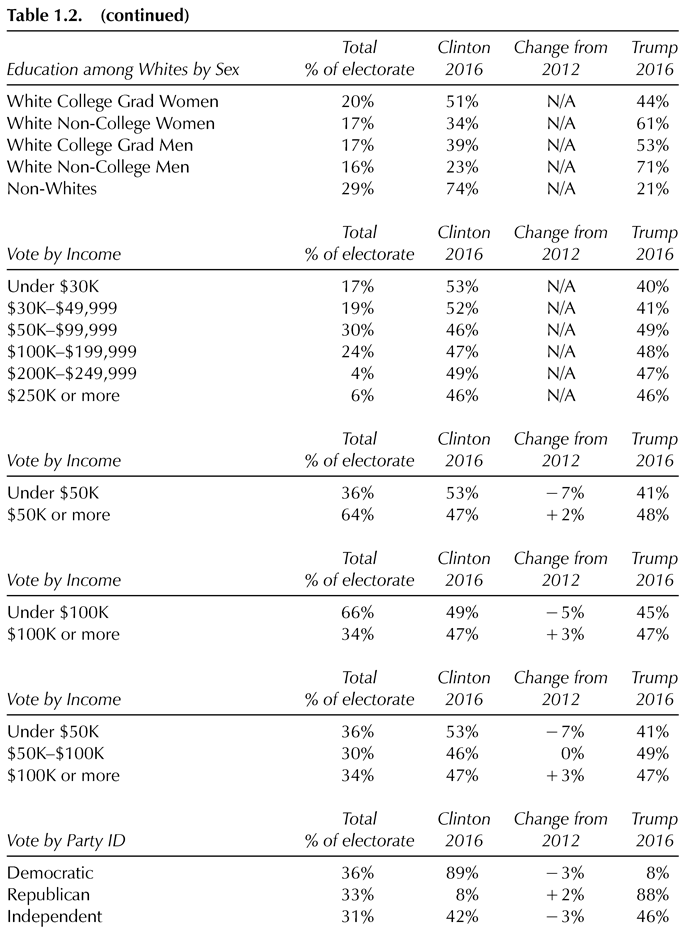
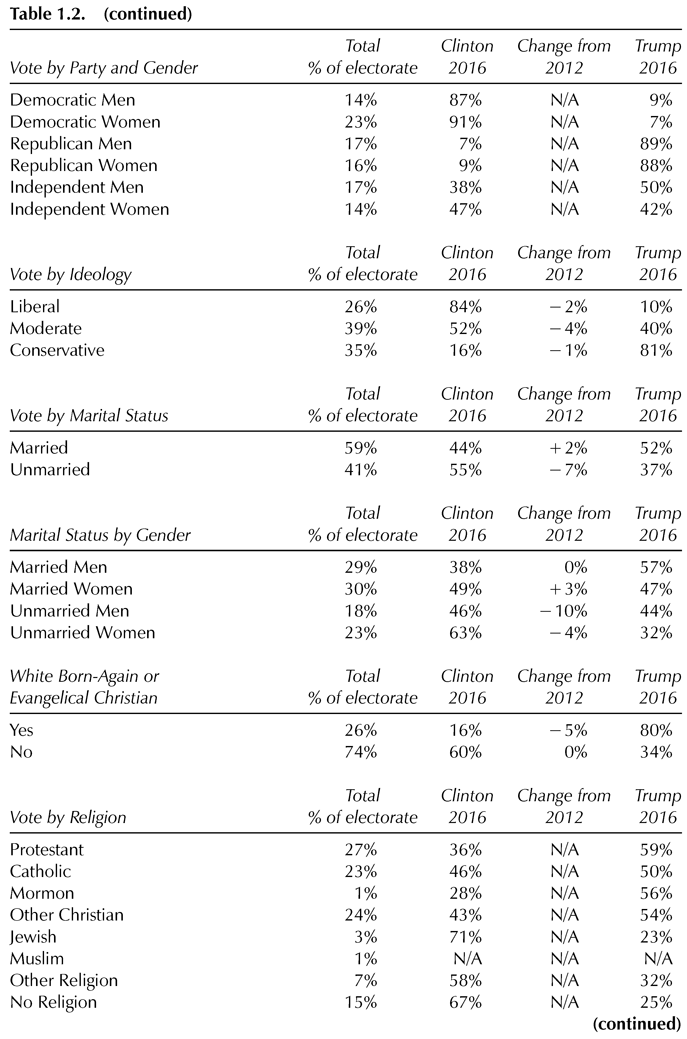
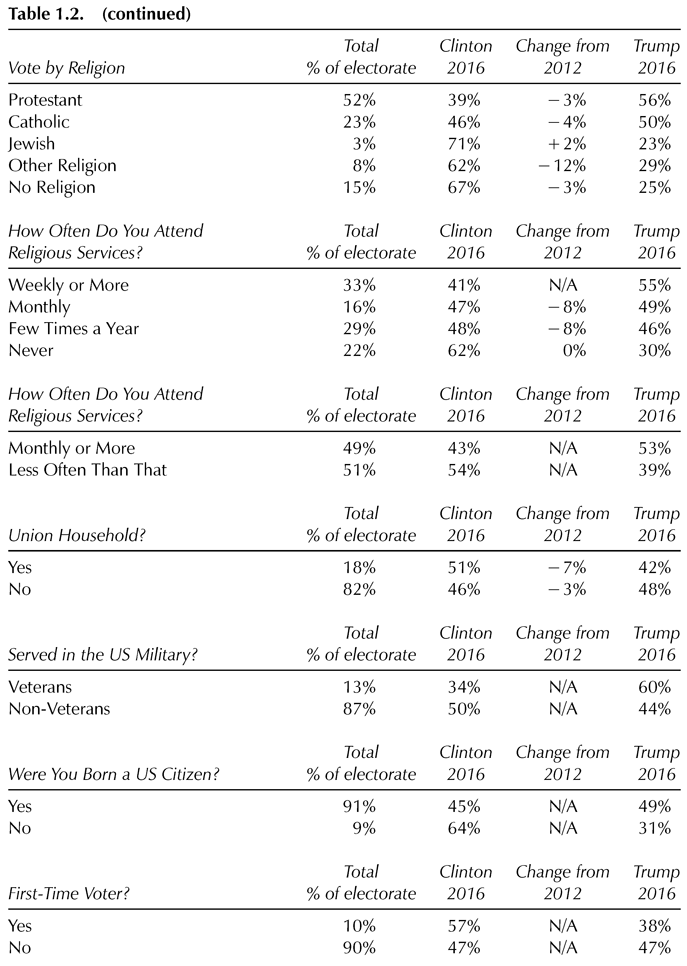
A glance at the national exit poll’s findings can flesh out some of the trends, though the pollsters stress, correctly, that the numbers for subgroups are not completely reliable.
Many pre-election polls had pointed to a record gender gap, with women substantially favoring the first female major-party presidential nominee. There was indeed a considerable gender gap: Clinton won women by 13 points, and Trump drew men 11 points. Depending on how one calculates the gap—adding together the net difference in support for the two genders or comparing the gender support of the winner—the 2016 cycle either set a record (24-point difference) or equaled the 1996 election (11-point difference as Trump won 52 percent of men and 41 percent of women). But the fact that the gender gap wasn’t even more favorable for Clinton among women proved a major disappointment for Democrats, who have relied on female voters to power all of their victories in recent decades. Clinton also ran 4 points behind Obama’s performance among men.
The role of gender will prove to be a fruitful subject for extended inquiry in the months and years ahead. Bias against women as political leaders has clearly diminished in modern times, and women have been elected to state governorships and other executive offices with some frequency. But the presidency is the ultimate executive office, and there are still many men, and some women, who have hidden (or not-so-hidden) gender prejudices. To what extent did gender, independent of party affiliation and other factors, influence the vote for and against Clinton? Throughout the campaign, an observer could not miss an assertion made frequently by women young and old: “I want a woman president, and I’m sure we’ll have a woman president soon, but I don’t want this particular woman (i.e., Clinton).”20
It is easy to see why Clinton depended on young voters. Those age 18–29 were the only age group to back Clinton with a sizable majority (55 percent), though she fell 5 points behind Obama in 2012 and 11 points behind Obama with this cohort in 2008. Clinton also won (by 10 points) those age 30–44—and mid-40s was the break point. Trump won voters 45 and up with 52 percent. Incidentally, young voters were about twice as likely as older voters to cast a ballot for a third-party candidate.21
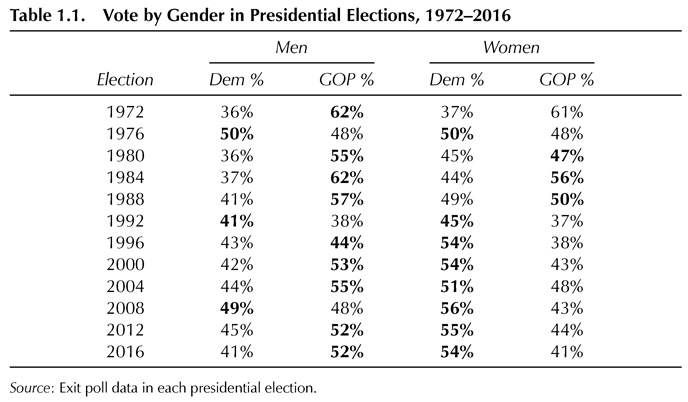
A more diverse America has helped Democrats, because they get the lion’s share of voters who belong to racial minority groups. Again, Clinton fared well with every racial minority, and minorities comprised 29 percent of the electorate (a bit higher than in 2012, if the exit poll totals are accurate). Her precise proportion of the vote with each group is a matter of some controversy. While the exit poll showed Clinton defeating Trump by 66 percent to 28 percent among Hispanics, more convincing data from the polling group Latino Decisions suggests the tally was closer to 79 percent to 18 percent. Latino Decisions explores the Hispanic vote later in this book.22
In any event, Trump’s Electoral College majority was built overwhelmingly with the votes of whites—he received 57 percent to Clinton’s 37 percent, about the same as in the Obama-Romney race. White men supported Trump 62 percent to 31 percent; white women backed him 52 percent to 43 percent, well under the white male margin but still quite healthy. Even young whites age 18–29 voted for Trump by 4 points.
Level of education emerged as a stark divider in 2016. Trump’s unpolished speech and harsh positioning on a range of issues appealed disproportionately to people who were not college educated. Many in this category have been left behind economically, and they often blame other races, immigrants, and the establishment elite of both parties for their plight. Trump won non-college grads by 51 percent to 44 percent, and won whites with no college degree by a massive 66 percent to 29 percent. The vote was close among white college grads: Trump won 48 percent to 45 percent.
Meanwhile, Clinton won white female college grads by 51 percent to 44 percent. One of the largest Clinton margins among educational groupings came from those with some postgraduate college education: 58 percent Clinton to 37 percent Trump.
Despite all these variations in the 2016 vote, one factor remained the same—partisanship. Both Trump and Clinton received about nine of ten votes from those identifying with the candidate’s party. In the case of Trump, this is astonishing because so many former and current GOP officeholders either refused to endorse Trump or publicly spoke out against his candidacy. Yet in the end, however reluctantly, Republicans came on board the Trump train. This is yet another measure of the intense partisan polarization that defines the current era. More self-identified Democrats voted (36 percent compared to 33 percent for the GOP), but Independents broke for Trump, 46 percent to 42 percent.
The 2016 contest didn’t change much in some other respects. Those who are married tend to vote Republican and the unmarried voters are mainly Democratic. Trump’s strongest social grouping was married men (57 percent), and Clinton’s was unmarried women (63 percent).
Some fascinating evidence emerged that the era of personal scandals as decisive factors in elections may have ended, or at least the impact of such scandals going forward will be muted. Trump’s life has been a tabloid dream—three marriages, multiple affairs, the Access Hollywood tape, dozens of X-rated appearances with Howard Stern, a dozen accusations of groping and sexual harassment, and so on. Granted, the Clinton family has had their share of disgrace, too, and Trump highlighted Bill Clinton’s foibles whenever possible. But did anybody really expect white born-again Christians (26 percent of the electorate) to give Trump 80 percent of their votes? This was slightly higher than the share they awarded to George W. Bush, John McCain, and Mitt Romney.23 Dislike of Hillary Clinton and the pending Supreme Court nomination must have done the trick. Trump secured a majority of the Catholic vote, too (50 percent to 46 percent), as well as 55 percent of those who attend church weekly or even more often.
The February 2016 death of conservative Supreme Court Justice Antonin Scalia may have been one of many factors that accounted for the difference in the election. The Scalia seat was viewed as critical to maintaining the current ideological balance on the Court (and of course it is possible that other seats will become open in the next four years). Had the Scalia seat not been open, evangelical Christians might not have been so willing to overlook Trump’s personal issues. But it was open, and Christians and conservatives considered the Court to be a top concern in determining their votes.
Clinton won the 74 percent of the country that did not identify as white born-again by 60 percent to 34 percent. In a continuation of the modern trend, the 22 percent of Americans who never attend religious services gave the Democratic nominee about a two-to-one majority.
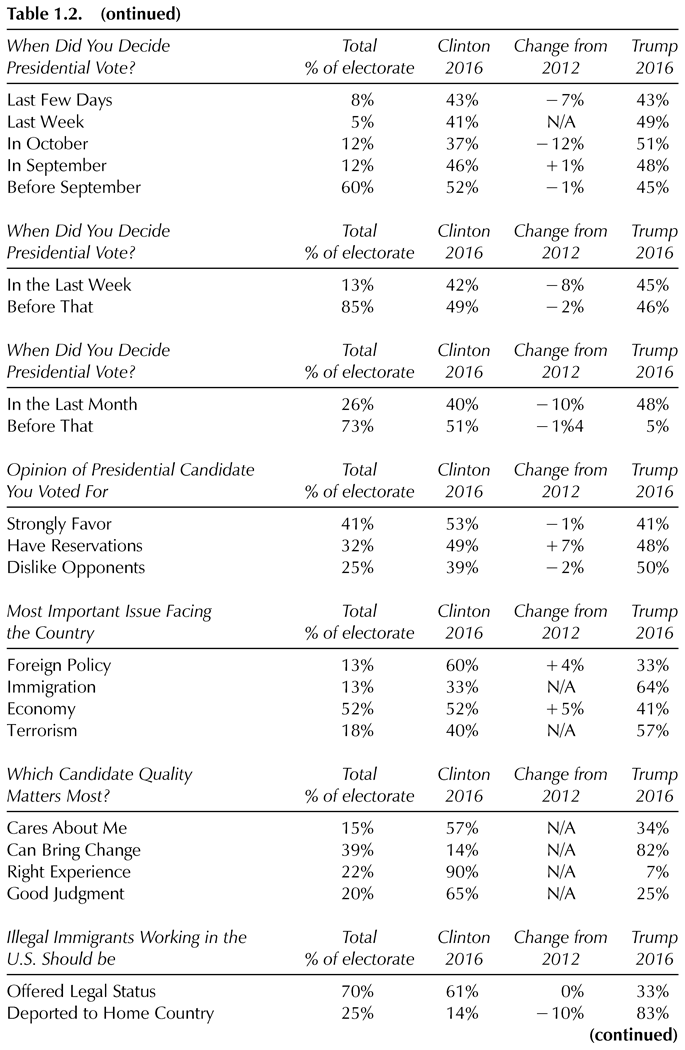
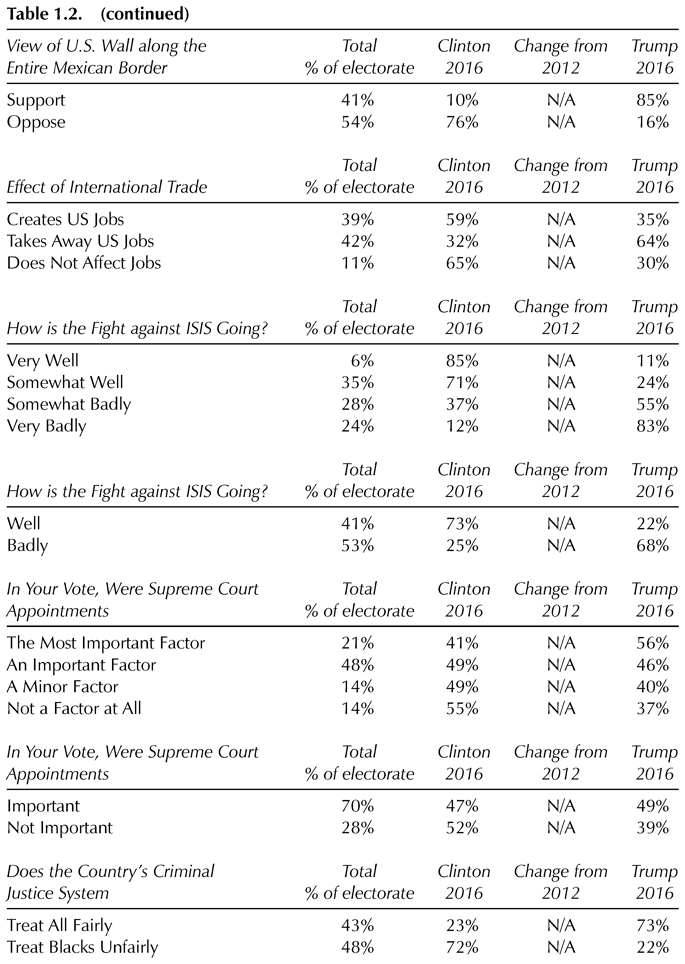
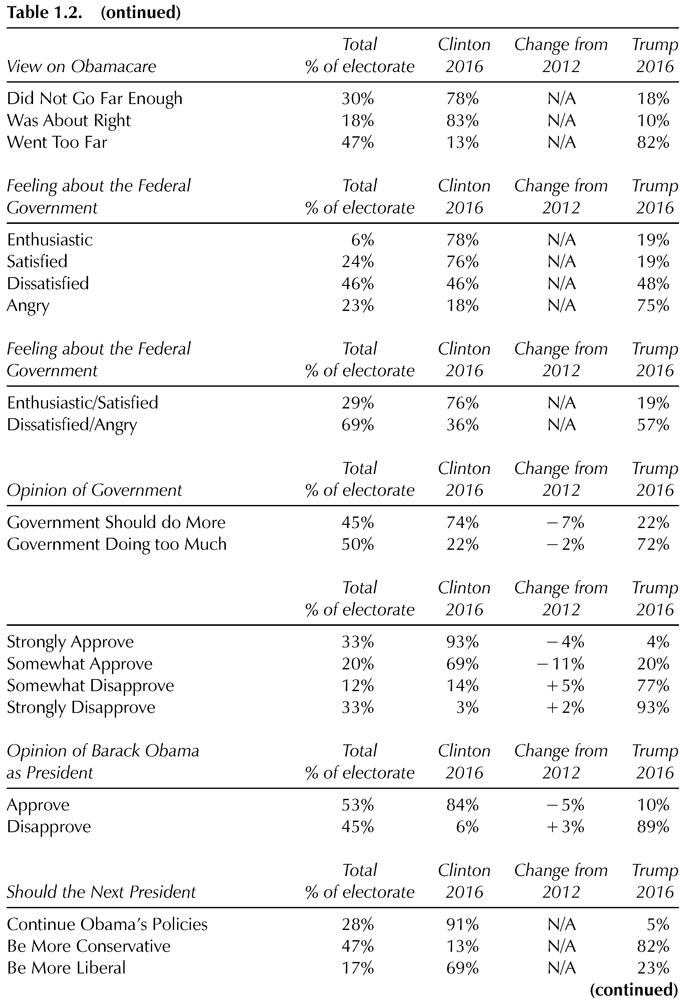
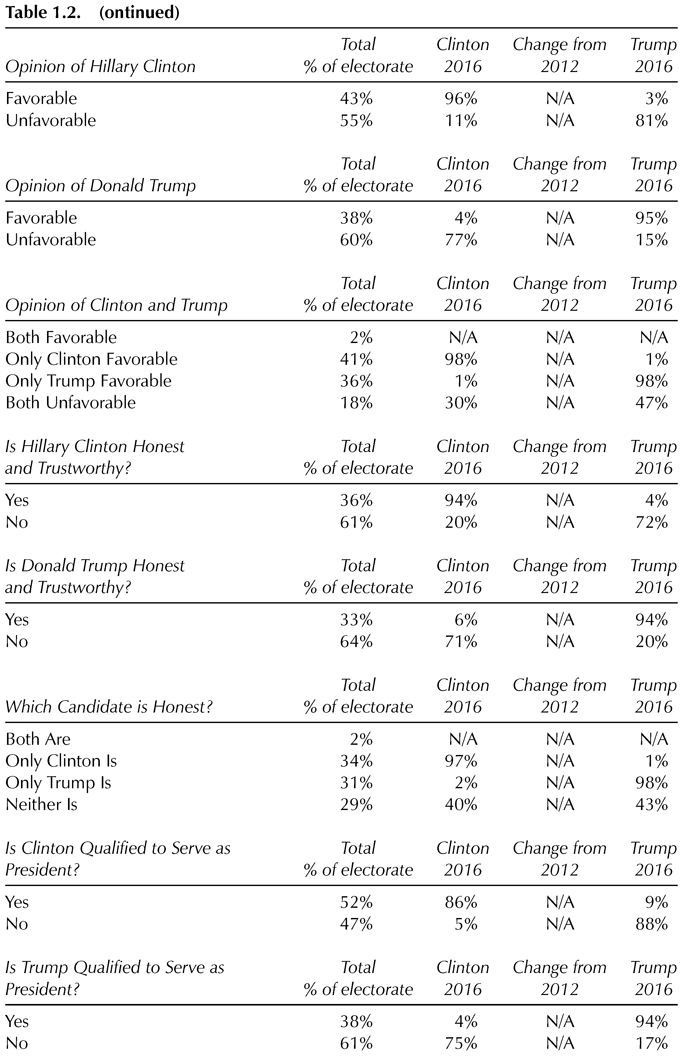
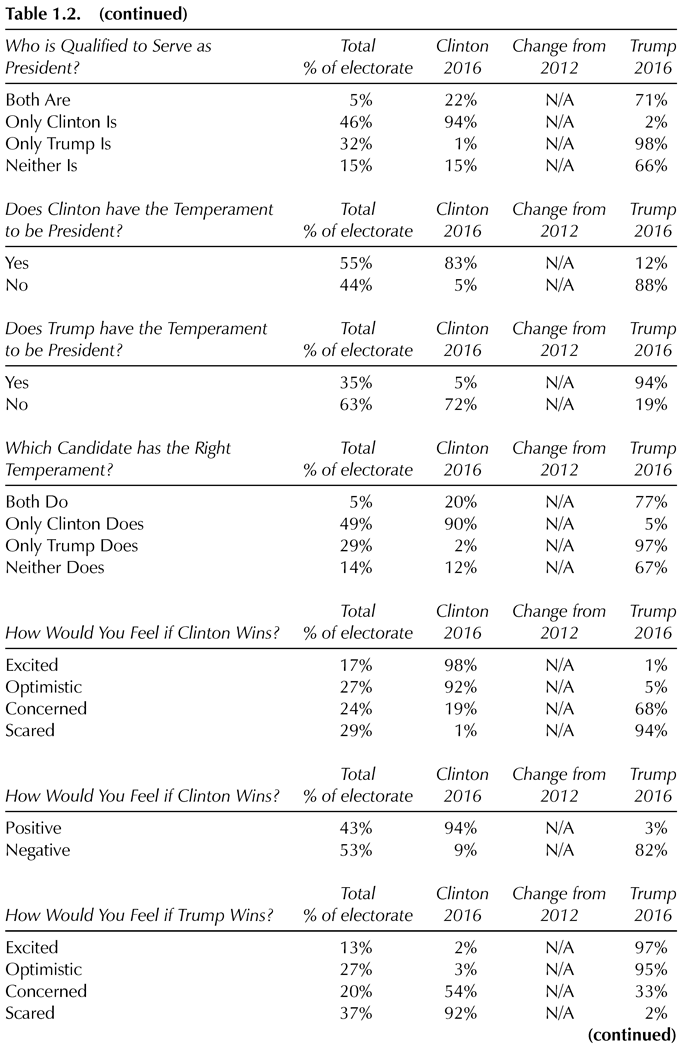
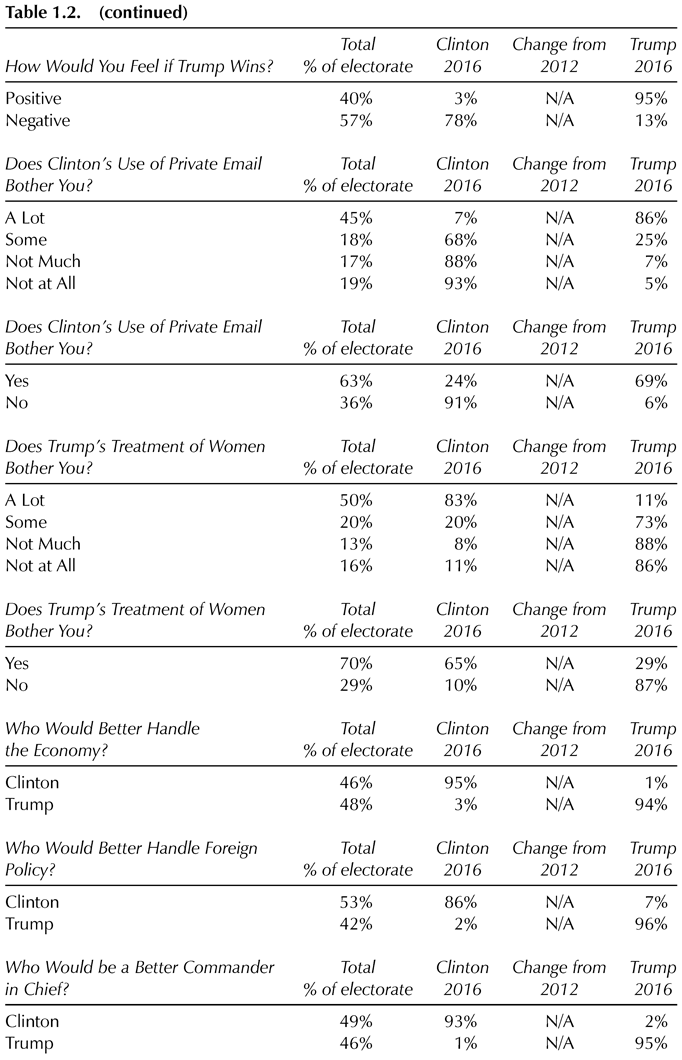
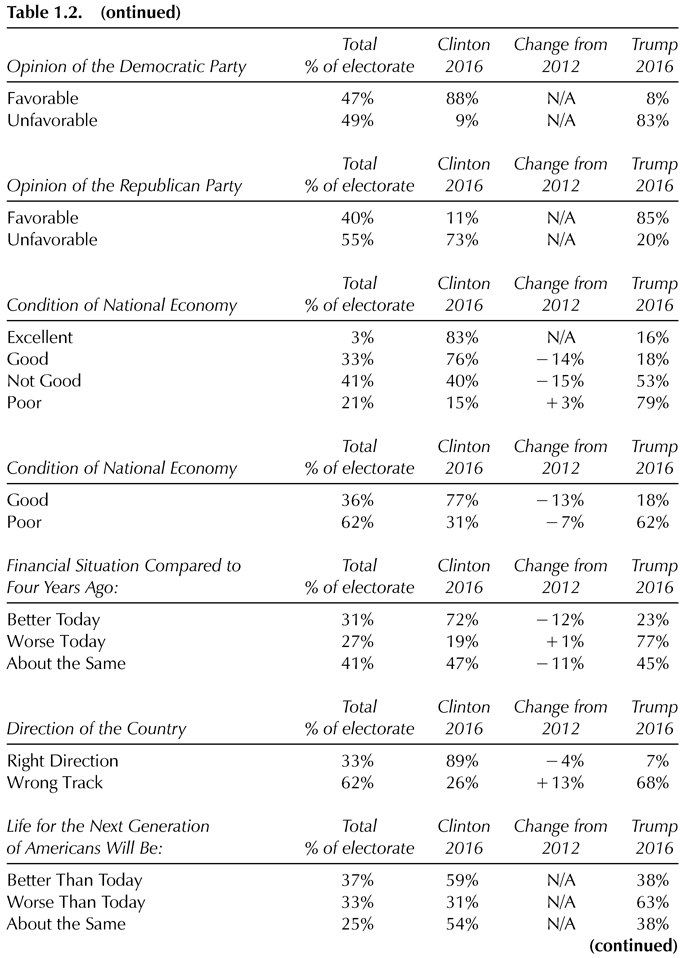
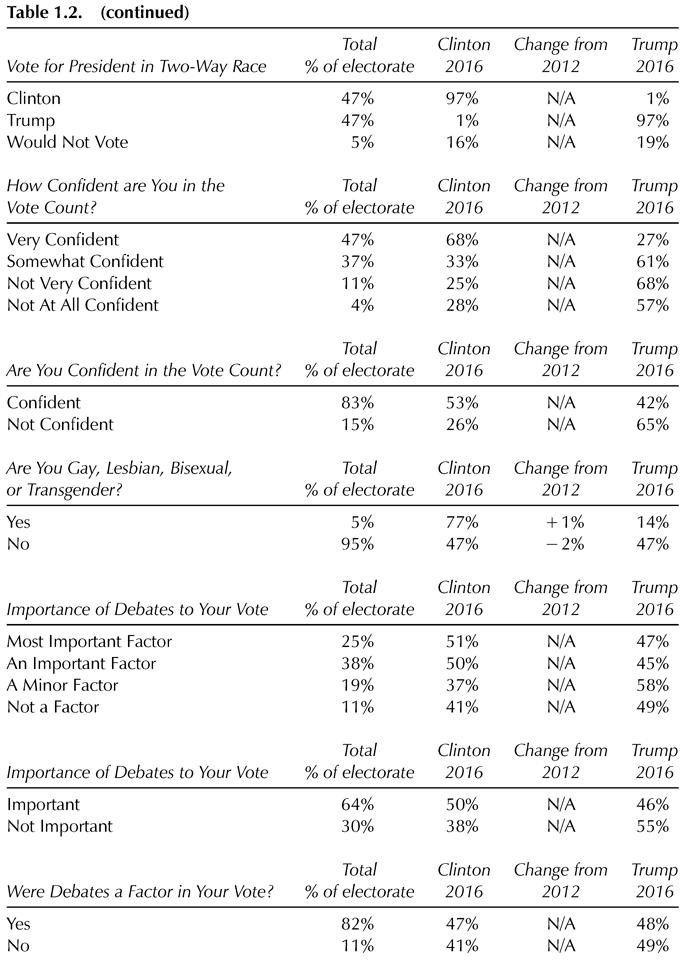
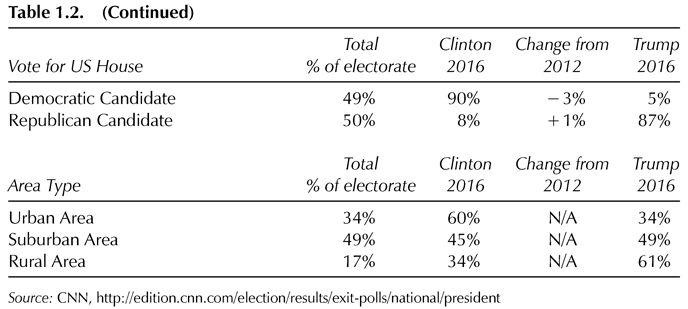
Table 1.2 has much more from the national exit poll, including the impact of prominent issues and candidate characteristics; it is worth a close look. You can see that Trump did very well among military veterans, native-born Americans, and those disapproving of President Obama’s job performance. Clinton scored very well with Obama backers, first-time voters, and LGBT voters.
Voting is an act that is both emotional and rational. Not all responses make sense, at least at first glance—the rational must be leavened by the emotional. More than half the voters said Clinton was qualified for the office and had the temperament to be president, while over 60 percent said Trump was not. Yet Trump received nearly one-fifth of the votes from the latter group. Undoubtedly, these were mainly reluctant Trump voters who were conservative, Republican, and anti-Clinton. As is their right, they decided to take a chance on Trump, given the alternative they detested.
There cannot be any question that the United States is deeply divided; we may be more accurately termed the Disunited States. Red America and Blue America have very different cultural values and ideological politics, and the gulf is growing larger over time.
It is simply not obvious what we can do about it, or how the incoming president can hope to bridge the gap—especially this new president, whose favorability numbers are low and who is loved and hated in about equal measure by the nation’s population. Much of what Donald Trump has done during the transition has underlined or even deepened partisan polarization, and the controversy over pro-Trump Russian involvement in the election can only accentuate our divisions. So too will his forthcoming reversal of much of President Obama’s legacy, from Obamacare to immigration reform to climate change sensitivity. A change of party in the White House in these times means a sharp ideological shift, especially when accompanied by a Congress amenable to the president’s agenda. Trump’s loss of the popular vote may restrict his mandate somewhat and embolden Democrats, yet it will be difficult to derail most of the incoming White House’s policies.
Fierce partisan battles are inevitable in the next four years, and the polarizing personality of President Trump as well as the intensified clash of cultural values between red and blue America could lead to turmoil in our society. Surely we aren’t moving toward another civil war, though a lesser storm is already building. Widespread demonstrations and civil disobedience may well be in our future during the Trump administration. Perhaps this is too pessimistic a view. However, having lived through seventeen presidential elections and their consequences, I cannot see any equivalent to the passions we have already witnessed in the aftermath of November’s outcome. Because the stakes are so high, neither the winners nor the losers have been particularly gracious—though President Obama and President-elect Trump were civil to one another during the transition. Compromise is a lost art for the most part, and it may be impossible to paper over the highly charged controversies that separate us.
For now, it might help a little to learn every possible lesson from the 2016 campaign. This book, we hope, is a start.
1. Note: The author would like to acknowledge the invaluable assistance of Timothy M. Robinson of the University of Virginia Center for Politics.
2. John Sides, “Which Was the Most Accurate National Poll in the 2016 Presidential Election?” The Washington Post, December 5, 2016, https://www.washingtonpost.com/news/monkey-cage/wp/2016/12/05/which-was-the-most-accurate-national-poll-in-the-2016-presidential-election/; Dhrumil Mehta, “How Much the Polls Missed By in Every State,” FiveThirtyEight, December 2, 2016, http://fivethirtyeight.com/features/how-much-the-polls-missed-by-in-every-state/; Peter K. Enns, Jonathan P. Schuldt, Julius Lagodny, Alexander Rauter. “Why the Polls Missed in 2016: Was It Shy Trump Supporters After All?” The Washington Post, December 12, 2016, https://www.washingtonpost.com/news/monkey-cage/wp/2016/12/13/why-the-polls-missed-in-2016-was-it-shy-trump-supporters-after-all/; the national polls in the RealClearPolitics average right before the election had Clinton leading by 3.2 percentage points, and in the end she won by 2.1. That is reasonably close to reality, and below the variance in some other elections, including 2012. But many state polls were well off the mark, misleading everyone about the likely outcome in multiple battleground states.
3. Andrew E. Busch, Truman’s Triumphs: The 1948 Election and the Making of Post-war America (Lawrence, Kansas: University Press of Kansas, 2012); Zachary Karabell, The Last Campaign: How Harry Truman Won the 1948 Election (New York: Vintage, 2001); David Pietrusza, 1948: Harry Truman’s Improbable Victory and the Year That Transformed America (New York: Union Square Press, 2011).
4. Richard Norton Smith, Thomas E. Dewey and His Times (New York: Simon and Schuster, 1982); Gary A. Donaldson, Truman Defeats Dewey (Lexington, Kentucky: University Press of Kentucky, 1999).
5. Glenn Thrush, “10 Crucial Decisions That Reshaped America,” Politico Magazine, December 9, 2016, http://www.politico.com/magazine/story/2016/12/2016-presidential-election-10-moments-trump-clinton-214508.
6. Ibid.
7. Ashley Parker and Steve Eder, “Inside the Six Weeks Donald Trump Was a Nonstop ‘Birther,’ ” The New York Times, July 2, 2016, http://www.nytimes.com/2016/07/03/us/politics/donald-trump-birther-obama.html; James Cook, “US Election: Trump and the Rise of the Alt-Right,” BBC News, November 7, 2016, http://www.bbc.com/news/election-us-2016-37899026.
8. Tina Nguyen, “Obama Orders Investigation of Russian Hacking During 2016 Election,” Vanity Fair, December 9, 2016, http://www.vanityfair.com/news/2016/12/obama-investigation-russian-hacking-election-2016.
9. Richard Ben Cramer, What It Takes: The Way to the White House (New York: Vintage, 1993).
10. Overall, Hillary Clinton had an excess of 11,226,189 votes. Donald Trump had an excess of 8,357,670.
11. Michael McDonald. “2016 November General Election Turnout Rates,” United States Election Project, http://www.electproject.org/2016g.
12. Congress, not the Electoral College, awarded Hayes the disputed electoral votes that made him president, so the circumstances are not parallel. Incidentally, all five presidential candidates who have won the popular vote but been denied the White House have been Democrats: Andrew Jackson in 1824, Tilden in 1876, Grover Cleveland in 1888, Gore in 2000, and Clinton in 2016.
13. Kate Samuelson, “Donald Trump’s Transition Team Dismisses Report on Russian Interference in U.S. Election,” Time, December 10, 2016, http://time.com/4597274/donald-trump-russia-election-intervention-cia/.
14. The Electoral College vote totals for the past ten election winners are as follows: Ronald Reagan (1980): 489; Ronald Reagan (1984): 525; George H.W. Bush (1988): 426; Bill Clinton (1992): 370; Bill Clinton (1996): 379; George W. Bush (2000): 271; George W. Bush (2004): 286; Barack Obama (2008): 365; Barack Obama (2012): 332; Donald Trump (2016): 304.
15. Larry J. Sabato, A More Perfect Constitution (New York: Walker and Company, 2008), 121–153.
16. Political activists in the state have begun calling (again) for a Brexit-style “Calexit”; that is, the secession of California from the United States. Some have asked the states of Oregon and Washington to join with California in a new nation called Cascadia. Without question, this will not happen, and the matter of secession was essentially decided by the Civil War. Still, this suggests the deep division and extreme unhappiness after the 2016 election in some parts of the country.
17. David Robert, “Everything Mattered: Lessons from 2016’s Bizarre Presidential Election,” Vox, November 30, 2016, http://www.vox.com/policy-and-politics/2016/11/30/13631532/everything-mattered-2016-presidential-election.
18. According to the national exit poll, the 13 percent of voters who decided in the last week backed Trump 45 percent to 42 percent.
19. “Campaign for President: The Managers Look at 2016,” Harvard Institute of Politics at the Harvard Kennedy School, December 1, 2016, http://iop.harvard.edu/get-inspired/campaign-managers-conference/campaign-president-managers-look-2016.
20. Jeffrey M. Jones and David W. Moore, “Generational Differences in Support for a Woman President,” Gallup, June 17, 2003, http://www.gallup.com/poll/8656/generational-differences-support-woman-president.aspx; Clare Malone, “From 1937 to HillaryClinton, How Americans Have Felt about a Woman President,” FiveThirtyEight, June 9, 2016, http://fivethirtyeight.com/features/from-1937-to-hillary-clinton-how-americans-have-felt-about-a-female-president/.
21. According to the exit poll, 18–29 year-old voters favored Hillary Clinton over Donald Trump 55 percent to 36 percent with 9 percent choosing another candidate; 30–44-year-olds favored Clinton over Trump 51 percent to 41 percent with 8 percent choosing another candidate; 45–64 year-olds favored Trump over Clinton 52 percent to 44 percent with 4 percent choosing another candidate; lastly, voters age 65 and older favored Trump over Clinton 52 percent to 45 percent with 3 percent choosing another candidate.
22. “Lies, Damn Lies, and Exit Polls,” Latino Decisions, November 10, 2016, http://www.latinodecisions.com/blog/2016/11/10/lies-damn-lies-and-exit-polls/.
23. In 2004, George W. Bush won 78 percent of white born-again Christians. In 2008, John McCain won 74 percent. In 2012, Mitt Romney won 78 percent.