The Jesse Livermore method of market trading will soon be available on a computer system that will be tied into a live stock market feed. This feed supplies a 15 minute-behind-real-time database. This Livermore system will provide a two-fold basis to trade like “Livermore.” The first option will be to enter a virtual stock market world where everything will be real except the trader will use virtual money. The participant will receive a stake of 100,000 dollars in “virtual money.” Livermore believed “if you don’t put your money on the table you can never test your judgment.” The second option will allow the participant to trade the stock market using real money.
This chapter is a small preview of how the software program will perform.
Jesse Livermore never used charts. He used mathematical analysis to draw his conclusions. There is no doubt that Jesse Livermore would have taken advantage of every single technology and modern method to increase the volume and accuracy of information that was available to him. It would only be logical for him to use graphic analysis as well as his mathematical theories. There is no doubt that this graphic analysis would have included charts.
As a result, to help explain his basic fundamental approach to the market, graphic tools will be used.
![]() TDT—TOP DOWN TRADING — THE CONCEPT OF “TOP DOWN TRADING” IS VERY STRAIGHTFORWARD, BEFORE MAKING A TRADE ON ANY PARTICULAR STOCK YOU MUST FIRST CHECK OFF THE FOLLOWING ITEMS, LIKE A PILOT CHECKS OFF THE PRE-FLIGHT LIST.
TDT—TOP DOWN TRADING — THE CONCEPT OF “TOP DOWN TRADING” IS VERY STRAIGHTFORWARD, BEFORE MAKING A TRADE ON ANY PARTICULAR STOCK YOU MUST FIRST CHECK OFF THE FOLLOWING ITEMS, LIKE A PILOT CHECKS OFF THE PRE-FLIGHT LIST.
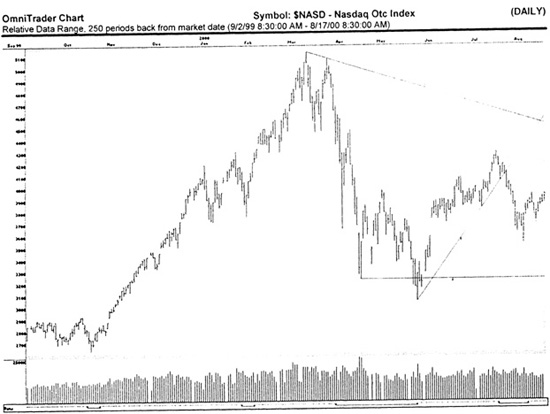
![]() TM — THE MARKET—Check the line of least resistance for the overall current market direction. Remember, Livermore never used the terms “Bull” or “Bear” because they forced a mind-set that he believed made the mind less flexible. He used the term “Line of least resistance.” He checked to be sure the current line of least resistance was positive, negative or neutral—sideways. Be sure to check the exact market the stock trades in for instance: Dow, NASDAQ, or Amex—before executing the trade. It is essential to make sure the lines of least resistance are in the direction of your trade before entering the trade.
TM — THE MARKET—Check the line of least resistance for the overall current market direction. Remember, Livermore never used the terms “Bull” or “Bear” because they forced a mind-set that he believed made the mind less flexible. He used the term “Line of least resistance.” He checked to be sure the current line of least resistance was positive, negative or neutral—sideways. Be sure to check the exact market the stock trades in for instance: Dow, NASDAQ, or Amex—before executing the trade. It is essential to make sure the lines of least resistance are in the direction of your trade before entering the trade.
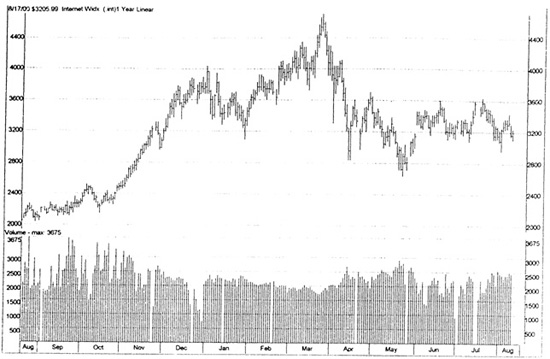
![]() TIG — THE INDUSTRY GROUP — Check the specific industry group. For instance, if you are considering a trade in ATT check out the Telecommunication Long Distance Group. If you are looking at a trade in Haliburton, check out the Oil Well Drilling group. If you are looking at a trade in Harrah Entertainment check out the Gambling Group, make sure the group is moving in the correct direction, the line of least resistance to provide a profit for you on the trade you have selected.
TIG — THE INDUSTRY GROUP — Check the specific industry group. For instance, if you are considering a trade in ATT check out the Telecommunication Long Distance Group. If you are looking at a trade in Haliburton, check out the Oil Well Drilling group. If you are looking at a trade in Harrah Entertainment check out the Gambling Group, make sure the group is moving in the correct direction, the line of least resistance to provide a profit for you on the trade you have selected.
INTERNET GROUP
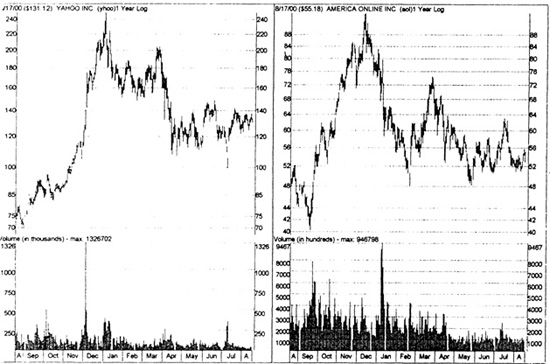
![]() TT — TANDEM TRADING—Check the stock and the Sister Stock and compare them. If you are going to trade in General Motors check a Sister Stock like Ford or Chrysler. If you are going to trade Best Buy than check out Circuit City—a Sister Stock. Tandem Trading requires the trader to place two stocks of the same group next to each other.
TT — TANDEM TRADING—Check the stock and the Sister Stock and compare them. If you are going to trade in General Motors check a Sister Stock like Ford or Chrysler. If you are going to trade Best Buy than check out Circuit City—a Sister Stock. Tandem Trading requires the trader to place two stocks of the same group next to each other.
YAHOO AMERICA ON LINE
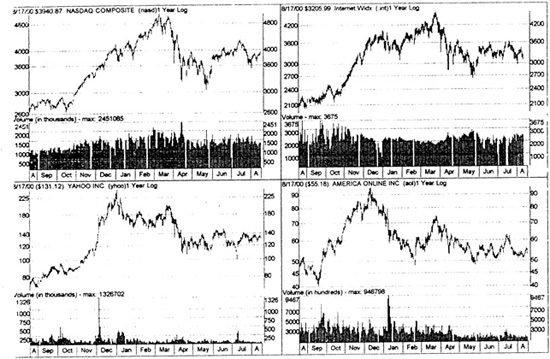
4-Do a final thorough analysis of the individual stock you have decided to trade. This is your responsibility, your obligatory “Due Diligence.” This final step would be similar to traveling down the runway-but not lift off— a final chance to change your mind before you “pull the trigger” and buy the stock. This final step must be completed by you, and you alone…make this decision on your own-it’s your money. TOP DOWN TRADING-summary chart
![]() TDT —Below: NASDAQ, Internet, Yahoo, America on Line
TDT —Below: NASDAQ, Internet, Yahoo, America on Line
![]() RPP — PIVOT POINTS — A Reversal Pivotal Point is described by Livermore as the perfect psychological moment to buy a stock-it is a reversal in trend. “A CHANGE IN BASIC MARKET DIRECTION-THE PERFECT PSYCHOLOGICAL TIME AT THE BEGINNING OF A NEW MOVE, IT IS A MAJOR CHANGE IN THE BASIC TREND.”
RPP — PIVOT POINTS — A Reversal Pivotal Point is described by Livermore as the perfect psychological moment to buy a stock-it is a reversal in trend. “A CHANGE IN BASIC MARKET DIRECTION-THE PERFECT PSYCHOLOGICAL TIME AT THE BEGINNING OF A NEW MOVE, IT IS A MAJOR CHANGE IN THE BASIC TREND.”
7-15-99 SCHLUMBERGER LTD (SLB) 64.56
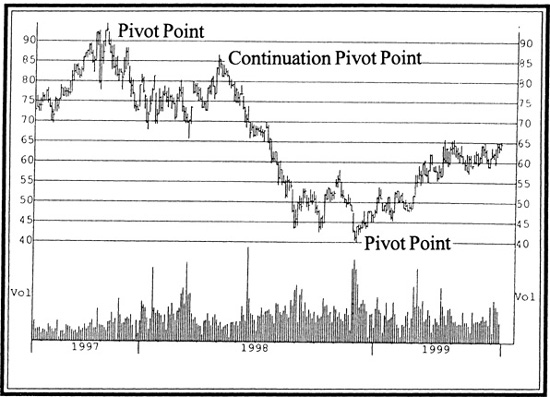
SCHLUMBERGER formed a Continuation Pivotal Point in mid-1998 when it hit $86, confirming the descent, in this case, to $40 near the end of 1998.
![]() CPP — CONTINUATION PIVOT POINT — A Continuation Pivot Point is confirmation that a move has corrected and remained in the same upward trend. This is a period of consolidation. It does two things:
CPP — CONTINUATION PIVOT POINT — A Continuation Pivot Point is confirmation that a move has corrected and remained in the same upward trend. This is a period of consolidation. It does two things:
—it confirms that the basic trend has not changed
—it provides a place to buy or to increase your existing position.
But remember, you should only increase your position after the stock has broken out on the upside.
7-15-99 SCHWAB CHARLES CORPNEW (SCH) 55.37
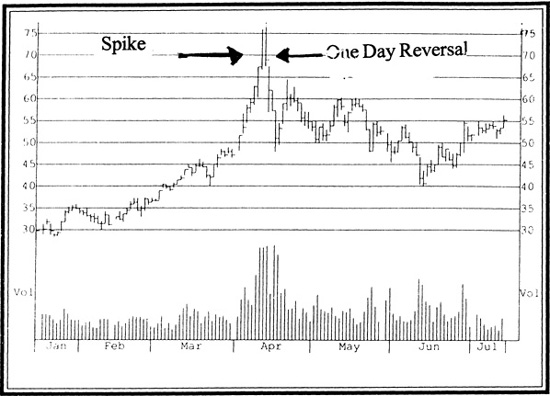
In this case Charles Schwab, a brokerage firm, had a dramatic rise of over 15 points in 3 days that developed into a spike. During the last day of the ascent the rally breaks down near the end of the day and the price of the stock falls and closes near the low of the day. The next morning it opens and falls further. These one-day reversals are often accompanied by increased volume. This scenario was a screaming “danger signal” to Livermore.
![]() S — SPIKES — A Spike is a series of dramatic rises at the end of a move—three successive days or more with a dramatic increase in the price of a stock accompanied by heavy volume-this is a warning and in all likely hood is not good news.
S — SPIKES — A Spike is a series of dramatic rises at the end of a move—three successive days or more with a dramatic increase in the price of a stock accompanied by heavy volume-this is a warning and in all likely hood is not good news.
![]() DR—ONE DAY REVERSAL — I define it as: “A One Day Reversal occurs where the high of the day is higher than the high of the previous day, but the close of the day is below the close of the previous day and the volume of the current day is higher than the volume of the previous day. Beware!”
DR—ONE DAY REVERSAL — I define it as: “A One Day Reversal occurs where the high of the day is higher than the high of the previous day, but the close of the day is below the close of the previous day and the volume of the current day is higher than the volume of the previous day. Beware!”
7-15-99 GENERAL MOTORS CORPORATION (GM) 68.06
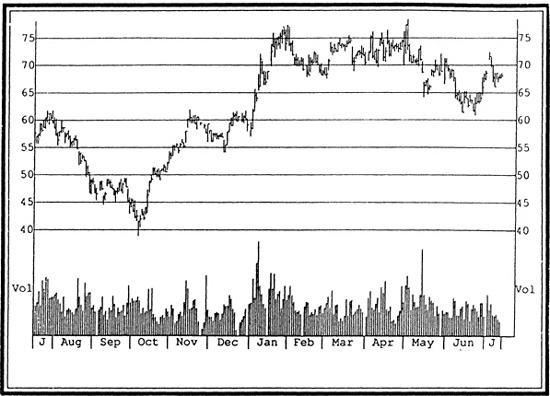
From January until early May GM traded in a base between 70 and 75
![]() BOCB-BREAKOUT FROM A CONSOLIDATING BASE — A breakout from a consolidating base pattern on heavy volume is usually a signal of a coming move in the stock. The consolidating base patterns can take various forms.
BOCB-BREAKOUT FROM A CONSOLIDATING BASE — A breakout from a consolidating base pattern on heavy volume is usually a signal of a coming move in the stock. The consolidating base patterns can take various forms.
![]() BONH — BREAKOUT ON A NEW HIGH — Be alert for a breakout on high volume that establishes a clear new high on a stock. The logic for this was explained in the previous text-when a stock makes a new high it means that it has powered through the overhead supply. Many people buy a stock at its high and as it declines they will not sell, waiting instead for a rally to put the stock up to the point where they purchased the stock. They wait and wait and when the stock finally gets up into the area of the old high, a tremendous amount of distribution usually takes place as the shareholders sell their positions until finally the skies clear and the stock breaks through and climbs to a new high where there is no stock overhanging the market. This pattern also proves that the stock had enough interest and demand to clear up the old stockholders and climb higher.
BONH — BREAKOUT ON A NEW HIGH — Be alert for a breakout on high volume that establishes a clear new high on a stock. The logic for this was explained in the previous text-when a stock makes a new high it means that it has powered through the overhead supply. Many people buy a stock at its high and as it declines they will not sell, waiting instead for a rally to put the stock up to the point where they purchased the stock. They wait and wait and when the stock finally gets up into the area of the old high, a tremendous amount of distribution usually takes place as the shareholders sell their positions until finally the skies clear and the stock breaks through and climbs to a new high where there is no stock overhanging the market. This pattern also proves that the stock had enough interest and demand to clear up the old stockholders and climb higher.
7-15-99 BEST BUY INC (BBY) 76.18
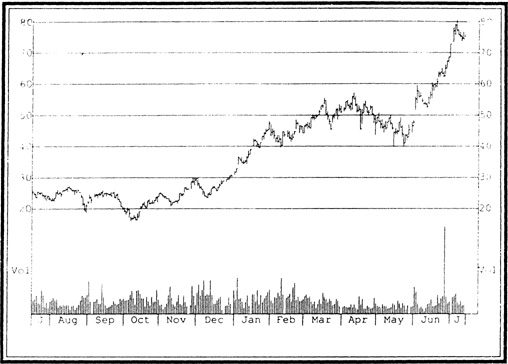
Best Buy, a consumer retailer of electronics, appliances, and entertainment software, broke out of a long consolidation at $30 in December of 1998 and kept right on climbing to new highs.
![]() BV—BIG VOLUME — Volume was a key indicator to Livermore as it should be to any successful trader. Volume represents the number of shares being traded in a particular Market (Dow, Nasdaq) or Industry Group, say telecommunications or a particular stock. It is simply an indicator of supply and demand. If the volume increases in an upwardly moving Market, Industry Group or Stock it means that there is accelerated interest in the situation and it is being accumulated. And conversely, if a stock is in a downward trend and it is hit by heavy volume it means that the stock is being sold and therefore distribution is occurring. The volume should be checked on both a daily basis and a weekly basis.
BV—BIG VOLUME — Volume was a key indicator to Livermore as it should be to any successful trader. Volume represents the number of shares being traded in a particular Market (Dow, Nasdaq) or Industry Group, say telecommunications or a particular stock. It is simply an indicator of supply and demand. If the volume increases in an upwardly moving Market, Industry Group or Stock it means that there is accelerated interest in the situation and it is being accumulated. And conversely, if a stock is in a downward trend and it is hit by heavy volume it means that the stock is being sold and therefore distribution is occurring. The volume should be checked on both a daily basis and a weekly basis.
Livermore began to closely watch a stock if the volume increased fifty percent above the normal weekly volume. He could calculate this figure in his head. He had the daily closing volume numbers of the stock he was watching posted in a book by Harry Dache,’ his office manager.
7-15-99 CAPITAL ONE FINANCIAL CORP (COF) 48.93
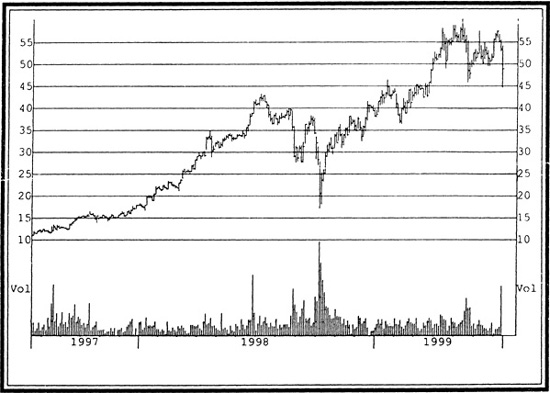
Note Example: Capital One Financials’ terrific volume, and spike down, in early October shows a clear “high-volume climax-bottom” that indicates the downward trend has changed. Be alert that VOLUME is often a key confirming signal to indicate a change in direction.