CHAPTER 8
Trend Retracements
As for trend breakouts, there are seven basic rules you must follow for trend retracements.
We have some additional parameters that I have added. Throughout my career many trend followers have used the concept of multiple time frames. Trend followers from David Harding from Winton to Don Steinitz to Alexander Elder are proponents of multiple time frames. You want to be in sync with a time frame one step higher.
For example, if you are trading daily bars, you want to look at the weekly bars direction. If you are day trading and trading hourly bars, you want to look at daily bars to determine trend direction.
■ Don Steinitz's Approach
Don Steinitz's approach, discussed in “Improving the Odds by Trading Multiple Time Frames” article, is very clear. He presents the laws of multiple time frames, as outlined below:
■ Alexander Elder's Approach
Elder's approach is similar. He looks for retracements within the larger trend. His methodology is called the triple screen and is a good basis for a trend follower to use as well as his Force Index for retracements.
However, in order to complete the whole trading plan, I strongly suggest adding the risk management rules that I have been referring to throughout thisbook.
■ Step 1: Identify the Trend on the Higher Time Frame
One of the easiest ways to identify the trend on the higher time frame is to use the weekly MACD. You can see, quantitatively or numerically, the increase or decrease in the MACD. As well, you can also use a 20-period exponential moving average. Either way, it is your personal preference. The premise is to easily identify the trend on the higher time frame. It should be easily visible.
Examples of Trend Retracement
An Example of Trend Retrecements are demonstrated in this weekly crude oil chart.
Weekly Crude Oil On the weekly chart shown in Figure 8.1 you see, even from a distance, a strong downtrend.
FIGURE 8.1 Strong Downtrend in the Weekly Chart
MetaStock®. Copyright© 2012 Thomson Reuters. All rights reserved.
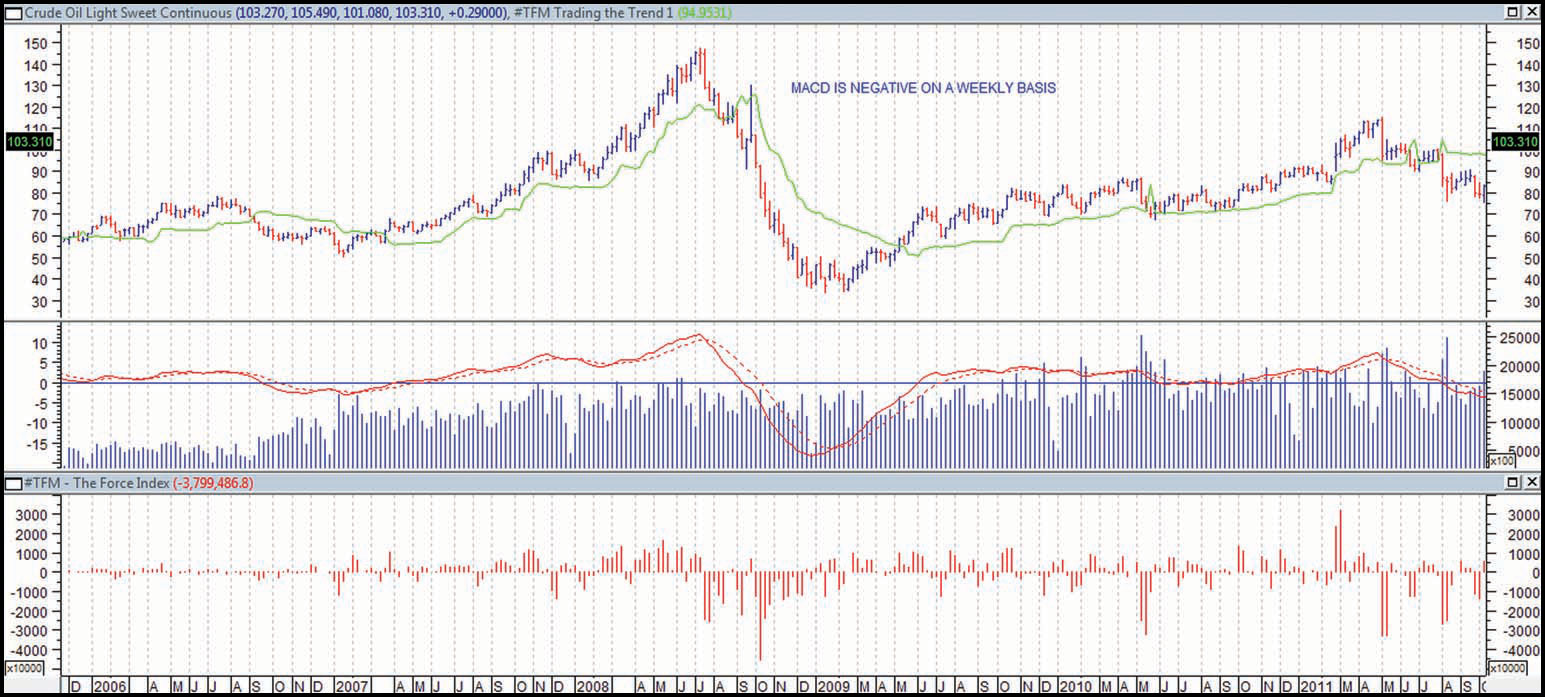
The MACD is negative and below the zero line. The trend is down.
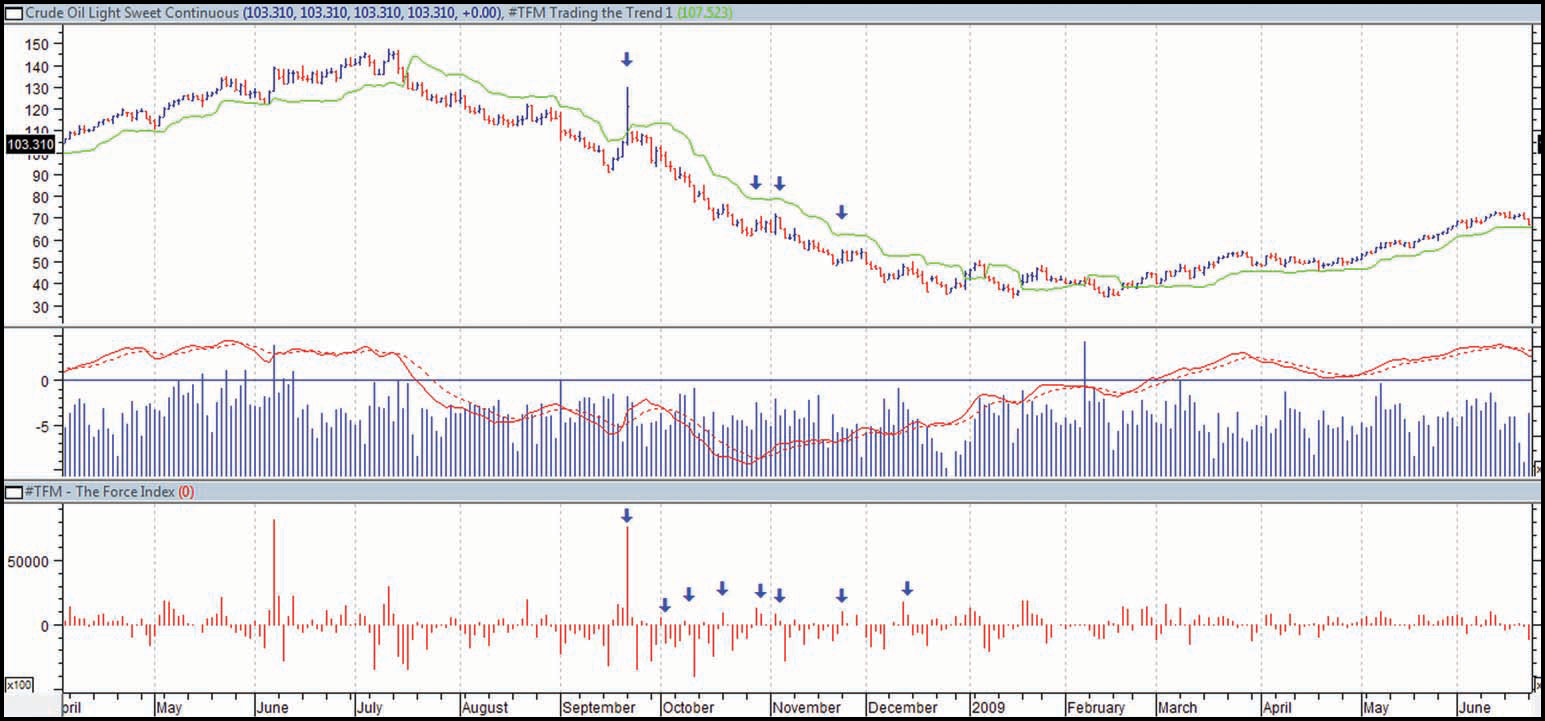
Daily Crude Oil On the daily crude chart in Figure 8.2, you will notice the MACD is below the zero line and negative. Highlighted with the red arrows are points in time when crude is retraced. On the second pane is an indicator called the Elder Force Index. This oscillator demonstrates the pullback. These retracements become potential entry points to get in with the trend if these pullbacks fail and the trend continues negatively.
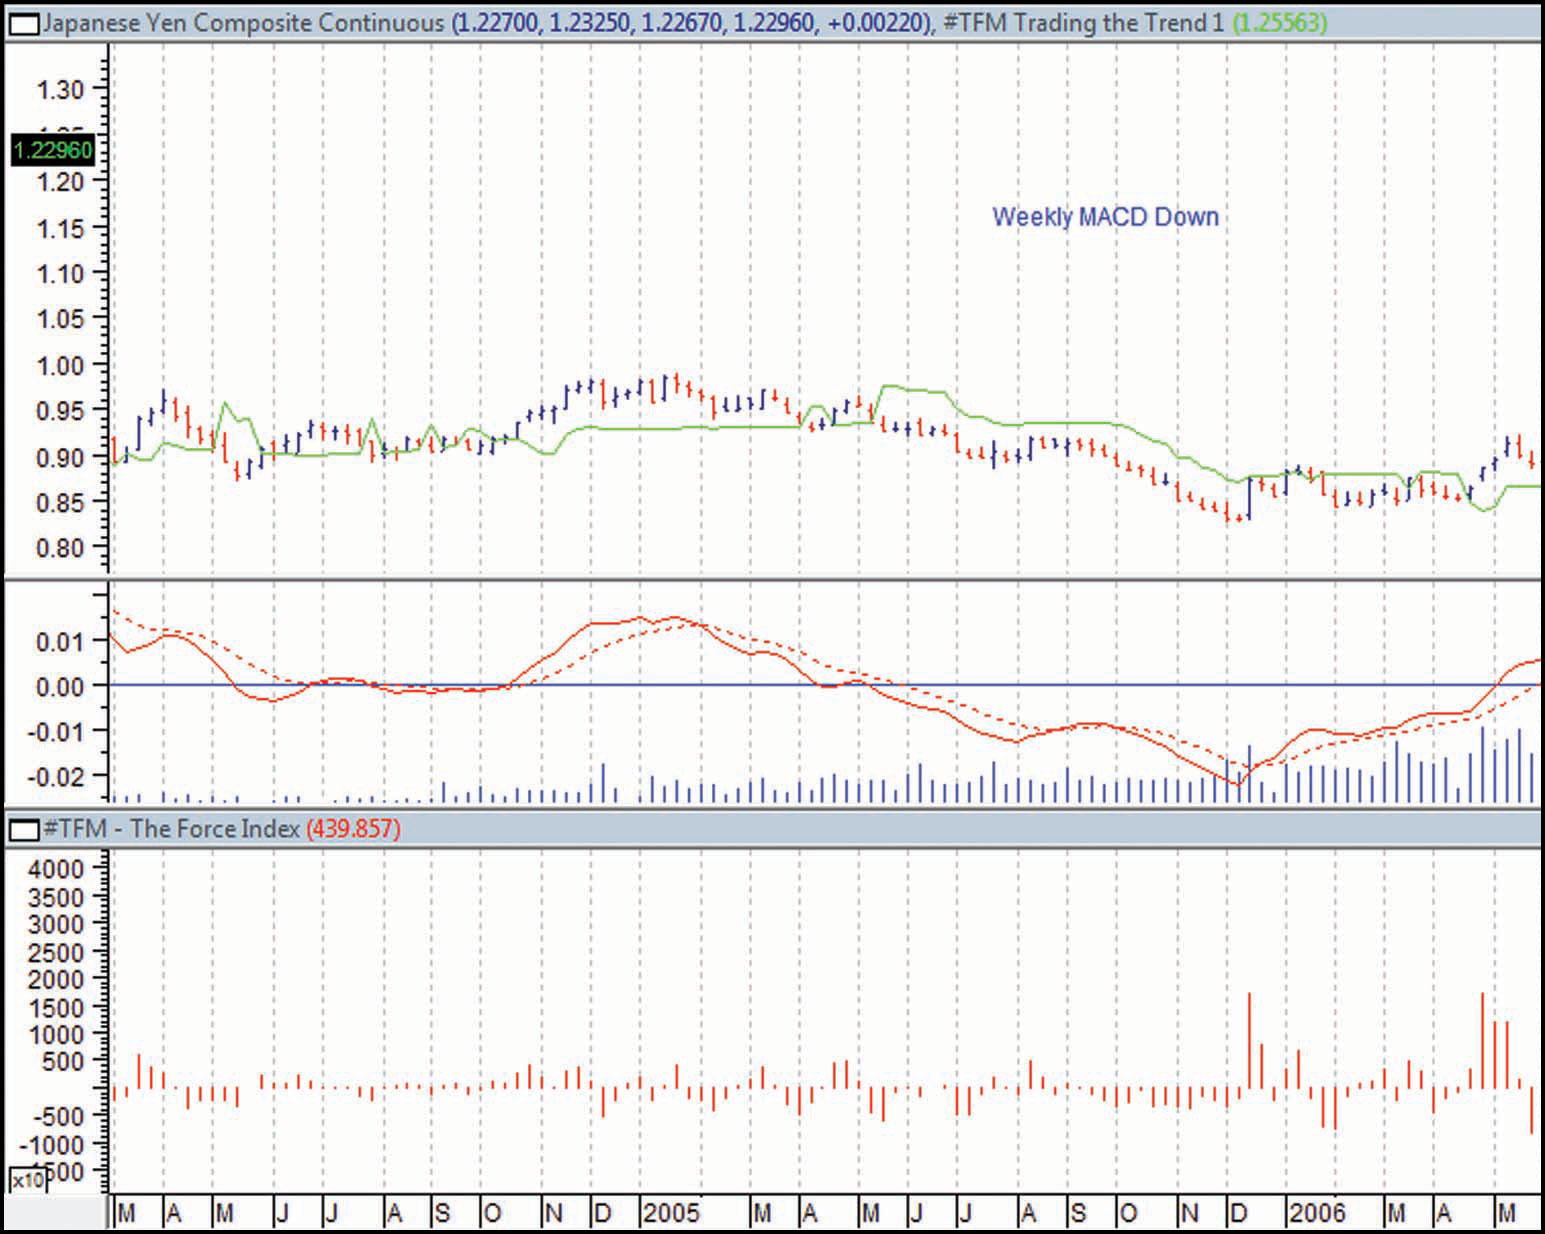
Weekly Yen As you can see, from late 2005 till 2007 the yen was in a strong downtrend (Figure 8.3). This is evidenced by the MACD being below zero.
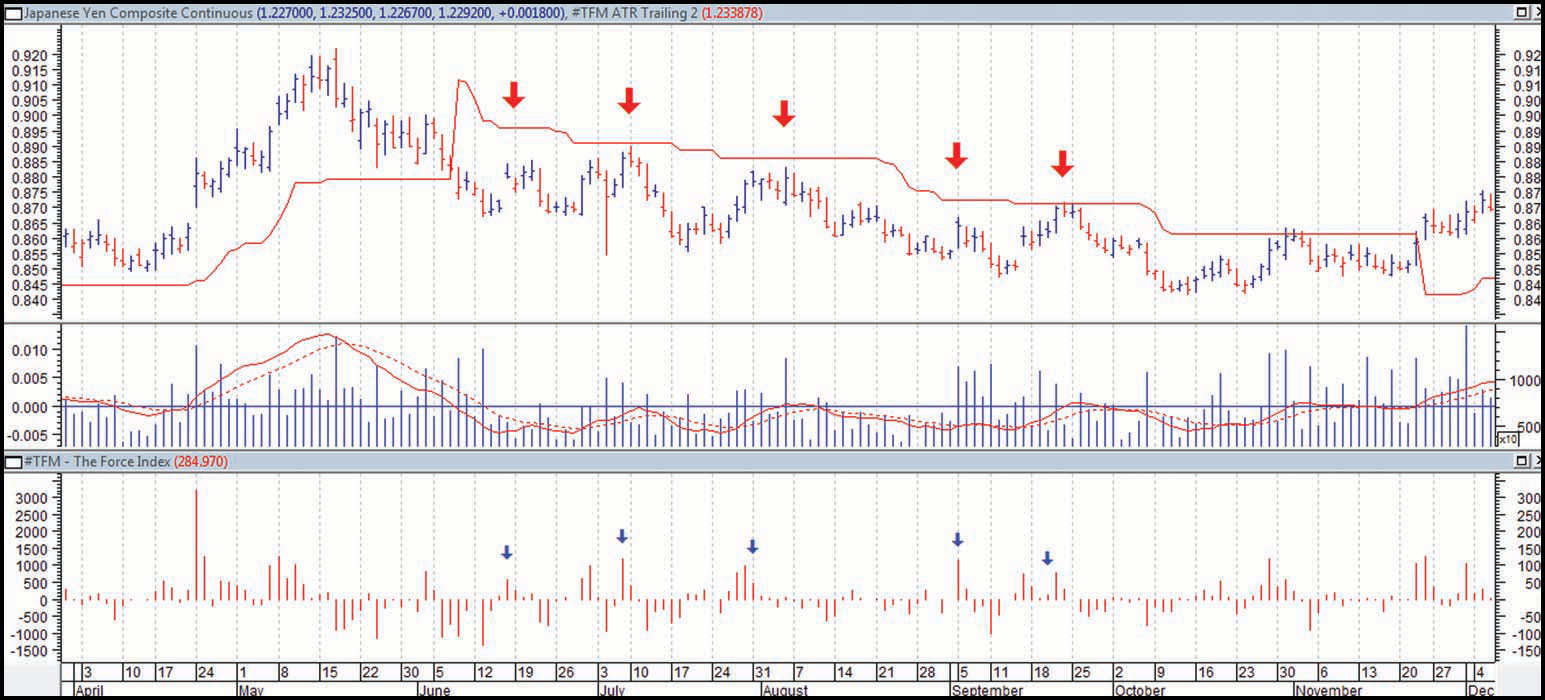
Daily Yen You will notice on the daily chart in Figure 8.4 that in June, July, and September there were some strong upward retracements on the weekly charts. These are potential entry points. It is not known if the trend is ending or if this was a retracement. These retracements can be used for possible trend short entries.
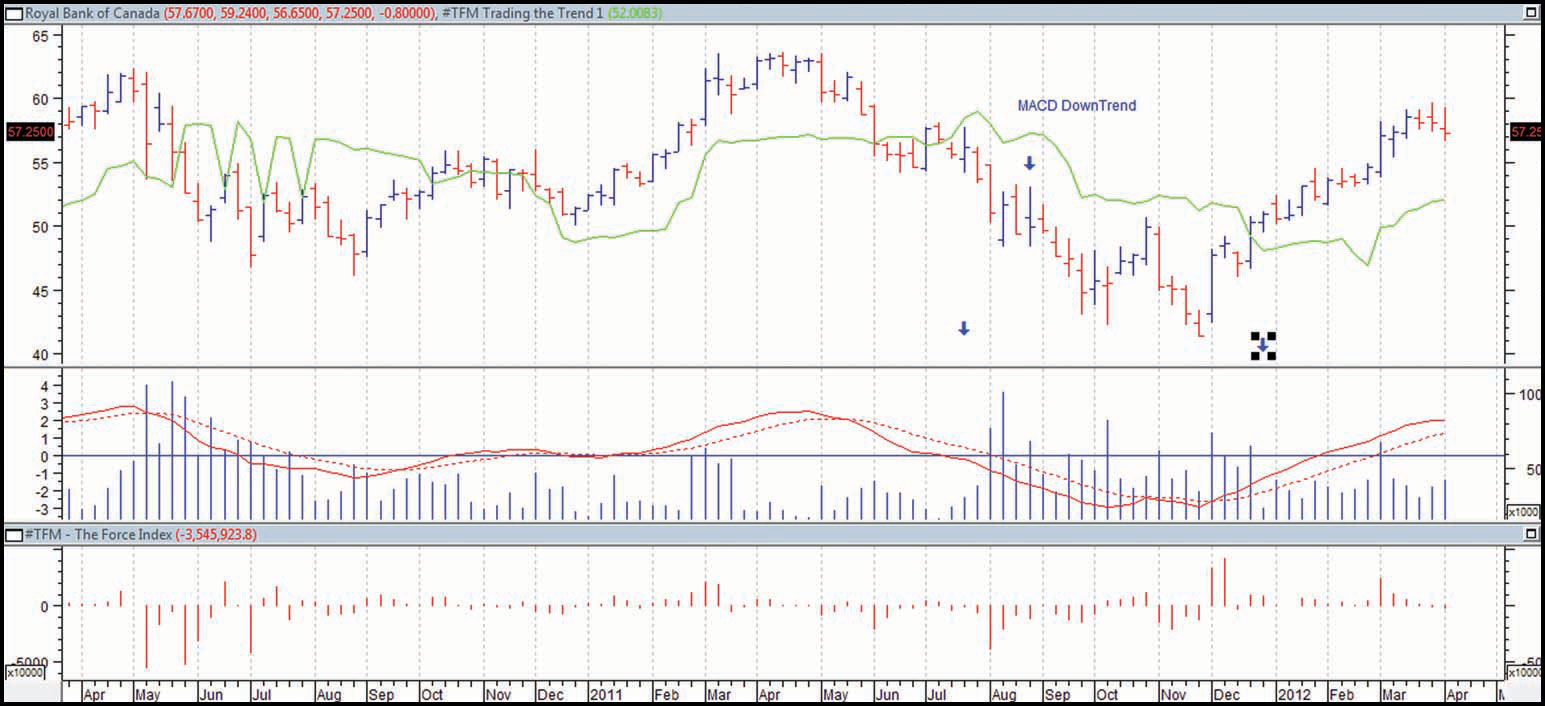
Weekly Royal Bank of Canada You can see from Figure 8.5 that in 2011 there was a strong downtrend noted by the MACD.
FIGURE 8.5 Weekly Royal Bank of Canada
MetaStock®. Copyright© 2012 Thomson Reuters. All rights reserved.
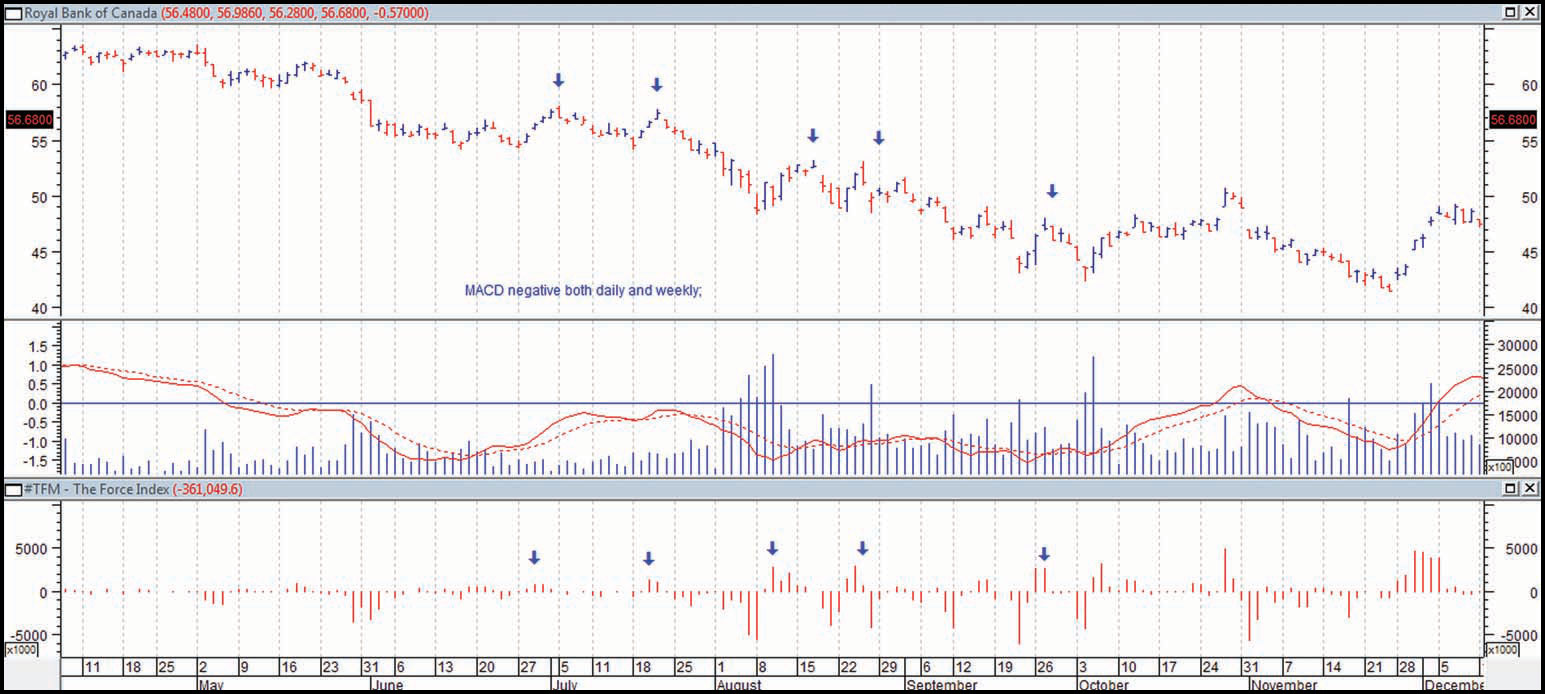
Daily Royal Bank of Canada You will notice within the downtrend there were some retracements as noted by the down arrows (Figure 8.6). Furthermore, you can look at the middle retracement oscillator indicator for moves above the zero line. These were potential entry points to go short.
FIGURE 8.6 Daily Royal Bank of Canada
MetaStock®. Copyright© 2012 Thomson Reuters. All rights reserved.
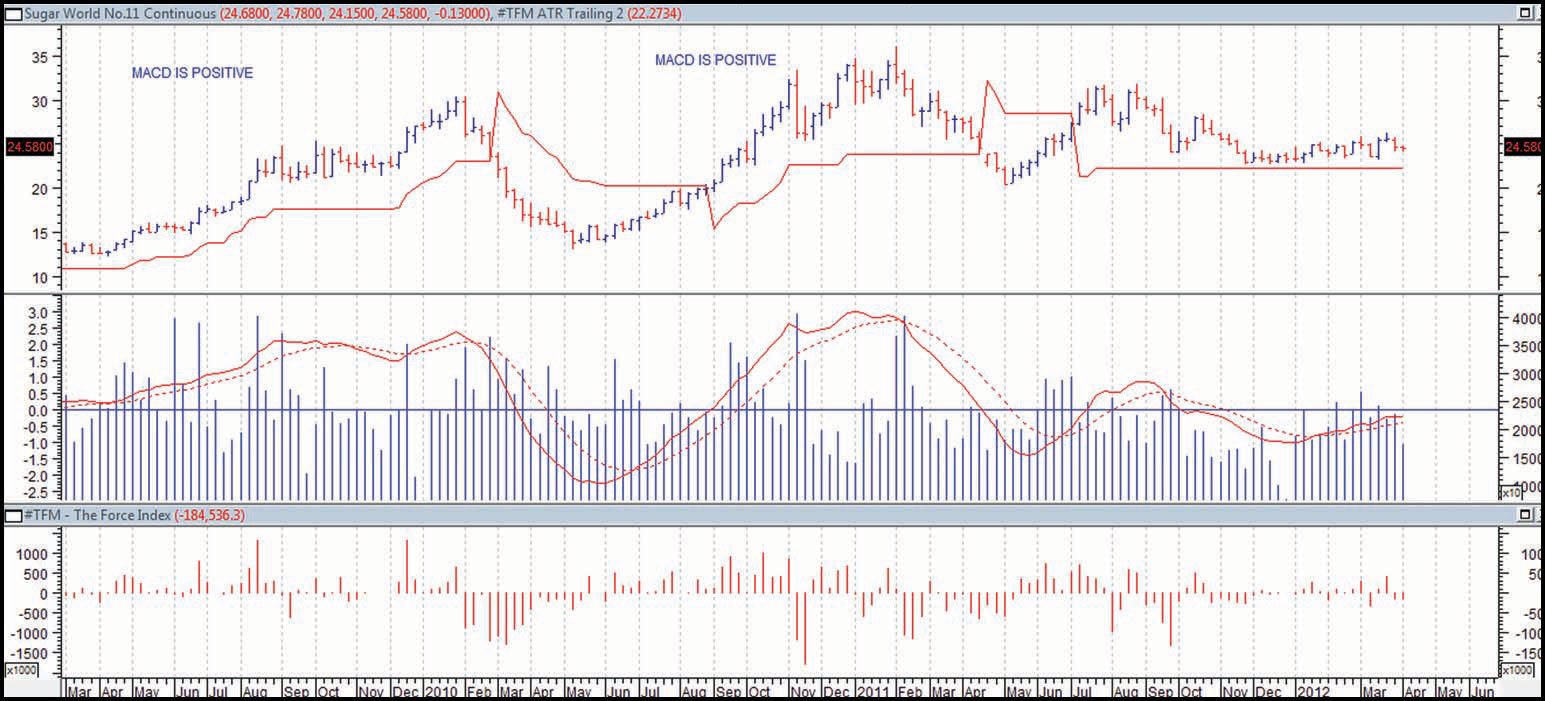
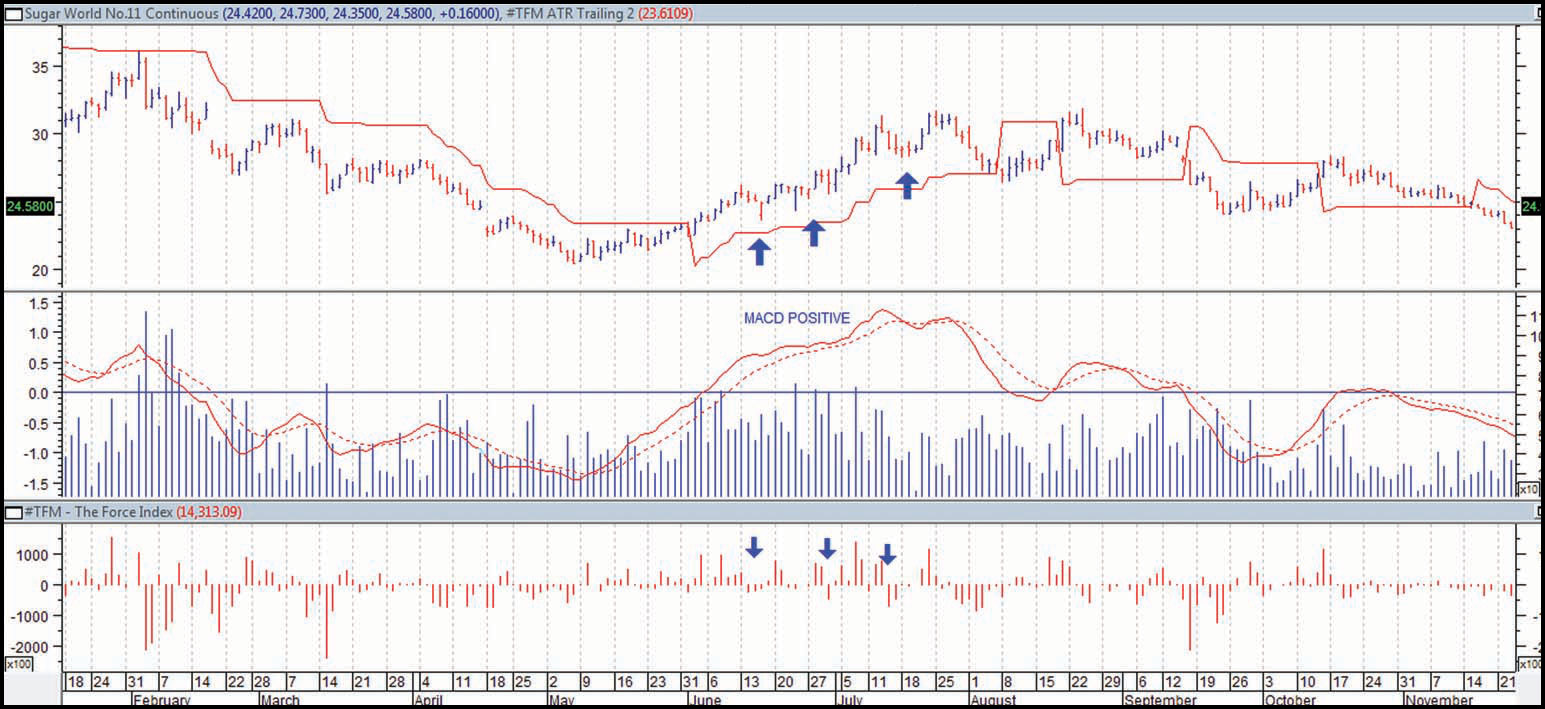
Weekly Sugar Sugar was in a strong uptrend as evidenced by the weekly MACD, shown in Figure 8.7.
Daily Sugar As noted by the up arrows in Figure 8.8, there were pullbacks on a daily chart. Note on the retracement oscillator points in which it fell below the zero line (August and October). These were potential points at which to start looking for a long trade.
■ Step 2: Identify the Retracement/Pullback
The basis is that if you are looking for a long trade, you want to see that on the higher time frame it is trending positively, yet on the lower time frame there is a pullback and slight downtrend. This retracement is identified by the Oscillator Rec indicator crossing the zero line and becoming negative.
Identify Long Buy Potential
Look for a weekly MACD that is positive and above the zero line.
Daily there is a pullback via the retracement oscillator when it crosses below the zero line.
Identify Short Sell Potential
Look for a weekly MACD that is negative and below the zero line.
Daily there is a pullup via the retracement oscillator when it crosses above the zero line.
The concept is similar to waves at the seashore. Within the tides you have big waves and then inside of them smaller counterwaves or tides. We want to trade with the trend and look to enter on these retracements with a low-risk trade.
These are the indications you look for in a retracement trade due to the pullback for a long and pullup for a short. You never know if it is just a retracement or if it is a change in trend. No one ever rings a bell to tell you there is a change in trend. You need to ask yourself how much you are willing to lose to see if the trade will work.
■ Step 3: Putting the Trade On
As we do not know if the trend is reversing or retracing, we want to be pulled into the trade if it starts retracing back in the direction of the trend as identified on the higher time frame.
For Buys
We put in a buy stop one tick or .001 percent above the high of the prior two bars. We want the market to show us it wants to continue back in the direction of the higher time frame. If prices continue to fall, our buy stop will not be filled. If we do not get filled, then on the next bar put the buy stop one tick or .001 percent above the high of the prior two bars. We continue lowering our buy stop at each bar until either we are stopped in or if on the higher time frame the MACD reverses and our buy stop is cancelled.
Baidu Baidu was in an uptrend on the weekly bars, yet there was a pullback on the daily toward the end of February (Figure 8.9). Note on the Retracement Osc indicator toward the end of February the Retracement Osc turned negative as noted from two red bars. For two consecutive days we tried to enter the trend. Eventually, when the trend resumed, we were pulled into the trade.
FIGURE 8.9 Baidu Shares Retracement Buy
MetaStock®. Copyright© 2012 Thomson Reuters. All rights reserved.

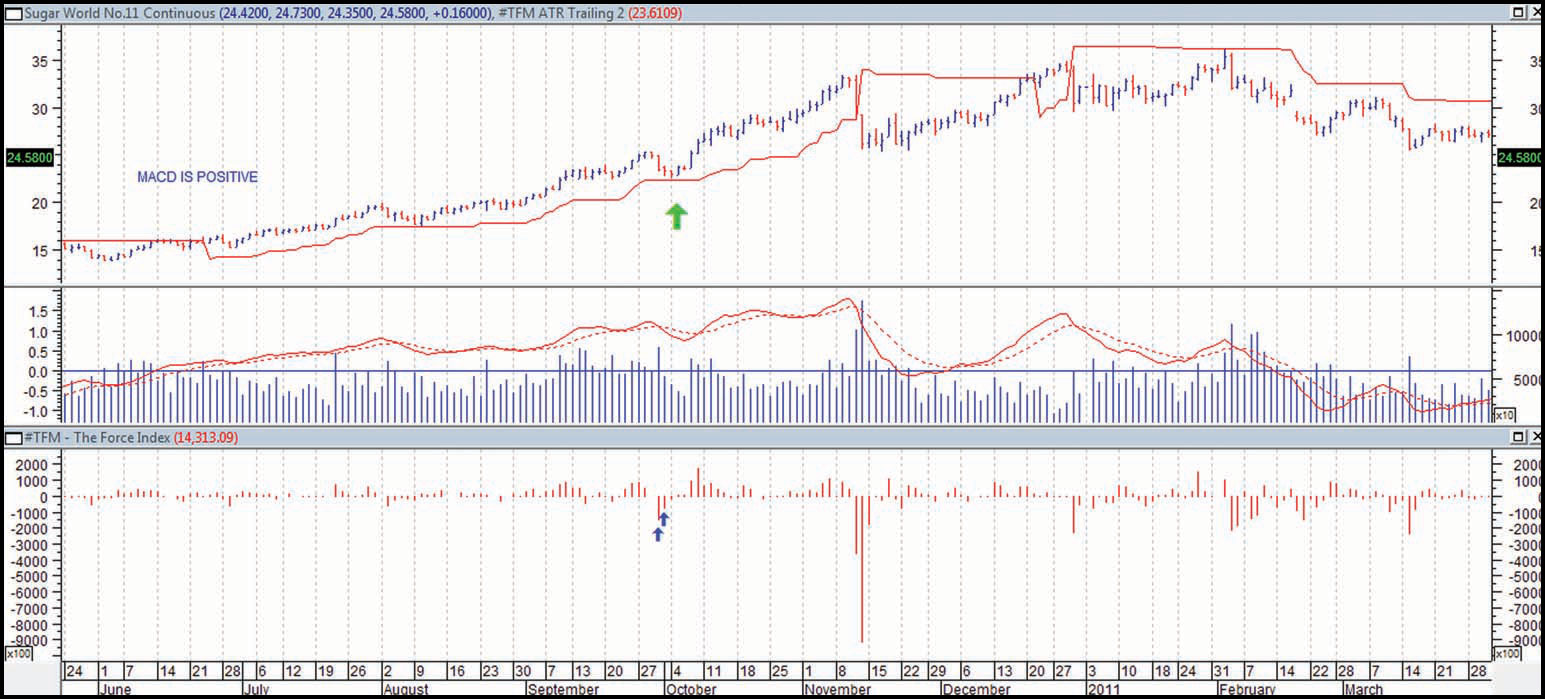
Sugar Sugar was in an uptrend on the weekly bars yet had a pullback (Figure 8.10). We were looking to go long. We kept on moving the buy stop until we were pulled back into the trade.
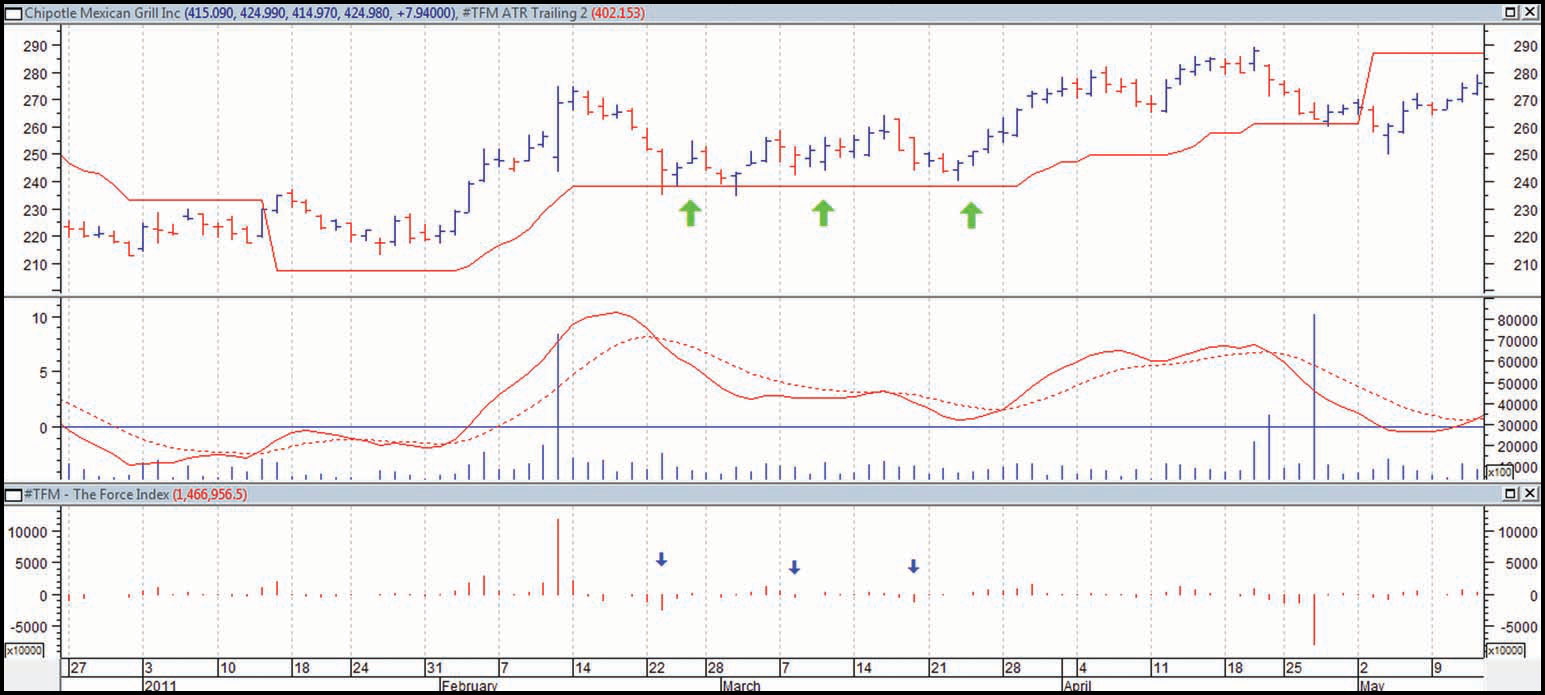
CMG CMG was up on the weekly (Figure 8.11). CMG had a pullback on the daily bars toward the end of July as noted by the Retracement Osc indicator. We looked to go long and set up our buy stops until filled.
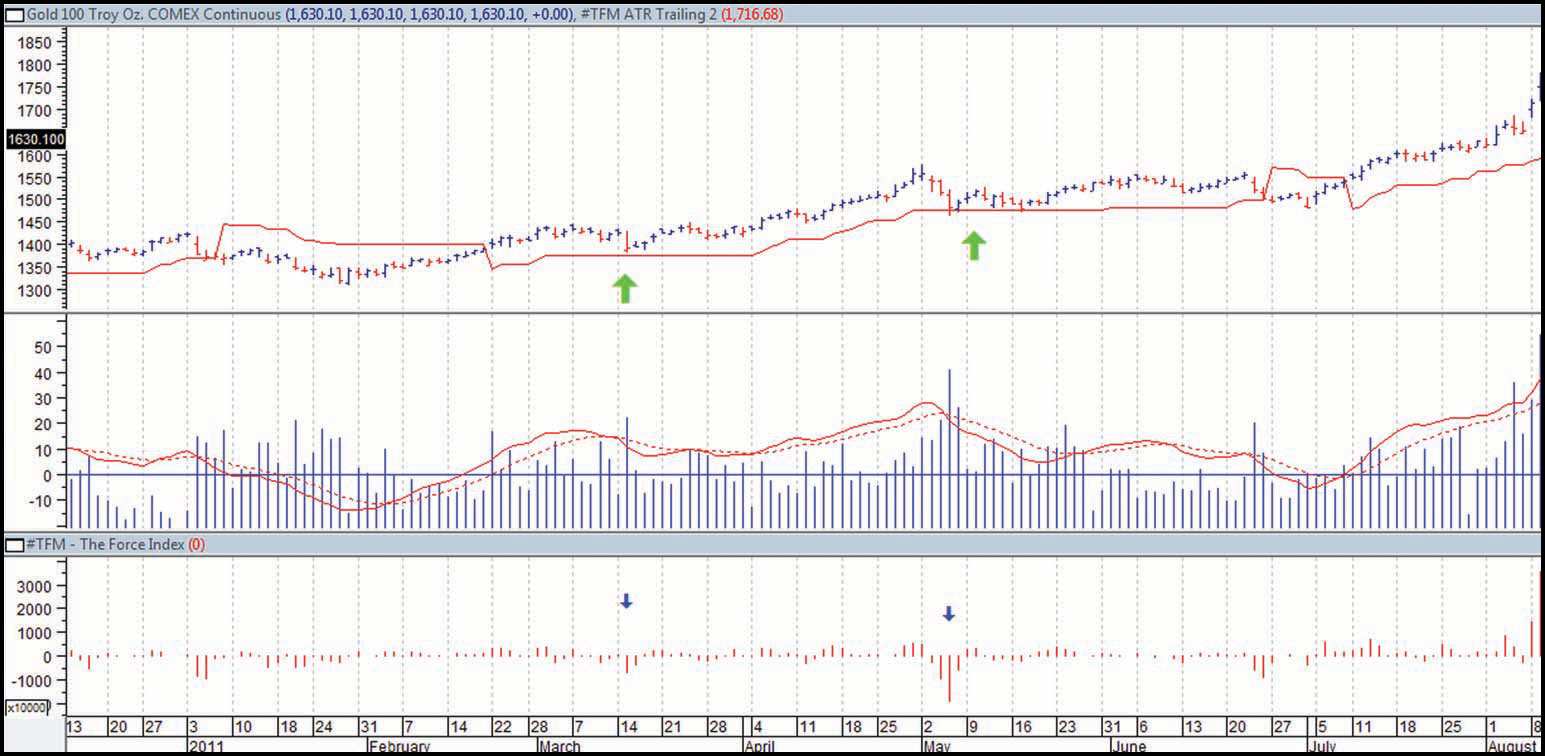
Gold Gold was in an uptrend on the weekly bars (Figure 8.12). There was a pullback on the daily bars around the beginning of May. We wanted to see if we could go long. We kept on lowering our buy stops until we were pulled into a trade. There were other points if we wanted to pyramid our positions (put on additional contracts); however, this increases both our risks and our drawdowns.
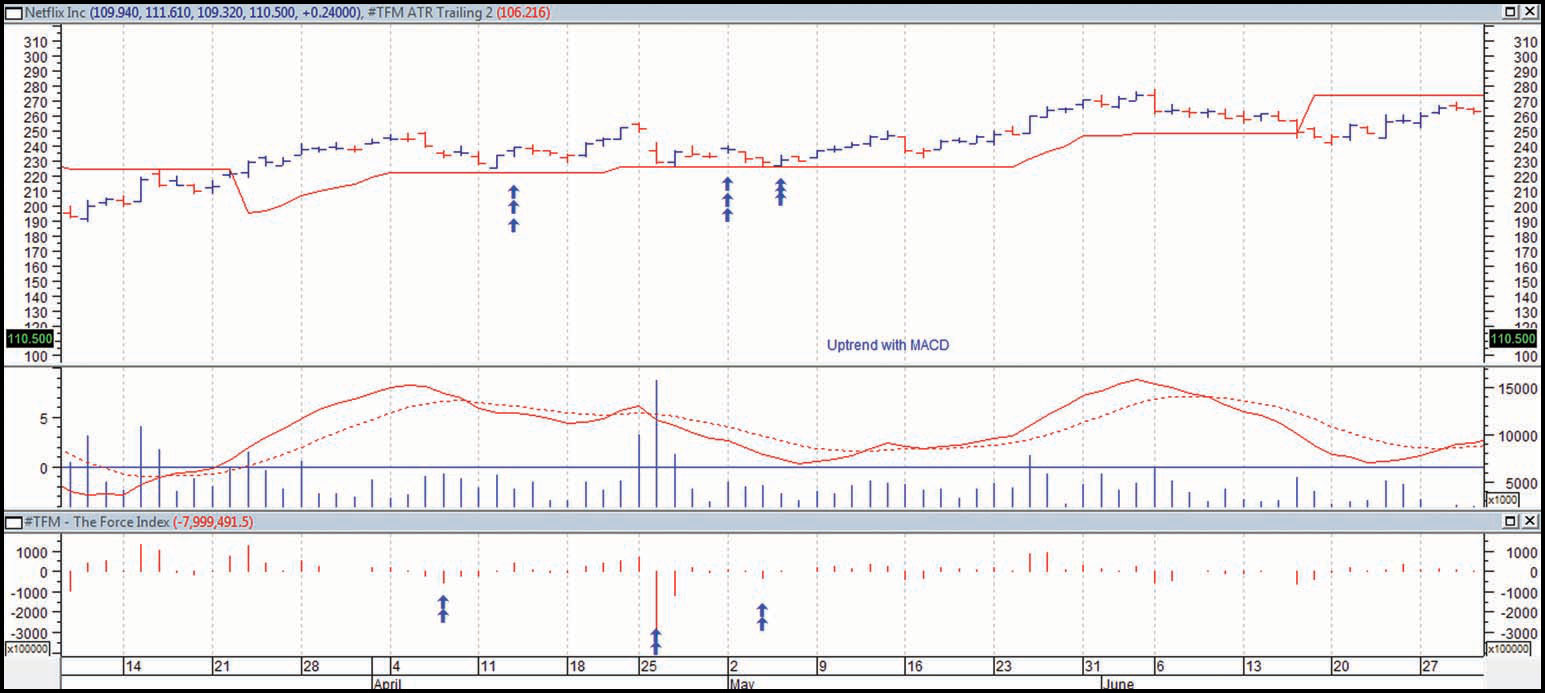
Netflix Toward the end of February Netflix started to pull back on the daily bars (Figure 8.13). The weekly was up and we wanted to put on a long trade. We noted the Retracement Osc turned negative and looked to jump in. We were taken long by the noted arrow.
For Sells
We put in a sell stop one tick or .001 percent below the low of the prior two bars. We want the market to show us it wants to continue back in the direction of the higher time frame. If prices continue to rise, our sell stop will not be filled. If we do not get filled, then on the next bar put the sell stop one tick or .001 percent above the low of the prior two bars. We continue raising our sell stop at each bar until either we are stopped in or if on the higher time frame the MACD reverses and our sell stop is cancelled.
Netflix Netflix was in a severe downtrend on the weekly (Figure 8.14). There was a retracement as noted in the Retracement Osc turning positive around November with one bar. We started looking to go short. We kept on moving our sell short stop until we were pulled into the trade.
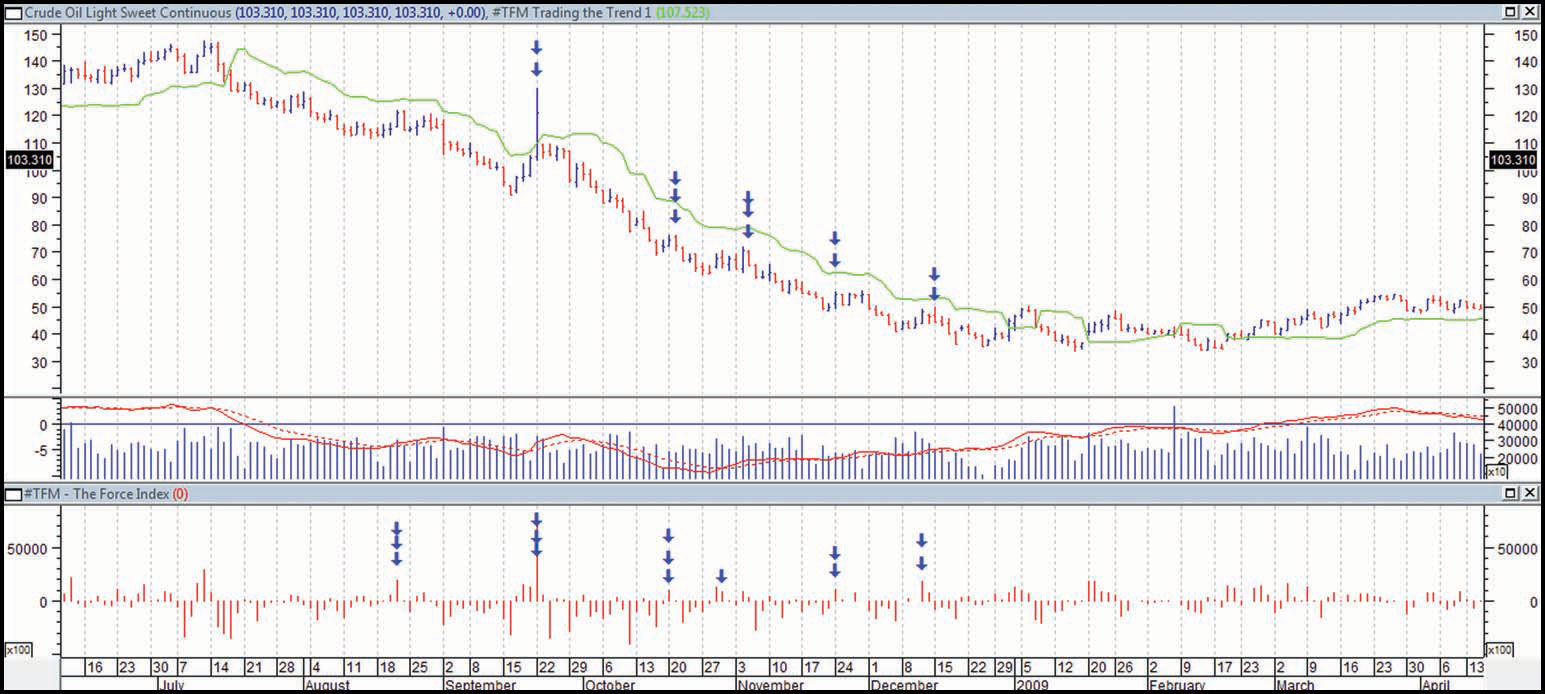
Crude Oil In the fall of 2008 crude was in a huge selloff. On the weekly charts the trend was down; however, every time the Retracement Osc crossed the zero line to the upside a potential short trade was available (Figure 8.15). The actual short entry was a sell stop at the one tick below the two bars low.
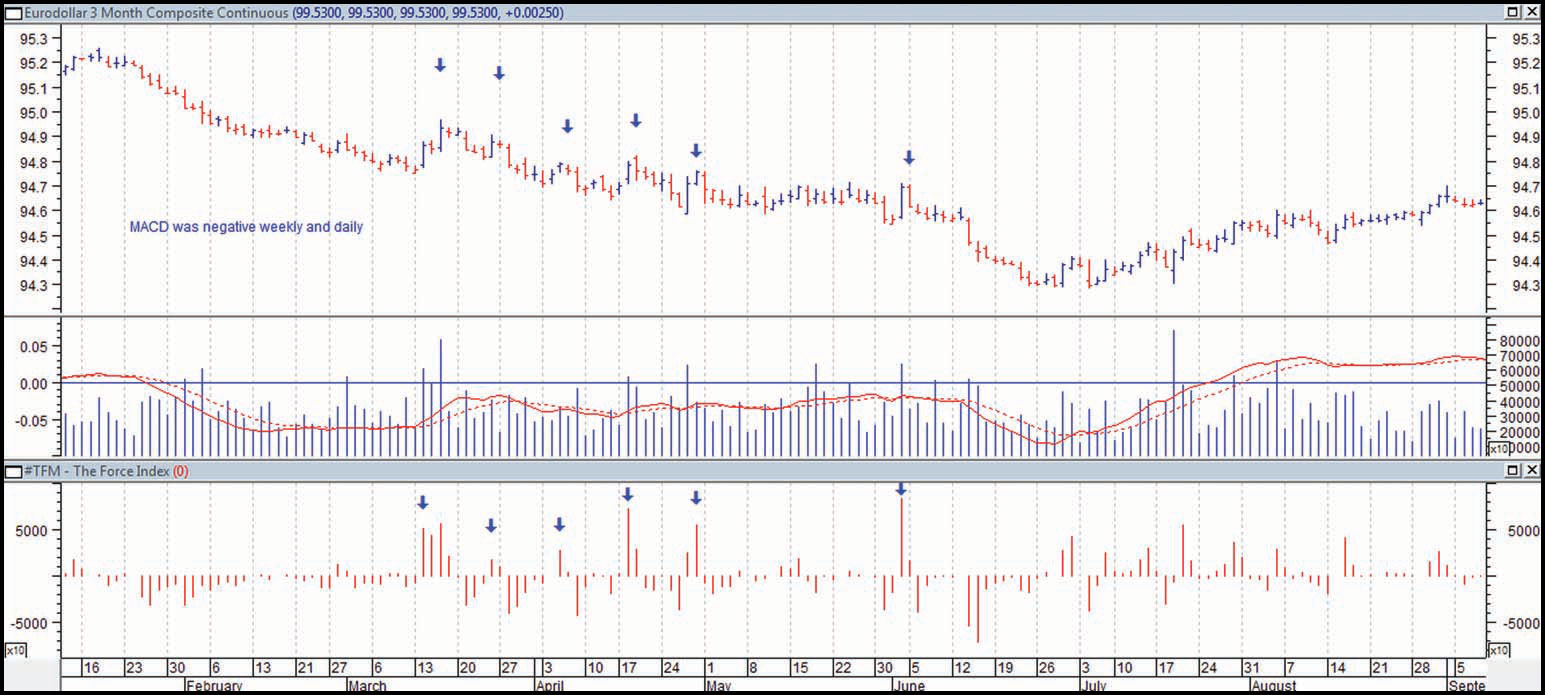
Eurodollar The trend on the Eurodollar on the weekly was negative (Figure 8.16). As evidenced by the Retracement Osc indicator when it crossed the zero line, we had a potential short trade. We would sell one tick below the low of a two-day bar. As you can see, this was a choppy period in which several of the trades did not work.
Royal Bank of Canada On the weekly chart RY was in a downtrend as evidenced by the weekly MACD (Figure 8.17). On the daily there were retracements as evidenced in the Retracement Osc that crossed the zero line. Each of these times a potential sell short was presented. A sell short was put at one tick below the two day low.
■ Summary
The summary of our discussion on trend retracement trades is as follows:
■ Protect Yourself
Now that you are in the trade, you need to protect yourself.
As in the case of the trend breakout we use two stops for our protection. We use a hard stop and if the trade starts working, we replace it with the average true range Stop, which adjusts for volatility.
For Buys
For buys the hard stop is one tick or .001 percent above the two-bar low. I prefer to use the parameter two-bar as if the trade is going to work I will be pulled into the trade. I have tried the one-bar and it has resulted in many whipsaw trades. It is too sensitive. In order to determine the position sizing we measure the entry price to one tick or .001 percent below the two-day low divided by our account size.
To determine how many shares to trade: As an example, our two-day low is $50, the buy stop is $52.10, and we are trading a $100,000 account, so we can risk 1 percent or $1,000 – $52.10 – $49.95 = $2.15 – $1,000/$2.15 = 465 shares.
If the trade starts working we have open trade profit, and we switch our stop to the trailing average true range stop. We hold our hard stop until the average true range stop is less than our hard stop. We trail the trade and have patience and discipline to see what happens.
For Shorts
For shorts the hard stop is one tick or .001 percent below the two-bar high. If the trade starts working we have open trade profit, and we switch our stop to the trailing average true range stop. We hold our hard stop until the average true range stop is less than our hard stop. We trail the trade and have patience and discipline to see what happens.
To determine how many shares to trade: As an example, our two-day high including the .001 percent is $36.80, the sell stop is $34.10 including the .001 percent, and we are trading a $100,000 account, so we can risk 1 percent or $1,000 – $36.80 – $34.10 = $2.70 – $1,000/$2.70 = 370 shares.
■ Note
1 http://www.tradingmarkets.com/.site/forex/how_to/articles/trading-with-the-trend-on-multiple-time-frames-81828.cfm.
