1 |
UNDERSTANDING THE DRUNKEN SPIDER’S WEB |
Sometimes you can solve your navigational problems with just a good map and common sense.
A case in point: Many years ago a friend and I were sea-kayaking along the storm-wracked coast of Alaska’s Kenai Fjords National Park. We had just rounded Cape Aialik and were midway through a 20-mile stretch of coastline so consistently walled with cliffs that no landing was possible. Cold rain fell intermittently from the swollen clouds only 100 feet overhead. As we headed north from the cape, we stared hard through the fog, eager to identify Porcupine Cove, the first possible landing site.
In the fog, however, all coves looked alike.
“Is that it?” Bill asked an hour after we rounded the cape. He pointed ahead to an apparent indentation in the coast that seemed, in the fog, to have all the credibility of a mirage. I had to agree that the cove looked vaguely right. I’d examined it carefully when we passed it on our way out a week earlier. Then Bill pulled out the map to double-check. “That can’t be it,” he decided.
How did he reach that conclusion so quickly? In the fog we could only guess at the cove’s outline and dimensions. Although we had been able to see snatches of the coastline as we paddled north, no other landmarks were now visible.
But Bill had landmarks in his head.
“We’ve only passed two coves so far,” he said. “This is the third. Porcupine Cove is still several miles ahead.”
That kind of navigating requires no great map-reading skills. It doesn’t even demand use of a compass. What it does require is paying careful attention to the landscape around you. Raise your eyes from the ground (or sea) 5 feet ahead and really study your surroundings! That’s the first key to successful navigating. Don’t be like the frustrated hiker I met last fall who had missed the turnoff to the Mt. Elbert trail and hiked miles out of his way. As he launched into a tirade against the forest service, as if it was responsible for his misfortune, I decided it would just add insult to injury if I pointed out that the sign marking the turnoff was 5 feet high and positioned right next to the trail.
Being aware means looking back over your shoulder as well as forward. The world looks very different heading down the trail than it did heading up. Memorize the shape of the little pinnacle that marks the point where you joined the ridge. Remember the appearance of the fallen logs that mark where the trail turns away from the sandy desert wash. You can’t count on your footprints to guide you when you return along the same trail. A group of hikers could come along, miss the junction, and walk half a mile up the wash before realizing their mistake. If you follow the main body of footprints—theirs—you’ll make the same error. Even the simplest backcountry errand can become scary if you don’t pay attention to the way back. While backpacking in Colorado’s Weminuche Wilderness, my brother-in-law, a novice backpacker, volunteered to walk down to the stream a few hundred yards away to filter water. By the time he finished, darkness had fallen. Although he had a headlamp, he still couldn’t relocate our campsite hidden in the trees. Fortunately I heard him call my name. I called back, and he quickly relocated the campsite.
Paying attention to your watch can also help you estimate your position. A simple calculation during our attempt to identify the mystery cove would have confirmed Bill’s conclusion. We’d only been paddling north from the cape for an hour. We knew from keeping track of hours and miles during the previous week that our average pace was about 3 miles an hour. Without measuring anything, we could have eyeballed the map and seen that we couldn’t possibly have paddled from Cape Aialik to Porcupine Cove in just an hour.
Map Basics
In Kenai Fjords a planimetric map would have been adequate. Planimetric maps show the world as if it were all on one plane. A gas station road map is a good example. The map always shows the ground as if the observer was directly overhead. That means a right angle on the ground (a road junction, for example) is always represented by a right angle on the map.
Equally important, 1 inch on the map always represents a particular distance on the ground. That relationship is the map’s scale. On a map of the United States, the scale might be 1 inch to every 200 miles. On a map useful for hiking, the scale might be 1 inch to every mile or three-eighths of a mile. The scale is usually expressed as a ratio, 1:24,000, for example, which means 1 inch on the map equals 24,000 inches on the ground. Don’t worry—you don’t need to figure out what fraction of a mile equals 24,000 inches. As I’ll explain in more detail later, most maps have a scale diagram that shows graphically what distance on the map equals 1 mile on the ground.
Planimetric maps, like most maps, also have a legend: a chart showing what the symbols used on the map mean. Some symbols are obvious: Irregular blue splotches are typically lakes, for example. Others, like a dashed line, can mean a four-wheel-drive jeep road on one map and a trail for hikers only on another. Knowing the symbol’s meaning can help you avoid eating road dust for lunch.
How to Read a Topographic Map
Most interesting wilderness areas are not flat. For them you need a topographic map, called a “topo” for short.
Topographic maps show the ups and downs of the terrain by means of contour lines. A contour line is a line on the map that represents the same elevation throughout its length. It may duck into canyons and bulge out around ridges, but it still marks the same elevation. The line indicating the boundary of a lake is a good example of a contour line. To “walk a contour” means to traverse across a slope without gaining or losing elevation.
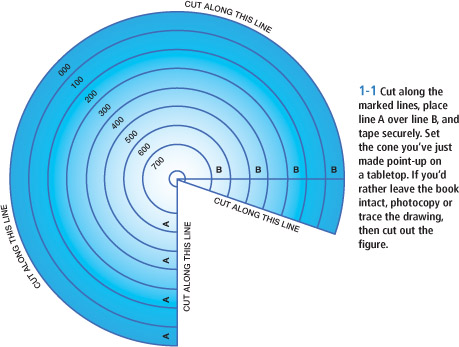
The easiest way to visualize how contour lines relate to mountains and valleys is to build a little mountain. You’ll find the materials in the form of figure 1-1.
First, cut along the outer edge of the figure, as indicated. Place line A atop line B, tape securely, and put the resulting paper cone point-up on a tabletop. Looked at from the side, it should resemble a little volcano with horizontal lines—contour lines—running across it. Each line is at the same height above sea level throughout its length. The elevation change from one line to the next is called the contour interval. On any given map it’s always the same.
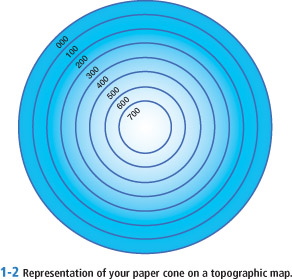
Look at the cone from directly above, as if you were in an airplane flying overhead. Notice how the contour lines form concentric circles. The biggest circle is closest to the tabletop. Successively smaller circles represent higher elevations. This view from above shows your paper volcano in exactly the same way that a topo map would depict it. Figure 1-2 shows how your cone would be mapped.
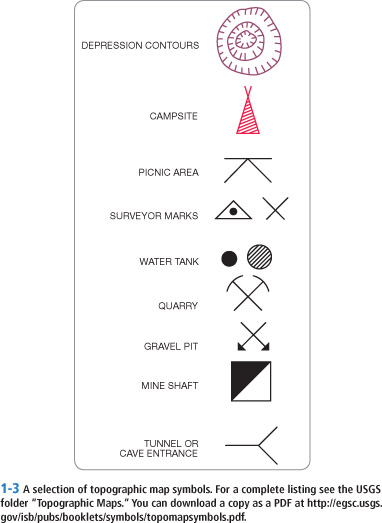
That’s the first principle of understanding topo maps: Concentric contour lines that form complete, closed paths, whether those paths constitute circles or some irregular shape, represent mountains and hills. Actually, there’s one uncommon exception. Circular or semicircular depressions in the earth are represented by similar-looking contours. To distinguish holes from mountains, mapmakers draw stubby lines perpendicular to the contours that point to the center of the depression. You can see an example in the list of map symbols in figure 1-3.
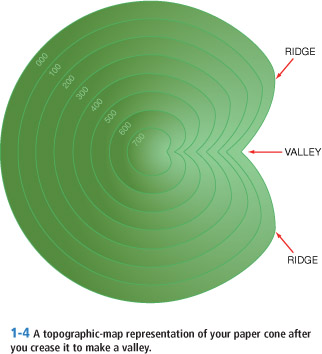
To understand how contour lines relate to valleys, look at your paper cone again. Press in slowly on one side of the cone near the bottom to create a valley. Crease the paper so the crease runs along the valley bottom. Now look down at the cone from directly overhead. Let it flatten out in your mind’s eye, as if you were looking down at a map. Closing one eye may help. Notice how the contours in the valley form V’s whose sharp tips point to higher elevations. Figure 1-4 shows how your volcano-with-valley would be mapped.
That’s the second principle of understanding topo maps: Contour lines in valleys form V’s pointing to higher ground. Sometimes the V’s are softened into U’s, but the principle still holds. Ridge contours resemble valley contours except that the contour lines generally form U’s and always point to lower elevations. On figure 1-4 arrows mark the broad ridges that enclose the valley. The presence of a blue line indicating a stream is a sure sign of a valley, but not all valleys have streams. To be certain whether a group of contours represents a valley or a ridge, you need to look for the elevations marked on the map to determine which way the land is sloping.
Look at figure 1-5. The thin contour lines are called intermediate contours. The darker, thicker contour lines are called index contours. Every fifth contour is an index contour. Index contours have the elevation they represent written on them at intervals along their length. Elevations always refer to elevations above mean sea level (the level of the sea averaged over many years and many tidal cycles). To determine which way the ground is sloping at a particular place, locate the two nearest index contours and trace them along until you come to their elevations. Once you know which way the ground is sloping, you can tell whether the bunch of U’s or V’s you’re looking at represent a ridge or a valley.
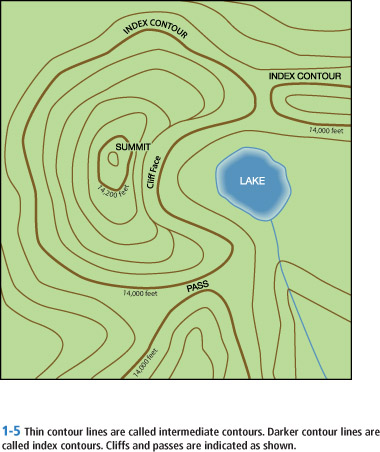
Very often you’ll see the tips of the U’s of two ridges pointing to each other. There are two examples in figure 1-5. This configuration of contour lines represents a pass or saddle. If you started high on either end of the ridge and walked downhill in the direction the contour U’s were pointing, you’d end up at the pass—the lowest point along that section of ridge.
The difference in elevation between intermediate contours—the contour interval—is always the same on any particular map. On a map showing hiking trails in Florida, the contour interval might be 10 feet; in the Alaska Range it might be 100 feet. The typical contour interval in the Lower 48 in mountainous terrain is 40 feet. Likewise, the elevation difference between index contours is also constant. It’s always equal to five times the contour interval, assuming that your mapmaker, like most, made every fifth contour line an index contour.
Whether the contour interval is 10 feet or 100, the third topo-map principle still applies: The more closely the contours are spaced, the steeper the terrain. That’s because the denser the contours, the greater the elevation change over the same horizontal distance. A vertical cliff is the most extreme example: a large elevation change over zero horizontal distance. Mapmakers depict cliffs by drawing contour lines that merge. Figure 1-5 has an example. Another principle: Regardless of the terrain’s steepness, a path straight up a slope will always be represented on a map by a straight line perpendicular to the contour lines. Or, to put it the way a skier or snowboarder might, the “fall line,” the line straight down a ski slope, would always be drawn on a map as a line that forms a right angle with each contour.
Map Series
In the United States the US Geological Survey is the prime source for paper topographic maps. Although many private companies publish maps in both printed and electronic form, they all use data from the USGS as a primary source for their products.
The USGS publishes many different series of maps, each covering a different amount of land. Those most useful to wilderness travelers are the 7.5 minute and 15 minute series. No, a 7.5 minute map doesn’t cover the amount of land you can cross in 7.5 minutes, nor does it take 15 minutes to figure out where you are on a 15 minute map. “Minutes,” in this case, refers to minutes of latitude and longitude. Sixty minutes makes 1 degree. A 15 minute map, therefore, always covers one-quarter of a degree of latitude and longitude. It takes four 7.5 minute maps to cover the area of one 15 minute map. Both 15 minute and 7.5 minute maps are often called quadrangles, or quads for short.
Lines of latitude are lines circling the globe parallel to the equator. They’re called, logically enough, parallels. One degree of latitude always equals 69 miles. Lines of longitude, called meridians, pass through the poles and form 90-degree angles with the equator. The distance between lines of longitude varies from about 67 miles at the equator to zero to the poles, where all longitude lines converge. In my home state of Colorado, a 7.5 minute map covers an area approximately 8.6 by 6.7 miles.
The area covered by the map—its series—does not dictate that any particular scale be used. However, the USGS has established some conventions about what scales will be used in each map series. All 7.5 minute maps, for example, use 1:20,000, 1:24,000, or 1:25,000. The 1:20,000 scale is used only in Puerto Rico. All 1:24,000-scale maps give elevations and distances in miles and feet. All 1:25,000-scale maps use metric units. Most 7.5 minute maps use 1:24,000, in which 1 inch equals 2,000 feet or about three-eighths of a mile.
All 15 minute series maps now use the 1:63,360 scale, in which 1 inch equals 1 mile. These maps cover 15 minutes of latitude and 20 to 36 minutes of longitude. Only 15 minute series maps are available for most of Alaska. At present only some areas around Anchorage, Fairbanks, and Prudhoe Bay are mapped at the 1:24,000 scale.
The USGS also makes maps that cover much larger areas, up to and including the entire United States. Confusingly, however, these map series are not designated by the area covered in minutes or degrees but by the scale, such as 1:100,000 or 1:250,000.
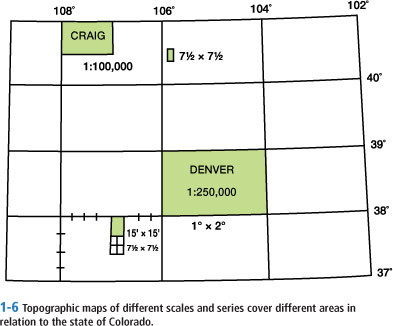
While we’re on the matter of scale, let’s get one other bit of terminology straight: small-scale versus large-scale. On a small-scale map, landscape features are shown relatively small. On a 1:250,000-scale map, for example (which uses a relatively small scale), a mile-long meadow occupies only a quarter of an inch. On a large-scale map, such as a 7.5 minute, 1:24,000-scale quad, landscape features are shown relatively large. That same mile-long meadow occupies 2⅝ inches. Figure 1-6 summarizes how much territory the different series of maps cover in relation to the state of Colorado. The 1:250,000-series labeled “Denver,” for example, covers about one-sixteenth of the state—an area of approximately 3,500 square miles. That’s a map useful for auto travel, not hiking.
It’s not important to memorize what 1 inch means in all these different scales. All USGS maps have a scale diagram at the bottom of the map that shows what distance on the map equals 1 mile on the land. Before studying a map, check the scale diagram. It will help you visualize the terrain.
Fortunately the USGS is a lot more consistent in its use of colors and symbols than it is in its use of scales in a particular series of maps. Black, for example, always indicates a man-made feature such as a road or building. Blue, logically, denotes water: streams, rivers, lakes, oceans. Brown is used for contour lines. Green indicates vegetation: brushy and forested areas. Red designates major highways. It’s also used for the boundaries of units of public land: national park boundaries, for example, or townships and sections of land. Purple indicates features added to the map on the basis of aerial photographs. Purple features have not been field-checked, which means nobody visited the site in person and verified what the aerial photograph appeared to show.
The USGS uses several dozen symbols on its maps to indicate everything from surveyor’s benchmarks to standard-gauge multiple-track railroads. Figure 1-3 shows the most important symbols for backcountry travelers. Each USGS map shows the road classification symbols. For a complete listing of map symbols, get the USGS’s folder called “Topographic Maps.” Download it at http://egsc.usgs.gov/isb/pubs/booklets/symbols/topomapsymbols.pdf.
Topo maps depict unchanging physical features very accurately. But as time passes since the date of printing, some natural features are likely to evolve. A pond, for example, may become a meadow; a glacier may advance or recede. Man-made features are also likely to change. Roads may be upgraded or abandoned. New trails may be added or old ones rerouted. If you’re visiting a national park or national forest, you may be able to keep up with that kind of change by obtaining an upto-date planimetric map from the park or national forest administration. A friendly ranger might also help you update your topo map.
You can buy topo maps directly from the USGS as well as from many outdoor specialty shops. To determine the ones you need, obtain an “Index to Topographic and Other Map Coverage” for the state you’re interested in. It’s free if you order it from the USGS. Retail stores that stock USGS maps should have a shop copy.
The index is a map of the state that shows every topo map published that covers any part of the state. (Some topos cover more than one state.) Each rectangle on the index represents a topo map. The name of the map and the date of the survey are written within the rectangle. In general the smallest rectangles on the index will be 7.5 minute maps; in Alaska they’ll be 1:63,360 maps showing 15 minutes of latitude. You can check by counting the number of rectangles between parallels of latitude. If there are eight per degree, the rectangles show 7.5 minute maps because 8 × 7.5 = 60 minutes or 1 degree. Four rectangles per degree means the maps show 15 minutes of latitude. Maps are named for some prominent feature within their boundaries. Often that will help you decide if you need that map. Indexes also show major roads, towns, rivers, and mountains, which may help you to identify which maps you need. When in doubt about a map, order it anyway. Even if your intended route doesn’t cross it, you’ll probably be looking out at those peaks and valleys when you stop for lunch on the summit. Be sure to specify the state, the quadrangle name, and the map series when ordering. In some cases a 15 minute map may have the same name as a 7.5 minute map contained inside it, which makes the series designation crucial in obtaining the right map.
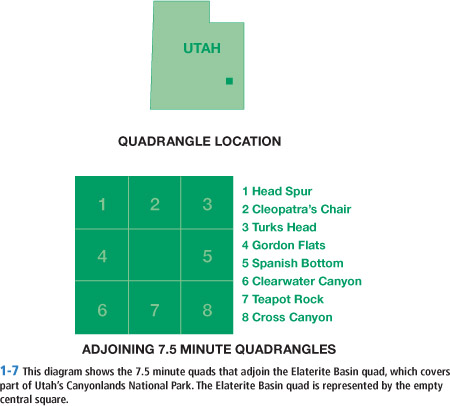
In Alaska only the 1:250,000 maps have names. The 1:63,360 maps have only letter and number designations. To order a 1:63,360 map, give the name of the 1:250,000 map that contains it, plus the letter and number. An example might be “Fairbanks D-1.” If you have a map that covers part of the territory you’re interested in, look at its margins. They’ll tell you the name of all eight adjoining maps, including those that only touch at one corner. If you don’t find the names of the adjacent maps written along the borders, look at the bottom of the map. You’ll find a diagram that gives the same information. You can see an example in figure 1-7.
You can mail-order US maps directly from the USGS and Canadian maps from the Centre for Topographic Information, a division of Natural Resources Canada; see the contact information in the appendix under Maps.
The Canada map office website provides several ways to locate maps of the region you’re interested in. You can display a map of Canada and then click on the region of interest. You can also search by geographic name.
Mail-ordering anything can be tedious, and maps are no exception. Each state index lists all map dealers in the state. You can, of course, also search in your favorite Internet search engine for “map dealers Denver” (or whatever city you’re located in). With a little luck, one will be near you. Then you can go and examine maps before buying to be sure you get the right one. Most map dealers carry compasses as well. Many also carry altimeters and GPS receivers.
State indexes also list all the special maps that cover part of the state. In Colorado, for example, Rocky Mountain National Park, Mesa Verde National Park, and Black Canyon of the Gunnison National Park, among other interesting places, all rank special maps of their own. Ordering one of them instead of four or five individual sheets can save you a lot of paperwork when you’re out in the field. The disadvantage may be that the scale is smaller.
USGS maps are not the only ones you should consider carrying. Trails Illustrated, a division of National Geographic, offers maps for popular recreation areas in thirty-five states. These maps are printed on a waterproof plastic material, so they’re much tougher than a USGS paper map, and they’re often more up to date on man-made features like roads and trails—although sometimes they simply repeat errors found on the old USGS quads. When I get particularly frustrated with some egregious error, I refer to the company as “Fables Illustrated.”
Usually Trails Illustrated maps will cover the whole region you’ll be traveling through on a particular hiking or backpacking trip, making it easier to visualize your entire route. For example, one map may cover all of a particular wilderness area. To do that, the scale must usually be smaller than on a USGS 7.5 minute quad. For example, one commonly used scale on Trails Illustrated maps is 1:40,680, or about 1½ inches to the mile. That’s great when you want an overview of the whole area but not ideal for really challenging route-finding, where I find 7.5 minute quads, with their scale of 2⅝ inches to the mile, to be essential. I always carry both kinds of maps, but then again, I’m a map junkie—I already own over 160 7.5 minute quads, and I add to my collection regularly.
Using Maps to Plan Your Trip
Detailed maps are vital in the field, but they’re also essential for planning your trip before leaving home. For planning purposes, electronic maps that you can display and manipulate on your home computer are ideal. You can buy maps on CD or download them for a fee. Products from National Geographic, sold under the Trails Illustrated or Topo brand, contain maps at various scales, from an entire state right down to the 7.5 minute USGS quads that are the most detailed available. They also contain the relevant Trails Illustrated maps. Using your mouse, you can draw routes and have the software instantly calculate distance, total elevation gain and loss, as well as net gain or loss. All maintained trails are marked, of course, but not the more technical climbing routes. The routes you draw will snap to nearby trails if the map view you’ve chosen is one of the Trails Illustrated maps. You can add notes, complete with photos, that optionally include the exact location and elevation of the note. And you can save maps with the routes and notes you’ve created.
GPS receivers merit an entire chapter of their own, but I’ll briefly mention here how computerized maps interact with them. For starters, you can create GPS waypoints simply by clicking on the map. You can then upload those waypoints directly to your receiver. This is vastly easier than adding waypoints to your receiver by measuring the UTM coordinates of each waypoint on a paper map, then punching all fifteen digits for each waypoint into your receiver. You can also download waypoints and tracks to your computer and save them. That way you can delete unneeded waypoints and routes from your receiver without losing them permanently and then upload only those you need for a particular trip, so you’re not wading through dozens of irrelevant choices trying to find the correct waypoint for the next leg of your journey.
You can even connect your GPS receiver to a copy of your mapping software running on a laptop and have the software display your position on the map in real time. This could be useful if you were trying to locate a trailhead, for example. Don’t try to do this while driving! Pull over and check the map, or better yet, have a passenger handle the navigation chores.
I’ll explain the relationship between computerized maps, paper maps, and GPS receivers in more detail in Chapter 7, but there is one potential pitfall I’ll mention here. USGS maps, and the maps derived from them, are all based on a particular coordinate system called a datum. The datum specifies both a reference point from which measurements within the coordinate system are made and, often, a mathematical model of the shape of the Earth. The datum each map uses is printed in the lower-left corner. Many USGS 7.5 minute quads use NAD 27, which is short for North American Datum 1927. Computerized maps may by default use NAD 83, the North American Datum 1983, or WGS 84 (World Geodetic System 1984), which is essentially identical to NAD 83. Many GPS receivers use WGS 84 by default.
To avoid confusing yourself, be sure that the map datum you set in your mapping software and on your GPS receiver is the same as the map datum used by your paper topographic map. If you don’t, the waypoints you create in your mapping software, then transfer to your GPS receiver, and finally try to plot on your paper map may be off by several hundred yards. The problem becomes most obvious if you try to plot a position fix given by your GPS receiver onto a map with a different datum. In a worst-case scenario, your true position may be south of your tent, but when you plot your location on your map, it shows you that you’re north of your tent. That kind of error could be serious if you’re trying to relocate your tent at night or in a blizzard.
As a planning tool, a computerized map is hard to beat, but it does have one big limitation. While you can print maps, you’re limited to printing maps no bigger than your printer can handle—normally 8½ × 11. If you print the map at a scale of 1:24,000, the standard scale on 7.5 minute USGS quads, the map only covers an area measuring 3 × 4 miles. You can print at a smaller scale, of course, which will include more area, but then you may not have the detail you need for tough route-finding. I love computerized maps for planning purposes, but I always carry full-size maps from the USGS and Trails Illustrated when I’m in the field.
Calculating Distance and Travel Time in the Field
Planning your trip in advance is always essential, but what if you change your mind about your route once you get in the field? You’ll want to be able to calculate travel time on the fly. And even more important, you’ll want to know if it’s feasible to take the route you’re contemplating.
If a maintained trail leads to your destination, then all you need to know is the time required. That is primarily controlled by two factors: horizontal distance and elevation gain or loss.
First, calculate the horizontal distance. A ruler makes it easy to measure the straight-line distance, but trails never run straight. In fact, they’re notorious for taking a lot more miles to reach a destination than the straight-line distance would indicate. The low-tech way to calculate distance along a trail is to use a bit of nonelastic string or a pipe cleaner. Place one end of the string on the trailhead, and then trace the trail with the string, following the trail as it twists and turns. Use your thumbnail to mark the point where the string crosses your destination; then bring the string down to the scale at the bottom of the map and read off the distance. If your route is longer than the scale is long, you’ll need to measure the string in scale-length chunks. It’s a good idea to add a pessimism factor of 10 or 20 percent to account for the curves you shortcut and the switchbacks the mapmaker neglected to show.
As an alternative measuring tool, use the edge of your compass. One edge on many models is marked in inches. Use short, straight distances to approximate curves.
The most accurate way to measure distances on a map in the field is with a map-measuring device. The most common ones have a wheel that you roll along the map surface. A pointer or digital readout indicates miles or kilometers for several different map scales. Currently, the best ones available are made by the Scalex Corporation. Of course they’re also the heaviest, bulkiest, and most expensive. (What, were you expecting a miracle or something?) My Scalex MapWheel is about the size of a large digital fever thermometer; it weighs 2.3 ounces without case, 5.2 ounces with. The MapWheel is an electronic tool that is already programmed with most standard map scales. You can also create and save custom scales, a highly useful feature for measuring distances on Trails Illustrated topos, which have nonstandard scales. All of these measuring methods are easiest to do on a flat surface, like your tent floor before you strike camp. (Okay, I’ve been in some of those campsites, too, but you get my point.)
After determining the mileage, calculate the elevation change. First, determine your starting elevation. Find the index contour closest to your location, and trace along it until you find a place where the map gives its elevation. Then count the number of intermediate contours between your index contour and your location. Multiply the number of intermediate contours by the contour interval (it’s given at the bottom of the map) and add that number to (or subtract it from) the elevation of the index contour. For example, let’s say the closest index contour is below your location. It reads 10,000 feet. The contour interval is 40 feet, and your location is three contours above the 10,000-foot index contour. You’re at 10,120 feet (3 × 40 = 120; 10,000 + 120 = 10,120 feet). Similarly, if the closest index contour is above your location, count the number of intermediate contours between the index contour and your location, multiply by the contour interval, and subtract that total from the index contour to get your elevation.
Determine the elevation of your destination the same way. Subtract, and you have your elevation gain or loss.
In some cases you may find that the map doesn’t give an elevation for the index contour closest to your location. In that case find the nearest index contour that does have an elevation indicated, and then calculate the elevation of the index contour near the trailhead. If every fifth contour is an index contour, as is normal, then the elevation difference between index contours equals five times the contour interval. For example, if the contour interval is 40 feet and every fifth contour is an index contour, then the elevation change between index contours is 200 feet.
If the trail runs up and down, be sure to add up all the individual segments of elevation gain and loss.
Now you have the most important information for estimating travel time: distance and elevation gain. But there are other variables as well: your fitness, your load, the altitude, the roughness of the trail, the depth of snow (if any), your mode of transportation (foot, skis, or snowshoes), and whether you’re out for the exercise or to admire wildlife. Two miles an hour is a reasonable pace on a level trail with a moderate load. For every 1,000 feet of elevation gain, add an hour to the time you calculated for the mileage alone. That’ll give you a very rough estimate. Then hit the trails! Write down your times over different kinds of terrain. Make sure you add in rest stops. It’s been my habit for years to record in a journal just how long it actually took me to travel from point A to point B. That gives me a good reality check when I start planning my next trip to the same area. You’ll soon learn what’s reasonable for you.
If no trail leads to your destination, getting there by any route may be problematical. Your map can give you important clues to the easiest route, but only an actual visit—or a call to a knowledgeable local—will tell you if your planned route is feasible. Those green areas, for example, may be open woods allowing pleasant strolling; they may also be nearly impenetrable thickets of alder, willow, and devil’s club. The most important information the map gives to those planning an off-trail hike is probably the average angle of the steepest part of the route.
Find your route’s steepest part by locating the place where the contours are closest together. Then measure that horizontal distance. USGS maps have scales in both miles and feet. In this case use the feet scale because you’ll be determining the elevation in feet.
Next, calculate the vertical rise over that same horizontal distance.
If the vertical rise is the same as the horizontal distance, you’re looking at a 45-degree slope that probably involves stiff scrambling, and it may confront you with some real cliffs. If the vertical rise is greater than the horizontal distance, you’re most likely confronting mountaineering territory where you’d be well advised to have a rope, some hardware, and some well-honed climbing skills.
When the rise is only half the horizontal distance, you’re looking at a slope of 27 degrees—steep hiking, but only hiking. You can probably find your way around any clifflets that may be hiding in between the contour lines.
To estimate the angle of a slope on a USGS 7.5 minute topographic map with a contour interval of 40 feet, measure the distance between two index contours (the dark lines drawn as every fifth contour). Most compasses have a ruler inscribed along the edge, which makes it easy to measure the distance in the field. For some compasses the units are millimeters; for others, tenths of an inch or other fractions of an inch. Take that measurement to the appropriate chart shown in figure 1-8 to determine the slope angle.
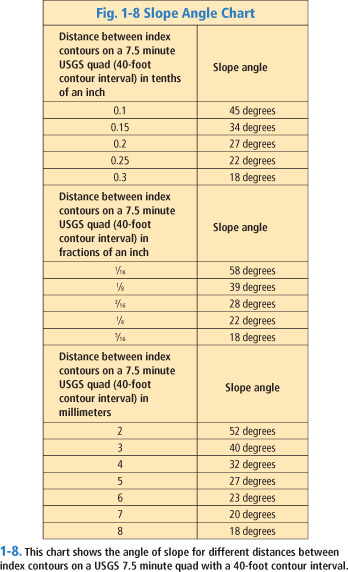
Savvy winter travelers know that most avalanches run on slopes between 30 and 45 degrees. By measuring the distance between the closest-together index contours along your route, you can get a quick assessment of possible avalanche danger. Be wary of 30- to 45-degree slopes that rise above you, even if you yourself are on lower-angle terrain. My compass has a scale in tenths of an inch, so I printed that portion of the chart on an adhesive address label and attached the label to the inside of the lid of my mirror-sight compass so it would be as handy as possible.
Like all generalizations, there are exceptions to these rules of thumb about slope angles. In the canyon country of the American Southwest, for example, certain geological strata routinely form cliffs. The average angle of the slope climbing out of a canyon may be quite moderate, but the steepest angle is often vertical. Short but impassable cliffs can run for miles without a navigable break. The same is true in parts of the Canadian Rockies and Colorado’s San Juans. These cliffs may not be marked as cliffs on the map because they aren’t tall enough to span several contours. Once again, local experience is the real key.
How long will a cross-country route take? If you’re bushwhacking or scrambling amidst cliff bands, the time required is anyone’s guess. It could take two, three, four hours or more to travel a mile. On the other hand, if you’re strolling along a smooth, level ridge above timberline, a mile might take you only half an hour.
If your route combines trail walking and cross-country travel, you’ll usually save time if you stick to the trail until you’re as close as possible to your destination, then head straight for it. Leaving the trail when you first catch sight of the peak you want to climb and heading diagonally up a steep slope usually takes longer than walking the trail until you’re directly below the summit.
Winter, of course, adds yet another variable to the mix. If I’m traveling on snowshoes, particularly if I’m breaking trail, I assume my pace will be about half of what it was in the summer even if I can stay on the route taken by the summer trail. If I’m breaking trail and bushwhacking through the woods, my pace slows still further. Regardless of the season, you’ll need to spend some time in the country to learn how the map features translate into terrain and how far you can actually travel in an hour or a day.