Chapter 4
Measurement Devices
Computers count really fast. With small embedded computing systems like the mBots or an Arduino, anyone can create tools to record data about our physical environment. These measurement robots will work tirelessly for days at a time, and the data they provide about the world can offer young people a way to broaden their notions about the observable universe. The mBot is too large to be worn around a person’s wrist, but the process for designing an environmental sensor for the mBot has much in common with developing technology that goes into wearable commercial tech products like smartwatches.
Probes and sensors have been a standard part of science classrooms for decades. Vernier manufactures dozens of different sensors designed to monitor everything from pH to turbidity. For more exotic measurements, like the composition of gases or liquids, specialized sensors are available, and are wonderful tools.
There are many specialized sensors available for the Arduino platform, and most of them can be used with the mBot. The techniques in this chapter can be generalized for most analog and digital Arduino sensors, but they are time consuming.
Here we’ve attached a Grove soil moisture sensor to the mBot using the RJ25 adapter board (see Figure 4-1). Many analog sensors operate with the same standard three wires: one for 5 V, one for ground, and one for sensor data. Grove’s soil moisture sensor uses Grove’s standard four-wire cable. Using any third-party sensor of this type requires matching the order of those pins on the sensor to the order on the RJ25 board.

Figure 4-1: This soil moisture sensor from Grove uses a standardized 4-wire cable, even though the sensor only needs 3 pins.
With an easy-to-use generic tool like the mBot, the best learning experiences come from finding ways to use simple sensors to measure something specific and personally meaningful. Think of the long history of room alarm kits and toys sold since the 1970s. In every case, the core tech was something incredibly simple (a light sensor, a small button, or a magnetic reed switch) that became compelling when wrapped in the narrative context of adolescent spy fantasies. The goal of this chapter is to model how to think like both an engineer and a kid so you can construct the sensors you want out of the tools available.
In this example, we’ll build a data-logging device that can operate independently for days using the mCore and a basic sensor, in both the Makeblock app and the mBlock programming environment. While these projects are built around a few common sensors, the techniques used to record, analyze, and export the data are consistent and reusable in most situations. The two examples we’re building in this chapter were designed and built by elementary students who were studying how energy and resources were used in their school building. The flexibility of the mCore enables you to design and build devices that capture data to investigate your own super-specific questions, just like these kids.
The hallways into our building have two sets of doors, but some elementary students noticed that they were often both propped open. These students wanted to gather data on how often this happened, how long the doors stood open, and what effect that had on the hallway and classrooms.
This is close to the best case scenario for elementary students looking for local problems. Rather than focusing on a single question or measurement, these students had found a rich and complicated subject that could support multiple paths of inquiry.
Working together, they generated a large collection of measurement questions related to this drafty hallway (see Figure 4-2).
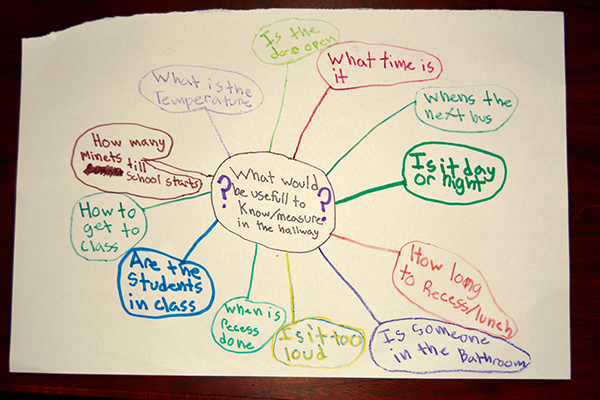
Figure 4-2: A student’s brainstorm about what could be “measured” in the hallway, and how to use that data
It’s easy to overlook this conceptualization step. It would certainly be easier and more direct to teach about a particular topic by gathering a supply of homogeneous parts and detailed instructions that walk everyone through building the same device. When I’ve had particular constraints on time or budget, I’ve chosen to run a single project with a class. However, I know that having everyone work on a single preplanned device causes the excitement retention rate (the number of kids who will still be enthusiastic and motivated by the end of the project cycle) to drop significantly.
Given the option, I will always choose to let students look for problems in the complexity of our daily lives, which we’ll refer to as a problem site in our classroom. This is a much slower start than handing out premade kits, but it helps ensure that each kid starts wanting to know something specific and personal. What motivates kids out of the doldrums that invariably beset them in the middle of a project is personal investment in their unique questions.
The other risk of using open, student-directed inquiry with a physical computing project is that someone will latch onto a question that’s beyond the scope of the hardware and materials on hand. Although the Makeblock ecosystem incorporates a huge range of sensors and tools, that’s not the whole story. Given a finite set of sensors, boards, time, and budget, there are clear limits of what we can tackle “in class, this week.” The flexibility of Makeblock makes it easier to account for this reality, while still encouraging kids to explore the problem site with an open mind.
Looking over the questions generated from consideration of the hallway problem site, creating a temperature monitor was an obvious project option. Another group decided to investigate the doors to see if they could get useful measurements about long they stood open. Both projects require some way to store and evaluate sensor data over time. Looking at these two problems will showcase two different methods for capturing and logging data using the mCore and mBlock.
Sensors report some specific bit of information about the world. The most basic program for any sensor is to display its output, which is recorded as part of a larger data set or used to trigger another action. But those tasks are almost impossible without a clear understanding of how the sensors report data and respond to changing conditions. Creating simple sensor display programs is a crucial step toward more elaborate projects and can help you create powerful stand-alone learning tools. This first section demonstrates how to display sensor readings using either a tablet or computer. The examples use Makeblock’s thermometer, shown in Figure 4-3, but the principles apply to all supported sensors with numeric values.
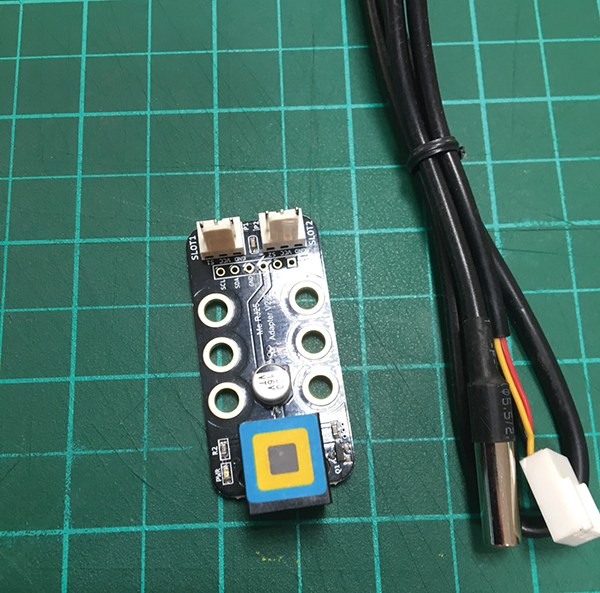
Figure 4-3: The Makeblock RJ25 connector board and water-resistant thermometer
The Makeblock app is a great tool for quickly creating control panels and status displays. Without access to Arduino libraries, tablet users are limited to the sensor blocks included in the Makeblock app. At the time of writing, this includes most of the sensors sold by Makeblock, but that may change as new sensors are released.
One strength of the Makeblock app is the variety of tools provided to display sensor values. For these examples, we’ll use a Numeric Display modeled on a common seven-segment LED, and the Line Graph. These are the best tools in the Makeblock app for providing precise history for a sensor.
Open the Makeblock app and create a new Makeblock sketch, then choose the Line Graph display block from the Custom palette (see Figure 4-4).
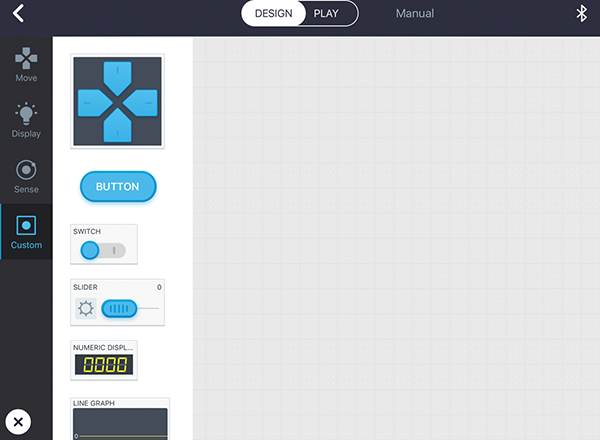
Figure 4-4: Items in the Custom palette start without any blocks.
At the top of the Makeblock app screen, there’s a button that allows you to toggle between Design and Play mode. To add elements or make changes to them, you need to be in Design mode. Play mode will activate those elements, along with any scripts under a When Start hat. In Scratch parlance, blocks with the swoopy tops are called hats, because they must sit at the top of a stack of blocks. All hat blocks and the blocks attached to them require some signal to activate. Makeblock also has a variety of interactive UI elements that trigger specific behaviors when selected. Displaying sensor values requires a UI element such as the Line Graph, Analog Meter, and Numeric Display, but you can use the Read Sensor block anywhere in a Makeblock app program.
For this example, we’re using an mCore with the three-wire temperature sensor, connected through the RJ-25 adapter board, as shown in Figure 4-5. The temperature sensor is analog, so it needs to attach to port 3 or 4. In this example, we’re using port 3 and slot 1.
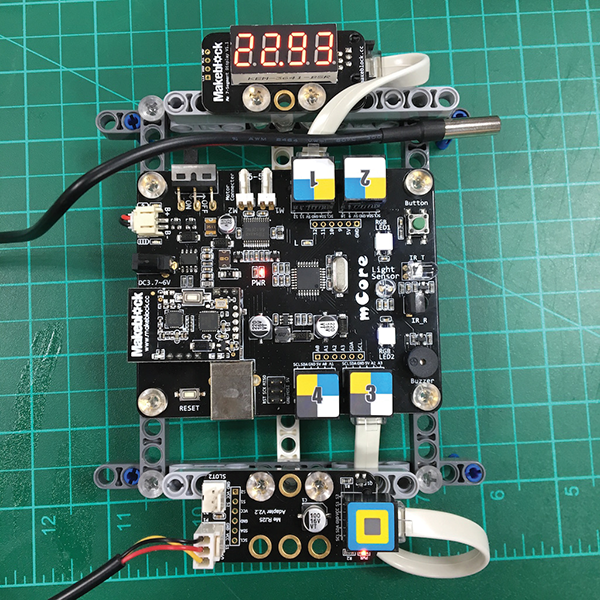
Figure 4-5: The temperature probe connects to the RJ25 board, which bolts securely to the LEGO Technic frame from Chapter 1, “Kit to Classroom.”
To model all of these connections inside the Makeblock app, we need to add code to our blank Line Graph block. In Design mode, select the Line Graph block and choose Code. (See Figure 4-6.)
The block interface for the Makeblock app offers many tools to work with, but this example requires only a few. For a more detailed discussion of how to program with the Makeblock app UI, revisit Chapter 2, “mBot Software and Sensors.”
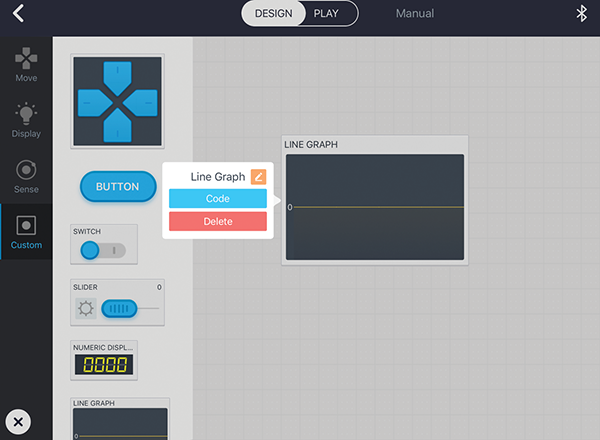
Figure 4-6: The Context menu that opens the block-based coding interface is available only in Design mode.
We’d like the line graph to constantly display the temperature reading. In the Detect palette, there’s a Read Common Temperature Sensor block. Drag it out, then configure the Port and Slot values to port 3 and slot 1. Wrap that orange block inside a purple Display On This block from the Display palette. Place that purple block inside a pink Repeat Forever block from the Control palette. Finally, attach the Repeat Forever underneath the light blue When Start hat. The final block is a multicolored monster, as you can see in Figure 4-7, but it will grab and graph the thermometer data indefinitely.
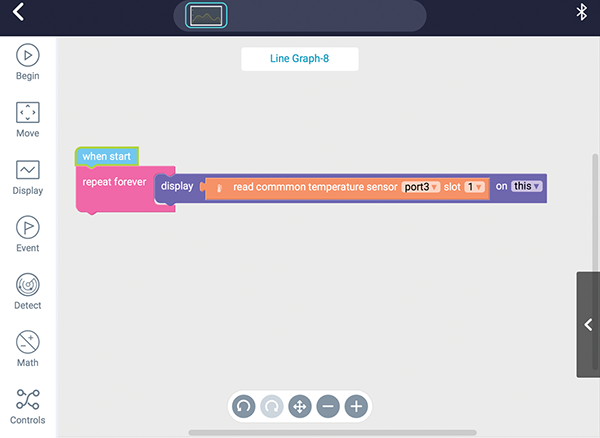
Figure 4-7: When creating custom elements, you can set sensor locations directly inside the blocks without using the Port interface.
Tap the back arrow in the top left of the screen to return to the UI design screen. At this point, it’s worth renaming the Line Graph block to reflect what it’s actually graphing. Tap the Line Graph block and use the orange pencil icon to rename it.
The line graph and all other display elements will update after the Makeblock app is in Play mode.
If the temperature is stable, the graph will show fluctuations within a few degrees Celsius. If you take the probe from your warm hand and plunge it into a cup of ice, the graphs will zoom out to display the sudden dip in temperature. Scaling keeps major temperature swings visible for a while, but the detailed values are obscured. The variables in the Makeblock app allow programs to track specific values, even after they scroll off the dynamic line graph. Next, we’ll create a variable to capture and display the lowest temperature recorded by the sensor.
Blocks that relate to variables in the Makeblock app are Change Item By, Set Item To, and Item, and they all appear in the Math palette. (See Figure 4-8.)
Once any of those blocks are dragged out of the palette, clicking the pulldown after the word Item will show all existing variables and allow you to delete or rename them. For experienced programmers, it might seem a bit weird that there’s no Create Variable option in this menu. In the Makeblock app, new variables are always called simply Item. After a variable is renamed to something helpful and clear, dragging out another block from the Math palette will create another bland Item. In fact, the Makeblock app doesn’t offer any way to create a new variable other than renaming! This system attempts to avoid situations where many anonymous Item variables clutter up programs, much like Untitled word processing documents do on a desktop.
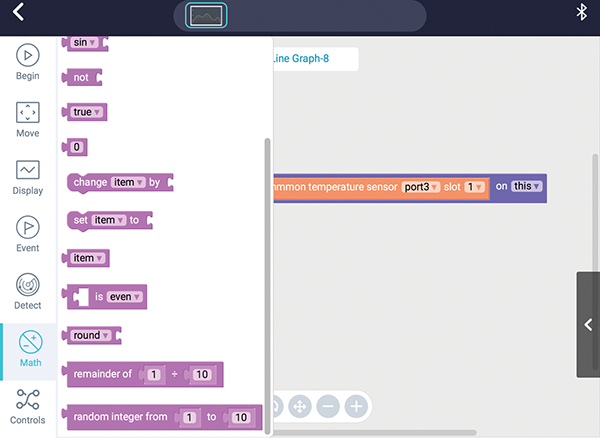
Figure 4-8: Blocks with the keyword Item live in the Math palette and offer access to all variables in the Makeblock app.
It’s important to recognize that these variables are not tied to particular UI elements! The Makeblock app’s system of bundling code to particular buttons or displays can obscure the fact that all the code is part of a single program and runs simultaneously. Variables can be set, read, and modified across the code blocks of several elements, which will help keep the Lowest Temp program visually cleaner.
One of the real hassles of block-based programming is screen width. When blocks nest inside each other, it’s easy for important information to get pushed off the right side of the screen. Horizontal scrolling is a pain! To avoid this, it’s good practice to use a variable to store the temperature reading, instead of calling the sensor several times in a single loop (see Figure 4-9).
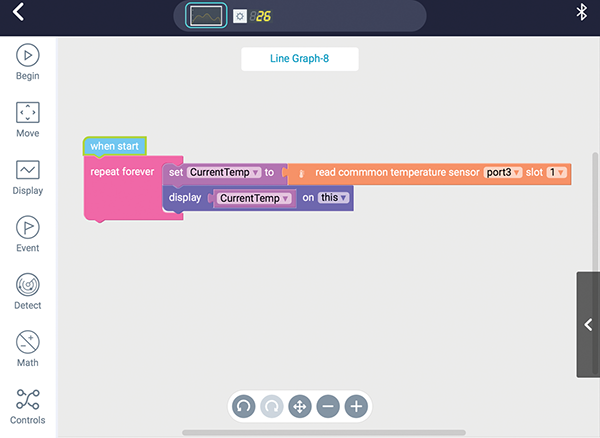
Figure 4-9: Saving the temperature reading in a variable makes it possible to build another UI with confidence that both will use the same data.
This technique transforms a long block like Read Common Temperature Sensor on port 3, slot 1, into one compact variable name CurrentTemp. Each time we use a variable instead of a sensor call, the program gets more consistent (because the values don’t change each time), more responsive (because the program running on the tablet doesn’t have to wait to hear from the mBot), and more clear.
Using the Makeblock app, we’ve created a portable thermometer that displays of-the-moment data on the screen of a mobile device. But if something interesting happens with the temperature while no one’s watching the screen, there’s no record of it. To fix this, we’ll create a second variable to store the lowest temperature observed by the sensor. We’ll also create a new UI element, Numeric Display, that will always show the lowest recorded temp from the current session. See Figure 4-10.
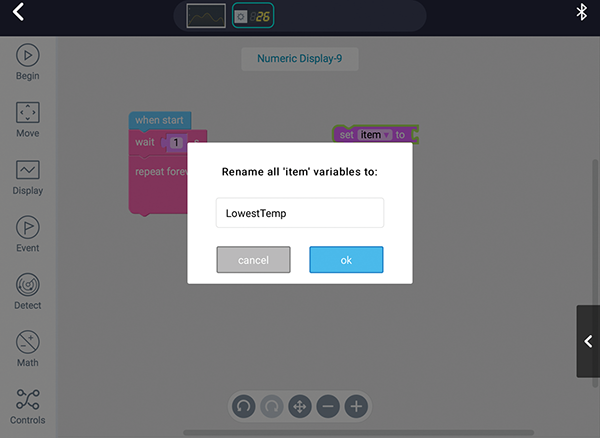
Figure 4-10: To create a new variable in the Makeblock app, drag any block that uses the keyword Item onto the stage, and then rename the variable.
Although the lowest temperature won’t often change, it needs to be constantly checked against the CurrentTemp threshold (see Figure 4-11). Placing the Wait block before the comparison loop ensures that a valid CurrentTemp variable will always be available.
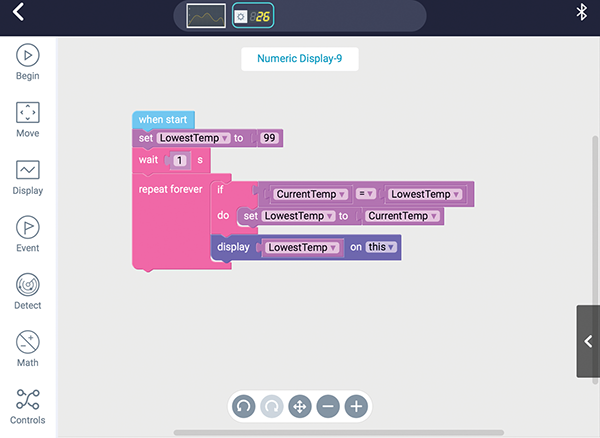
Figure 4-11: Why start off by setting the LowestTemp threshold to 99? Having a large initial value ensures that on the first loop, CurrentTemp will be below LowestTemp and the Do section will execute.
The blocks in this Numeric Display never set the value of CurrentTemp. The Line Graph block is still updating the CurrentTemp value during every loop, and this block can make use of that data. It’s worth noting that there’s no strict sequencing between the code in the Line Graph block and these blocks. Both use a RepeatForever block and will loop independently. Loose coupling like this might cause problems with data that changed rapidly and non-linearly, like the ambient noise level at a concert. Because we are working with something slow and steady like temperature change, though, there’s little measurable difference if the LowestTemp loop checks the same CurrentTemp value twice, or if the CurrentTemp value updates quickly between loops of the LowestTemp check.
When introducing the Makeblock app, it’s helpful to attach each script to the relevant UI element. If the widget isn’t displaying the LowestTemp properly, checking the code inside the Numeric Display UI element is a good first step (see Figure 4-12). You can quickly move between the scripts attached to all elements in a program by using the horizontal navigation panel at the top of the screen. However, blocks from anywhere in a program can change or update each individual UI element. In more complex programs, it might be more elegant to keep all the scripts in a single location.
If you use the wide range of sensors available, the Makeblock app can become a powerful and versatile data-monitoring station. The only hard limits on the Makeblock app as a research tool are the range of the Bluetooth connection and insufficient, large-scale data storage. Using mBlock, the desktop programming tool, offers ways around those specific limitations but presents a very different experience when working with sensors. In the next section, we’ll re-create a similar temperature-logging program within mBlock and highlight the data-related tools within the Scratch environment.
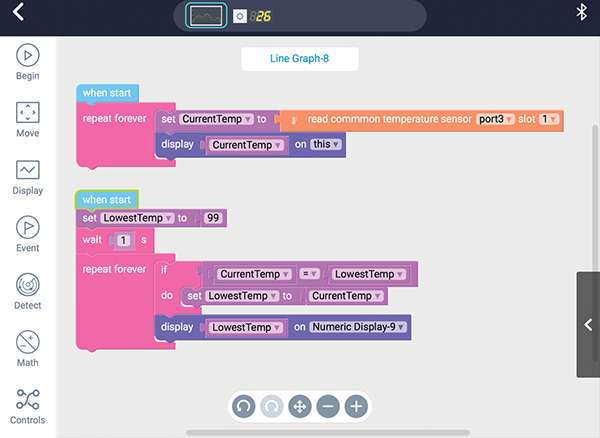
Figure 4-12: By changing the last display block to name the Numeric Display instead of the self-referential keyword This, the entire program can attach to one element.
Monitoring Sensors in mBlock
When you’re using the mBlock programming tool on the desktop, the easiest way to check the value of a sensor is to use the purple Say blocks. It isn’t fancy, but it is still a great way to check that the values match your expected sensor behavior. When working with a class or large group, we require a Say sensor test as the mandatory first step for any program. This little stack of blocks serves as a safeguard against common start-of-project problems. If the polar bear can say the temperature, like she’s doing in Figure 4-13, then we know that the mBot board is powered properly, the serial connection works (whether it’s Bluetooth, 2.4G, or USB), all the sensor wires are connected properly, and the displayed data matches expectations.
Creating this simple program replaces a lengthy and dull preflight checklist that leads to a properly configured mBlock and a blank screen. By using Say blocks to fix low-level issues, we also create an interactive tool that helps students experiment with the hardware.
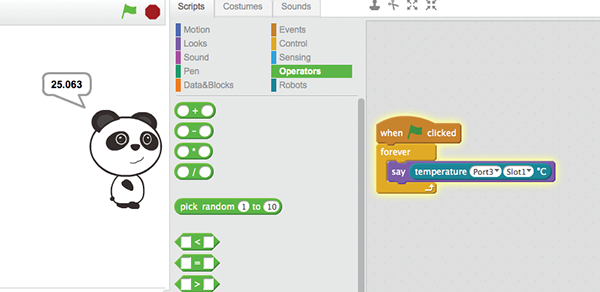
Figure 4-13: The default mBlock panda sprite doesn’t do much in our programs except shout sensor values.
Since the mBot’s wireless communication allows us to measure the temperature far away from the controlling laptop, it’s important to display the temperature on the device itself, not just on the mBlock stage. We’ll opt for the conventional 7-segment display. Just like the Say block, the 7-Segment block will accept any alphabetic or numeric value, including variables or mathematical expressions, as shown in Figure 4-14.
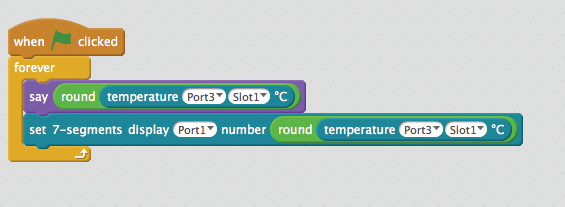
Figure 4-14: Use the green Round block from the Operators palette to round the temperature to whole degrees.
In mBlock, you can use variables to track record temperatures, although the visual syntax looks different from the Makeblock app. Moving between two different block-based tools teaches new programmers to look for structural similarities underneath syntactic differences. Whether you’re working in the Makeblock app, mBlock, Arduino C, or Python, the flow of sensor loops is identical: acquire new readings, check against special values, replace if necessary, repeat. In mBlock, we can check for high and low temperature thresholds in the same loop.
As we did in the Makeblock app program, we’re going to use HighTemp and LowTemp variables to keep records of the extremes, along with a CurrentTemp variable to store the latest reading from the thermometer. Using variables in mBlock means creating them in the Data&Blocks palette using the Make A Variable button, then using the orange Set Variable To block in the program itself.
This program starts off by setting both the high and low temperatures to the initial reading from the thermometer. This provides a reasonable baseline to check against over time. The default value in the mBlock Set Variable To block is 0, which isn’t a neutral value for temperatures in Celsius, much less Fahrenheit!
Once the variables are set, we need to establish the main loop of the program. As in the Makeblock app program, this loop will run continuously once the program starts, and require no interaction from the user (see Figure 4-15).

Figure 4-15: This version reproduces the behavior of the mobile program created with the Makeblock app.
I recommend that you use an If/Else block in your loop to check the first criterion, and then nest another If block in the Else statement. This ensures that no CurrentTemp value replaces both the HighTemp and LowTemp records in a single loop. When the program starts and HighTemp and LowTemp are assigned the same value, those values won’t change until the temperature shifts.
At the beginning of each loop, the value for CurrentTemp is displayed on the physical 7-segment display and on the screen with the Say block. The on-screen displays for HighTemp and LowTemp are controlled by the small checkboxes next to the variable names in the Data&Blocks palette, or by using the orange ShowVariable and HideVariable blocks in a program.
One of the enduring charms of Scratch is that the general-purpose tools are strong and flexible enough to make up for the lack of built-in functions that provide instant answers to very specific challenges. There’s no Line Graph function in mBlock that matches the one in the Makeblock app. Instead, there’s the wide-open Pen tool that can create everything from mathematical drawings to 3D environments and everything in between. There’s no end to the complexity and challenges that can emerge from trying to create graphical representations of data with the Pen tool. This simple line graph is an invitation to experiment and create with this incredible tool, shown in Figure 4-16.
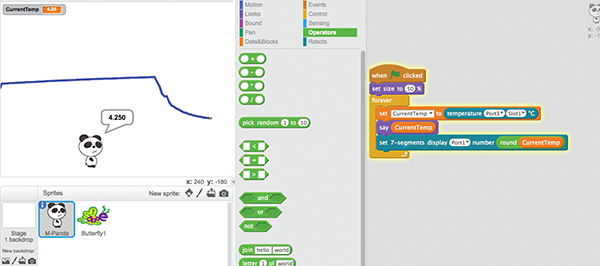
Figure 4-16: While the panda sprite is shouting the temperature, the small butterfly sprite is drawing the line graph.
The mBlock Stage area becomes the XY-coordinate grid and sets the position of the cursor based on the data from the temperature sensors (see Figure 4-17). The value of the horizontal X-coordinate needs to steadily increase so that the graph moves steadily to the right over time. This example uses a five-step “tick” for the graph, meaning that the distance between each data point is five steps on the Stage. Using fewer horizontal steps in each tick would create a slower and denser graph, whereas a larger tick would result in bigger movements on the graph over a smaller time interval.
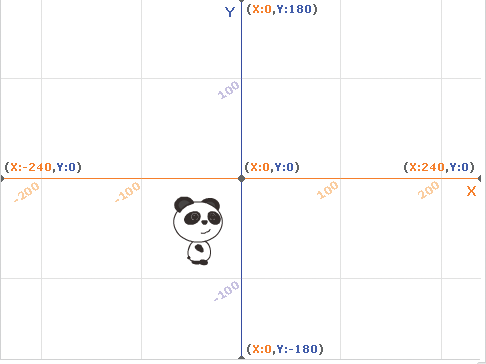
Figure 4-17: Scratch chose a center-original coordinate plane to better match the way graphing is taught in elementary math classes.
A normal temperature range of a few degrees doesn’t create a very dramatic graph. In mBlock, the XY-coordinate grid has a center point of (0,0) and has a maximum Y-coordinate value of 180. We can adjust the temperature value to display better within that coordinate system. This example, shown in Figure 4-18, scales the temperature by 3.5, making the vertical distance between degrees more noticeable, and then shifts it down by 75 steps so that 0 degrees is in the lower half of the stage. These particular constants make sense for an outside thermometer reporting in Celsius in certain parts of the world, but they would be a bad choice for monitoring the temperature inside a refrigerator. Shifting and scaling the graph to make good use of the Stage real estate and match the conditions being measured is a meaningful design task in and of itself.
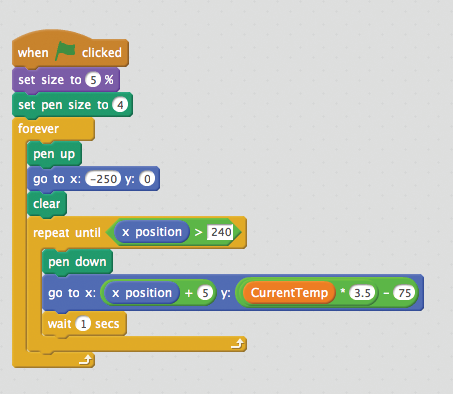
Figure 4-18: This program draws a line graph and resets when the sprite exits the right side of the Stage.
So far, we’ve been using the mCore to report on momentary observation. While we’ve used visual displays and record-keeping to broaden the moment of observation, the raw data is ephemeral.
Arduino Uno–derived boards like the mCore are memory-limited, making it impractical to use a plain board for long-term data monitoring. The many data-logging projects that use Arduino-derived boards must all record data to some form of external memory, either by a connection to a computer or the addition of SD cards. The specialized form factor of the mCore makes it more difficult to use one of the many Arduino shields that add SD card storage. But since the mBot can use the standard persistent Bluetooth or 2.4G serial connections to send back temperature readings to mBlock, the hard work of data storage is already done!
So far, the thermometer we’ve built hasn’t needed to store or evaluate large amounts of data. It simply took the temperature reading from the sensor and sent it to the 7-segment display, and checked that value against dynamic thresholds. Tracking all of the temperatures over time means that we need to use mBlock’s List data structure.
In mBlock, lists appear as a bundle of variables, with each slot capable of holding numbers or words. Like variables, List blocks have a special set of blocks that only appear once you’ve created one. (See Figure 4-19.)
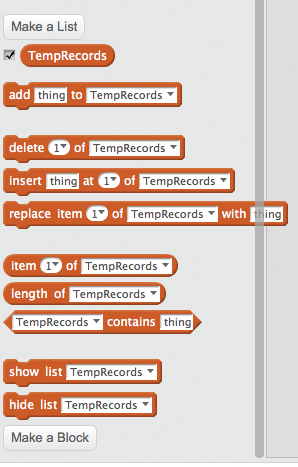
Figure 4-19: List blocks allow programs to read, insert, or remove individual items from any position in the list.
Lists start empty, but do not reset or clear unless you use the List block named Delete All (see Figure 4-20). This persistence can be a useful feature if you’re trying to capture data over a long time, but when you’re designing and testing it’s helpful to clear the list at the beginning of the program. By default, mBlock displays Lists values on the Stage, but the actual data will quickly outstrip those tiny windows.
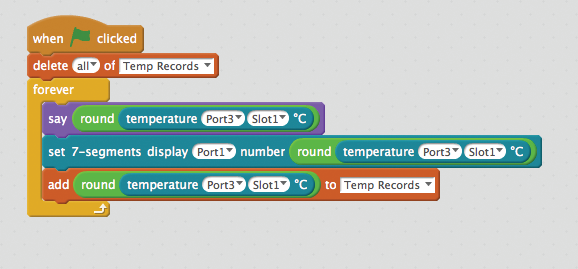
Figure 4-20: Without the opening Delete All block, new items would append to TempRecords each time the program ran.
After gathering a large data set, we can export the data and use other tools for analysis. This is a simple extension of the previous thermometer program that captures each reading in a list called TempRecords.
The current program puts a new temperature reading into TempRecords as fast as mBlock can communicate with the mCore. The actual time this takes depends on the method used to tether the mCore to the computer. With the 2.4G serial adapter, the list adds about 340 entries in 120 seconds. With a wired USB connection, it adds over 500 records in the same time.
For a device that’s monitoring the temperature in a hallway, even two readings a second might be overkill. Lists in mBlock don’t have a hard size limit, other than the available RAM on the computer, so large lists aren’t intrinsically bad. But to a human who might want to scan that list, three hundred entries of the same value don’t add much to the picture. Using a small timer, we can easily add a 60-second delay between each temperature reading (shown in Figure 4-21). This ability also creates a powerful proving ground for investigations into size, scale, and sampling. These programs aren’t answers to textbook problems! They’re designed by humans to answer real questions in particular contexts. Given the physical reality of the problem site, is there a difference between two million readings taken every 30 seconds or one million taken every second? The correct answer for a drafty school hallway might lead to doom when applied in a high-altitude emergency shelter.

Figure 4-21: This adds a new item to TempRecords, and then puts the program to sleep for a full minute.
The choice to take a temperature reading every minute is clean, but a bit arbitrary. Why not 75 seconds? Why not three minutes? One of the powerful abilities you have in tethered mode is creating programs that can be modified on the fly.
Writing an adjustable program that uploads to the mCore introduces a number of problems: How do you know the current state of the program? What input method adjusts those states? What feedback is provided to the user to know they’ve successfully changed state? Trying to communicate the changing state of a program through a few blinking LEDs can be a nightmare. Tethered mode makes the screen, keyboard, and mouse accessible for any mBlock program, which allows you to create a clear, intuitive control scheme.
The first step is to replace 60 seconds, which serves as a threshold value for our loop, with a variable (see Figure 4-22). By itself, this doesn’t change the behavior of our program.
Since SampleDelay is set to 60, that’s the value check each time the program runs through the If statement. Now we can use mBlock’s keyboard input functions to control the value of SampleDelay.

Figure 4-22: Setting SampleDelay before the loop ensures that the program will start with a 60-second delay each time it runs, and that value can be adjusted later.
These blocks make use of two different ways that Scratch looks for keyboard input. The first is the orange When Key Pressed hat from the Control palette (see Figure 4-23). When Key Pressed blocks constantly check for the given keyboard input, and then executes the blocks underneath once. However, if the signal stays on (like a keyboard key being held down) then the blocks will execute many, many times. To address this, the program waits for a pressed key to be released. This is a simple example of what’s known as debounce—the process of eliminating stray inputs from physical systems. With this extra block in place, we’re assured that each press of the up or down arrow will change the SampleDelay value by 5 seconds. Using the small checkbox next to the variable name or the ShowVariable block will ensure that the current value of SampleDelay stays on the mBlock Stage at all times.
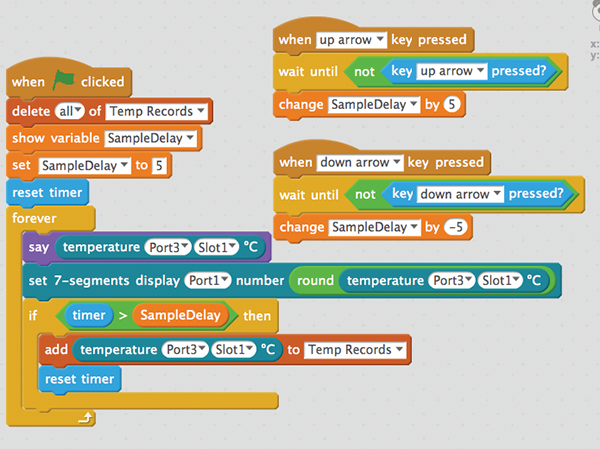
Figure 4-23: Using the When Key Pressed hat introduces elements that are checked during each cycle without incorporating them into our main Forever loop.
Once we’ve collected several hundred temperature readings, we need to find something to do with them! Creating data visualizations in Scratch-derived languages is a great, open challenge for new programmers. There are so many tools and hooks available in Scratch and mBlock that it’s possible to create radically different graphs or visualizations from the same data. However, since those techniques are all grounded in Scratch programming, rather than the mBot, they’re slightly outside the scope of this book. The book’s website (www.pngrrocketworks.com/instructions/make-mBots) has a gallery of Scratch projects that create data displays from both static lists and incoming data streams. These projects can serve as models or inspiration, or even as a cautionary tale about what roads to avoid.
Fortunately, there’s an easier way to get the data from mBlock into a spreadsheet using a tool that’s purpose-built for handling giant lists of values. To export the values from any list in mBlock, you can right-click on the list viewer on the Stage and select Export (see Figure 4-24).
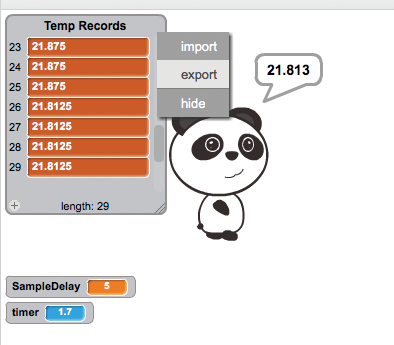
Figure 4-24: Export generates a list of return-separated values. Data in that format can also be imported into mBlock lists.
The list values are exported to a text file with each value on a separate line (see Figure 4-25). This format is perfect for copying and pasting the values into Google Sheets, Excel, Numbers, or any other comparable program.
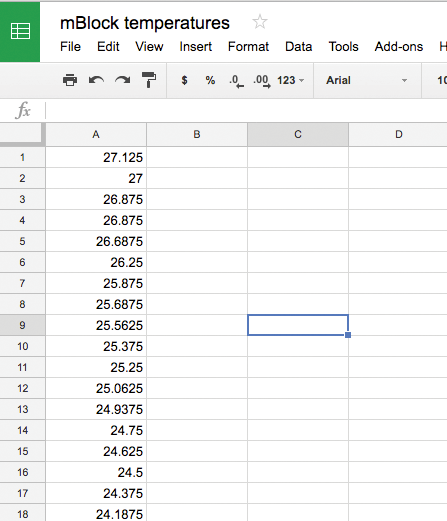
Figure 4-25: Data can also be imported into mBlock lists. List exports contain only raw data, so it’s up to the user to add labels and context.
Not only does exporting data allow students to use existing tools to create simple graphs or calculate central tendencies like mean, median, and mode, but it’s the best way to collect data from several mBlock programs. If several groups build small measurement devices to monitor specific areas of a larger problem site, exporting the data to a common document allows students to easily compare their findings. Consider three of these temperature monitors spaced out along a hallway. If all of their data is in a single spreadsheet, it’s much easier to see how far and fast the momentary drop in temperature from an open door travels down the corridor.
Door Monitor
While you can make interesting programming choices to measure and record temperature, the hardware didn’t require much thought. As we’ve seen in this chapter, getting a basic reading boils down to plugging in the thermometer and finding the Read Thermometer block. The situation is quite different for more general tasks, like trying to track the open/closed status of a door. There’s an abundance of sensors and methods that can perform this task, but none of them are called “door sensors,” and mBlock doesn’t come with a Door Sensor block. In this next section, we’ll look at how to use a variety of tools to track door status, and how to design a program largely independent of the particular sensor.
When new roboticists approach a real-world problem like this, it’s important to get them to look carefully at the physical details of the problem space. As a teacher, I’ve found that repeatedly asking basic questions about small observations and actions will eventually shift students’ frame of reference down to a scale that robots and sensors can measure. It can take several minutes of climbing on a stepladder or lying on the floor while fiddling with the actual door to arrive at a sufficiently detailed answer to “How does the door open?” What makes these questions wonderful for groups of kids is that deep, detailed observation reveals that not all doors are the same! Differences in the material, frames, weight, and construction of each door will push students to generate novel solutions that accommodate all that messy, real-world variation.

Figure 4-26: Early versions of this sensor failed when kindergarten students would only slide the door open far enough to squeak through.
For a sliding door, the mBot ultrasonic distance sensor was able to face inward and watch for a gap when the door opened. (See Figure 4-26.)
The mBot Line Follower sensor is placed near the hinged edge of the door. Popsicle sticks are used to enlarge the visible target of the door. The purple sticks shown in Figure 4-27 block one of the two light sensors on the Line Follower until the door is opened. This creates a unique closed state where the two different sensors on the Line Follower report different values.
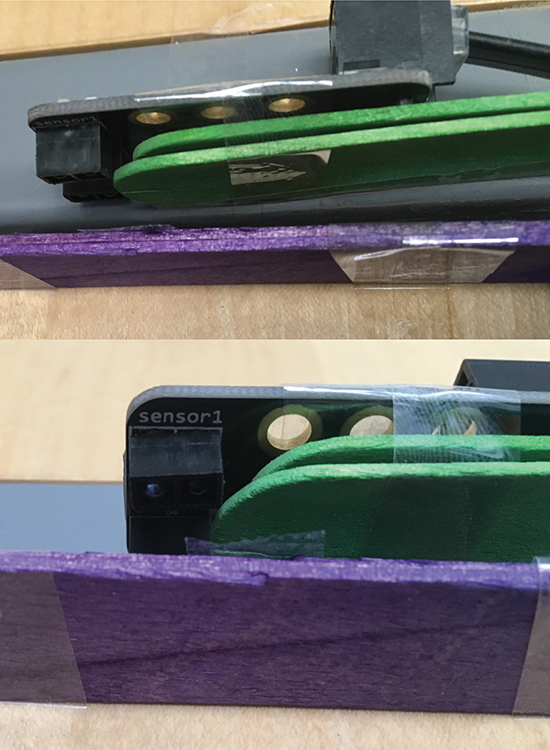
Figure 4-27: This popsicle stick solution emerged after students struggled to find a sampling rate that would reliably catch the door in motion.
These students mimicked common commercial door alarms and used a magnetic reed switch attached to the door frame and a magnet stuck to the metal door (see Figure 4-28).
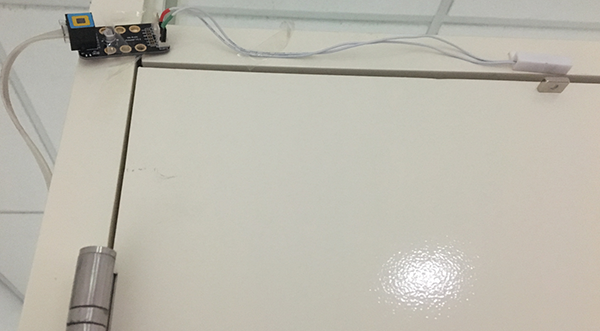
Figure 4-28: One group of students latched onto reed switches early and searched the campus for a metal door to hold the magnet in place.
Reed switches have a small lever encased in the plastic housing that moves in response to strong magnetic fields. Reed switches work like any other button would with the mCore. On the RJ25 connector, connect one wire to the ground pin and the other to the S1 or S2 pin (depending on the port you use). Here, the bare wires from the reed switch are soldered to standard 0.1 pitch header pins, which match nicely with the JST connectors on the RJ25 board (see Figure 4-29).
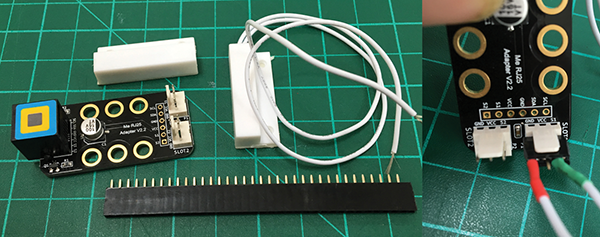
Figure 4-29: Soldering header pins to the RJ25 board make almost any crazy switch idea mBot-compatible.
While most reed switches are sold in packages with two plastic parts, the loose piece without wires just contains a magnet. In a classroom environment, this part often disappears and students wind up using generic magnets. Our Makerspace tends to use strong, rare-earth magnets due to size and storage concerns, but if you have access to a shoebox of red and blue horseshoe magnets, they’ll work just fine.
This mess of tinfoil is a student-made button, where the foil-wrapped popsicle stick bridges the gap between two smaller foil pads, each connected to one pin of the RJ25 connector. (See Figure 4-30.) This is a crude button but gives decent readings using the same Limit Switch block as the magnetic reed switch.
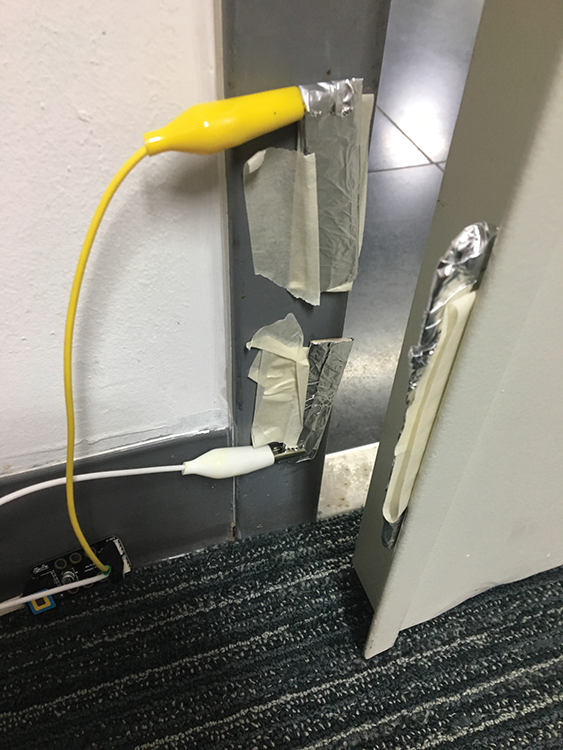
Figure 4-30: Alligator clips are connected back into the RJ25 board with header pins, just like the reed switch.
These solutions should not be seen as an exhaustive list of how to check a door. Simple problems often spawn complex solutions. It can be difficult for teachers and mentors to resist presenting the “right” solution, especially when kids are climbing a ladder to build something stupendously inefficient. Be strong and stay quiet! No matter how outlandish the solution, we can use the Custom Block features in mBlock to abstract away the mess.
Our goal with a custom block to check and open the door is that you could write a program that uses data from the door sensor without knowing anything about the physical construction. Instead of looking at readings from a particular sensor, we’ll create a new variable in our program called DoorStatus and assign a status of either Open or Closed. Variables in mBlock can store letters or numbers, and can perform type-appropriate operations on them. Subtraction doesn’t work well on text (or more properly, strings), but mBlock can check for equality. For strings, equality means an exact character-by-character match. There’s no functional difference between using Open/Closed, True/False, or 0/1 as DoorStatus values, but using Open/Closed makes the program far more legible for other humans.
We’ll change the DoorStatus value only from within a custom block called CheckDoorState (see Figure 4-31). This way, the main program doesn’t need to care whether the door sensor uses a Line Follower sensor or a magnetic reed switch.
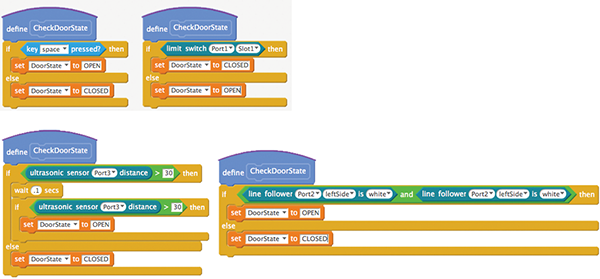
Figure 4-31: You should be able to drop any of the four CheckDoorState functions shown in these images into the same program and they should function identically.
All of these CheckDoorState blocks work for their particular sensor and physical setup, but the main loop doesn’t need to know anything about those details. Using the CheckDoorState block means that the program trusts that, whatever happens inside, the code will update the DoorState variable accurately and promptly.
Using the same techniques from the temperature records program, this program tracks how long the door is held open in a list called OpenLength. This program uses two light blue blocks to monitor time in a program: Timer and Reset Timer from the Sensing palette. In a Scratch program, the timer starts running as soon as the program window opens, regardless of whether any program blocks are executing. This value will increase constantly until the Reset Timer block is triggered, and then it will reset to 0 and start counting again (see Figure 4-32).
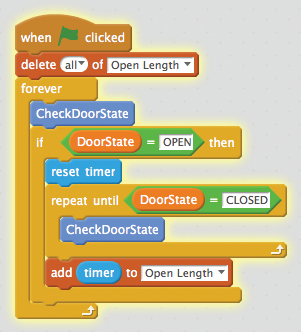
Figure 4-32: In mBlock, Reset Timer serves as the starter’s pistol and resets the timer, which is continuously running, to 0.
The resulting list records the OpenLengths with the Timer block’s default precision of thousandths of a second. (See Figure 4-33.)

Figure 4-33: You can see that even though the door was closed after a second, the timer value is still increasing.
Unlike the record of temperatures, which took a reading at fixed time intervals, an entry is added to the list only when the door is opened and closed. As a result, the number of entries in OpenLength provides a count of how many times the door was opened. In mBlock, you can access that number directly using the Length Of List block from the Variables & Blocks palette.
Knowing that this value will go up every time a new item gets added to the list opens up the possibility of calculating averages or looking for patterns. it’s a good practice to isolate extra tasks in custom blocks, as we’ve done with the doorstate. Strive to keep the main loop readable and the custom blocks narrowly focused. Using more custom blocks in a program, provided they’re well named, reduces complexity for both the designer and the user (see Figure 4-34).
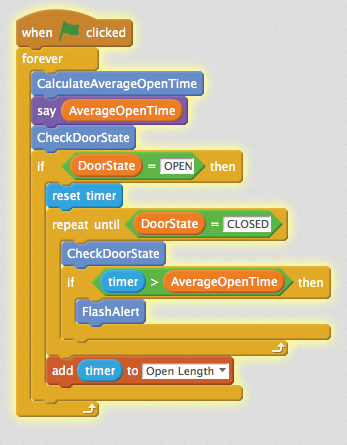
Figure 4-34: Well-named custom blocks create mBlock programs that are clear and human-readable.
Without seeing the scripts contained under these custom blocks, a reader can still intuit what should happen. Names alone suggest that the custom block CalculateAverageOpenTime will update and set the variable AverageOpenTime. When the door is open for longer than that value, it’s time for FlashAlert. This script could play a sound, illuminate a strip of LEDs, direct a robot to pull the door closed, or turn on a hose. In some way, the script represented by FlashAlert wants to motivate nearby humans to close the door.
Encourage young programmers who are satisfied with their first prototype to add custom blocks to programs in this aspirational manner. A new custom block has no scripts attached and will do nothing when added to a program. Empty blocks work as placeholders for new features and help the programmer consider when and why to perform an action independent of deciding how.
Using the mCore, students were able to gather real data about the quiet details of their everyday environment. Quantitative information, from machines they designed and built themselves, pushed them to find ways to fix the problems they identified. They put up reminder signs, cleared gravel that blocked exterior doors, and changed traffic patterns in the building. Although these solutions were small, they still provided powerful closure for a student-led learning experience.