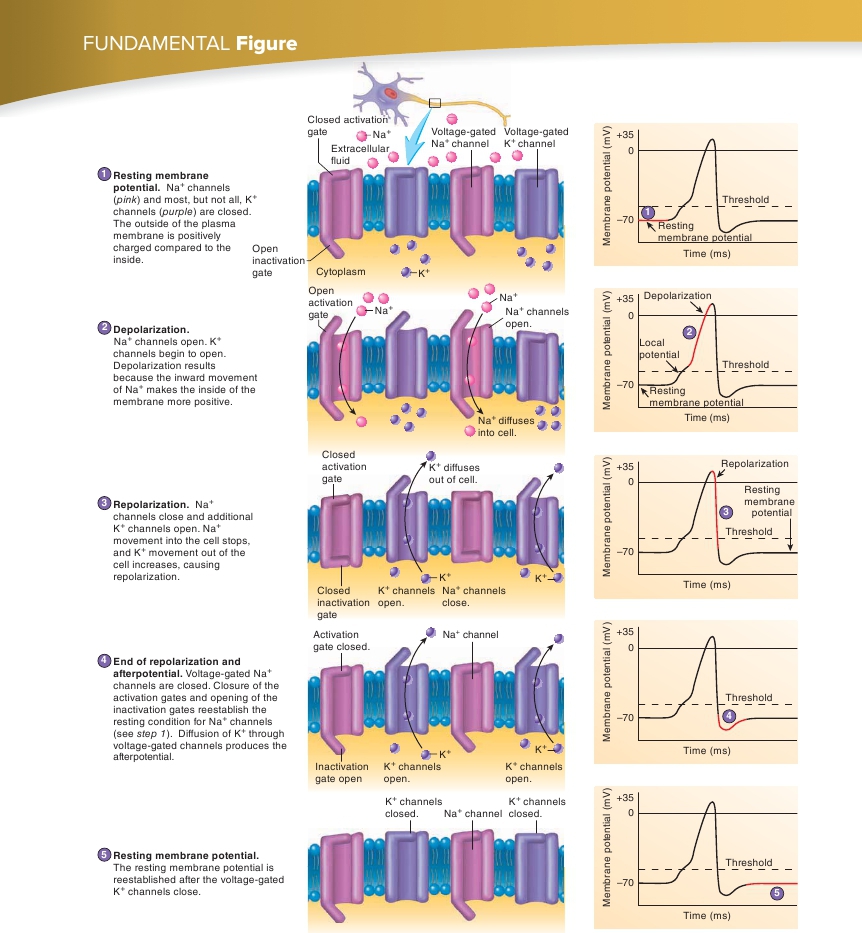
PROCESS FIGURE 11.12
Voltage-Gated Ion Channels and the Action Potential
Step 1 illustrates the status of voltage-gated Na
+
and K
+
channels in a resting cell. Steps 2–5 show how the channels open and close to producean action potential. Next to each step (far right), a graph shows in
red
the membrane potential resulting from the condition of the ion channels.
383