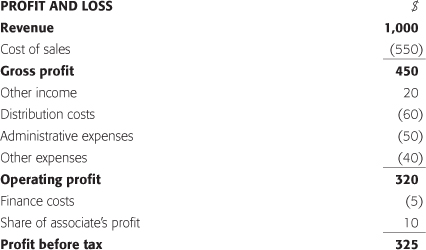
THE INCOME STATEMENT deals with the operating activities of a company and is intended to provide a report on its performance during the year. It was previously called the profit and loss account in the UK, and is sometimes referred to as the statement of earnings or operations in the US. The income statement gives details of a company’s income and expenditure for the year. Where sales revenue is greater than expenses a profit is produced; the reverse results in a loss – hence profit and loss account. IAS 1 first issued in 2007 is the prime source for financial statement presentation. The IASB, working with the FASB to provide separate but convergent guidance, amended IAS 1 in 2010.
Income statement presentation format
Companies are allowed a free hand in their choice of title for the income statement, but IAS 1 uses “statement of profit or loss and other comprehensive income”. Whatever the title the statement must show:
- profit or loss for the period;
- total other comprehensive income;
- comprehensive income for the period.
The share of the profit or loss and comprehensive income due to a non-controlling interest (NCI) should also be disclosed. Profit or loss for the period is defined as “the total of income less expenses, excluding the components of other comprehensive income”. All income and expenses recognised during the year are included in the profit or loss statement.
IAS 1 does not enforce a single form of presentation but offers a list of items that should appear on the face of the income statement. It also requires the disclosure of all material items of income and expense. Fair value is the basis of measurement. Companies may show expenses either by their function (for example, cost of sales, marketing, administration) or by their nature (for example, employee costs, depreciation). They may provide additional information to improve the usefulness of the statement.
Comprehensive income
In recent years the FASB and the IASB have increased the emphasis on comprehensive income to achieve their stated aim: “to improve the comparability, consistency and transparency of financial reporting”. A statement of comprehensive income (SOCI) is intended to show both realised and unrealised gains and losses in the year that have had an impact on the equity of the company. Remember that most of the changes in financial presentation have been a reaction to the 2008 global financial crisis and so have focused very much on financial institutions. The FASB and IAS 1 define total comprehensive income as being:
The change in equity during a period resulting from transactions and other events, other than those changes resulting from transactions with owners in their capacity as owners.
Previously, profits or losses that were seen as outside the normal operations of a company could be taken directly to shareholders’ equity. Following the IAS 1 format, net income, as shown in a traditional income statement, is added to other comprehensive income (OCI). This provides comprehensive income (CI) and represents the overall result of a company’s activities for the year. OCI will also be found in the statement of financial position as a single line within shareholders’ equity. CI includes all gains and losses for the period both realised and unrealised.
If a non-current asset’s value has increased during the year this will be included in CI. Dividends will not appear in CI as they represent a transaction with the company’s owners.
- changes in a revaluation reserve (IAS 16 and 38);
- revaluation of actuarial net-benefit pension schemes (IAS19);
- foreign-exchange translation differences (IAS 21);
- changes in value of available-for-sale assets (IAS 39);
- changes in a cash flow hedge (IAS 39 and IFRS 9).
Comprehensive income = profit or loss + other comprehensive income
IAS 1 requires other comprehensive income to be divided into two parts: items that may be reclassified (recycled) into profit or loss, such as foreign-exchange adjustments and cash flow hedges (gains or losses); and items that will never be reclassified, such as revaluation reserve movements, actuarial gains or losses on defined benefit pensions, and gains or losses on fair value equity instruments.
The comprehensive income figure also appears in the statement of changes in equity for the year. Companies may choose between providing a single statement of comprehensive income – adding the comprehensive income section at the end of the traditional income statement – or continuing with the traditional income statement and publishing a separate SOCI.
A typical IAS 1 comprehensive income statement showing expenses by function is as follows:

If the costs and expenses were to be shown by their nature, the profit for the year would not change but the headings used to arrive at it would. The statement of comprehensive income would follow as set out above.

A key figure shown in the income statement, normally at the end, is that of earnings per share (EPS). This is calculated by dividing the after-tax profit by the number of equity shares in issue. Earnings per share will be shown from continuing and discontinued operations and as basic and diluted (see Chapter 6).
Profit considerations
Different profits for different purposes
A considerable amount of time could be spent discussing various definitions of profit. A starting point for an accountant might be that “a profit is produced when income is greater than costs”; for an economist it might be “what you can spend during the week and still be as well off at the end of the week as at the beginning”. The accountant’s definition necessitates the practical application of the principles of recognition, realisation and accrual. The economist’s definition would probably include capital or financial maintenance as one of financial reporting’s basic principles or rules.
Profit can be defined as the difference between a company’s equity or net assets at the start and end of a period. Profit can arise only when equity has increased. For example, a company starts business with equity of $1,000 and uses this to purchase an asset that is later sold for $1,500. Inflation is 10% per year, and the replacement cost of the asset at the end of the period is $1,300. What profit has the company made? The simple answer, of course, is $500. Traditional historical cost accounting shows an opening equity of $1,000, closing equity of $1,500 and, ignoring inflation, a profit for the period of $500.
Profit |
= |
sales revenue |
– |
cost of sales |
$500 |
= |
$1,500 |
– |
$1,000 |
If the purchasing power of the company is to be maintained, the impact of inflation must be taken into account. Financial capital maintenance calls for $100 (10% of the opening equity) to be set aside, resulting in a profit of $400.
If the intention is to maintain the physical operating capability of the company, sufficient funds must be available to replace the asset and continue the business. Operating capital maintenance requires $300 to be earmarked for the replacement of the asset and profit becomes $200.
What happens if an investment held by a company increases in value during the year? If the investment has not been sold (realised), should the increase in value be included in income for the year? Economists would argue yes. Accountants weighed down with prudence and realisation issues generally say no. Current financial reporting practice accepts the recognition of events or transactions that have not yet been fully realised.
One of the difficulties in reading an income statement is to decide what should be taken as “the” profit for the year. This depends on what is being looked for and why. There are different profits for different purposes. It is impossible to have a single profit figure for a company, let alone a single profit for all companies. That is why you will find several different profits appearing in the income statement. After following accounting standards and satisfying the auditor, companies must still be allowed some flexibility as to which figures they highlight in the financial report.
Matching and accrual
The income statement covers a company’s financial year, which normally, but not always, consists of 12 months or 52 weeks. If the income statement’s main purpose is to show the profit for the year, it is important that income and expenditure be matched to relate to the year in question. There is often a difference between when a transaction occurs (cash is paid or received) and when it should appear, or be recognised, in the income statement. For example, what happens when materials are used to produce products that are sold this year but the customer is not going to pay until the next financial year? Or when materials have been received and paid for this year but not yet used in production? In the income statement, the income produced during a financial year is set against the expenses associated with that income: income and expenditure are matched.
It must not be assumed that the profit displayed in the income statement is represented by cash at the end of the year. A company can show a profit for the year, but this does not mean it has cash available. Even if a company makes no investment in assets to sustain the business for the future, a profit in the income statement is no guarantee that adequate cash or liquid assets appear in the statement of financial position at the end of the year.
When preparing an income statement, an accountant includes the total sales revenue produced during the year. This figure includes both cash and credit sales. A company offering customers credit terms is, in effect, lending them its money until payment is made. A sale is made, and therefore included in the income for the year, but no cash may have been received.
Money owed by customers is referred to as either trade receivables or debtors. Credit sales are included in the figure for sales revenue in the income statement and appear in the statement of financial position as a heading within current assets. When customers pay the amount due, the figure for receivables is reduced and the cash balance increased by the same amount in the balance sheet.
A company taking advantage of credit terms offered by its suppliers for materials and services for use during the year may not pay for them by the end of the year. Until the suppliers are paid, the money owed (trade payables or creditors) is shown in the balance sheet within current liabilities. The timing difference between the recognition of a transaction or event and the associated cash movement can have important implications for a company. When the suppliers are paid, the figure for payables reduces and the cash balance is reduced by the same amount.
Overtrading
What happens when credit given exceeds credit taken? A company may be achieving a healthy profit margin on sales but, at the same time, offering its customers much better, longer, credit terms than it can obtain from its suppliers. The terms of credit given and taken have no impact on the profit disclosed in the income statement, but they can significantly affect the cash position or liquidity of a company.
For example, a company starts the year with $2,000 cash. With no credit given or taken, sales revenue is $10,000 and the cost of sales is $8,000. A profit of $2,000 is shown in the income statement and a cash balance of $4,000 in the year-end balance sheet.
$2,000 cash + ($10,000 sales revenue – $8,000 cost of sales) = $4,000 cash
If credit is given and taken, at the end of the year the company is owed $5,000 of the $10,000 sales revenue and owes its suppliers $1,000. The cash position then changes.
$2,000 cash + ($5,000 sales revenue – $7,000 cost of sales) = $0 cash
In both examples, the net current assets have moved from $2,000 at the start of the year to $4,000 at the end. However, with the credit policy adopted in the second example, the cash position has deteriorated from $2,000 at the beginning of the year to zero at the end. Although the company may be trading profitably, it is running down its liquid resources to possibly dangerous levels. This is often referred to as overtrading: profit being generated at the expense of liquidity.
If a company extended further credit or a major customer became a bad debt, it would be forced to borrow money to keep trading. Before such an event occurred, the company might be well advised to look for alternative forms of finance for its future operations and growth.
Since the dangers of overtrading are so clear, why do companies get into such positions? Overtrading is most commonly associated with growth. A traditional means of increasing sales revenue is to offer good credit terms to customers. If the financial implications of the sales policy are not taken into account, a company may show rapid growth in revenue and profit but run out of cash and be unable to continue trading.
Another reason for adopting a generous credit policy is because everyone else does. If a business has traditional terms of trade with customers or if the majority of companies in a sector decide to change their credit terms, it is difficult for one company, particularly a small one keen to gain market share, to act differently.
The standard reporting period for all companies and all countries is 12 months and accounts are presented each year. Although this is logical and useful, the calendar year is not necessarily the best timescale for company reports. Annual reports may be suitable as a basis for assessing the performance and position of retail companies but not for companies involved in gold, oil or gas prospecting or planting oak trees.
In connection with a company’s income statement, it is important to be aware that occasionally the year may consist of more or less than 52 weeks or 12 months. It is common for companies to have a trading year end on the last Friday of one month of the year or to be operating on internal reports covering 13 periods of 4 weeks in the year. As a result, some years may have 53 rather than 52 weeks. If this is the case, it must be taken into account before using the figures for analysis or drawing any conclusions from comparing one company with another. Though, in practice, this does not have much impact on the analysis of the company concerned.
More significant is where there is a major change in the financial year end. A company may wish to move its year-end reporting into line with other similar companies, or it may have become part of a group of companies having a different year end. This can cause problems for financial analysis, particularly if seasonality is involved, such as a retail company moving from an end-December to an end-March year end.
Continuing and discontinued businesses
The income statement will normally show revenue and profit divided into that produced from continuing operations, discontinued operations and any acquisitions made during the year. This makes it easier to analyse the company, with details of continuing operations providing the basis upon which to forecast likely future performance.
Any material events or items that will assist a user of the annual report should be disclosed. If a company acquires another during the year and the resulting revenue or profit is more than 10% of the total of the group, it would be reasonable to assume that this information will be disclosed separately, either on the face of the income statement or in the notes.
If a company disposes of or otherwise divests itself of a business this is called a discontinued operation (IFRS 5). When this occurs, the comparative figures are restated to highlight the revenue and profit or loss of that business. The division of operating profit between continuing and discontinued operations is shown in the same way. This makes it easier to assess revenue and profit trends and therefore what the company is likely to achieve in the forthcoming year from its continuing businesses. The FASB and the IASB are working towards providing guidance for better reporting of business disposals. Emphasis will be on presenting information only on the disposal of a major line of business or geographic area of operations representing a “significant strategic shift” in the business.
Associates and joint ventures
The company’s share of the profit or loss of associates, or joint ventures or arrangements (Chapter 2), is shown separately in the statement of comprehensive income. In 2013, IFRS 11 replaced IAS 31, and together with IFRS 12 and IAS 28 now deals with the provision of information on associates and joint ventures. An associate is a business over which the company has a significant influence but not complete control. The investment in associated companies will be shown as part of non-current assets.
Nuts and bolts
Sales revenue and recognition
The first figure appearing in an income statement is normally that of sales revenue, turnover or income for the year – all intercompany sales will have been removed. IAS 18 deals with sales revenue and will be replaced by IFRS 15 from December 2017. In most cases sales revenue is shown net of any sales taxes. However, some companies quote gross revenue. Watch out for this when comparing companies within a sector for size, growth, or profitability; many of the ratios discussed in this book will be distorted if gross rather than net revenues are used as their base.
The income statement should provide a single figure for sales revenue. Do not assume, however, that there can be only one correct figure. A sale is not always easy to define. Is sales revenue to be recognised when the order is placed, when the customer’s cash is received, or when the order is shipped? How should revenues flowing from a five-year service and rental contract or a three-year construction project be treated?
Deciding which figure to use for sales revenue is not as simple as it might seem. In 2001, in an attempt to make some sense of revenue recognition, the ASB published a discussion paper, Revenue Recognition, of over 150 pages, and in 2011, jointly with the FASB, Revenue from Contracts with Customers. This work forms the basis for IFRS 15. Businesses face a variety of problems in deciding at what point a sale should be recognised in the income statement. It may be assumed that when the right to or ownership of the goods or services has passed to the customer that is the point at which a sale is included in the income statement. FRS 102 states that this occurs when the company has “transferred to the buyer the significant risks and rewards of ownership of the goods”.
Internet and software companies have caused problems for accountants as they try to devise rules for sales revenue recognition. There are B2C (business to end consumer) and B2B (business to intermediate consumer) transactions as well as barter deals to sort out. Is there revenue to recognise when two websites “swap” advertising space? The rule here is that if the value involved cannot be quantified – measured reliably – no revenue should be recognised. This is a good example of the accountants’ rule: “If you can’t measure it, don’t use it”. Another potentially fraught area is the treatment of customers’ rights of return.
Revenue is used as the basis for assessing the past, current and likely future performance of a company. It is an important factor in profitability – normally, the higher the sales revenue the greater is the profit. Revenue recognition is a problematic area; more company restatements of financial statements result from this than from any other factor. Issues of consistency, comparability, prudence, accrual, realisation, recognition and substance over form have to be faced. A simple test is whether, following the transaction, a quantifiable asset – the right to receive income in the future – and a liability – the obligation to deliver – have been created. If this is the case, the revenue should be recognised in the income statement. IAS 1 states that income should be recognised when “an increase in future economic benefits related to an increase in an asset or a decrease in a liability has arisen and can be measured reliably”.
IFRS 1 ensures that the income statement includes comparative and consistent figures for the previous year. Auditors have responsibility for the accuracy of the information provided. The US Securities and Exchange Commission (SEC) requires public companies to provide comparative figures for the current and previous two years. Figures for earlier years will be included in the company’s five-year or ten-year historical performance table to be found elsewhere in the annual report.
Creating sales
In the 1990s there were numerous examples of creativity enabling companies to show substantial and consistent revenue growth, at that time mistakenly seen as a key indicator of performance and success. These included:
- goods on sale or return to customers treated as sales;
- secret “side agreements” giving customers the right to cancel a sale, but including it in the sales revenue for the year;
- all potential income from long-term contracts taken immediately rather than spread over the life of the agreement;
- taking a sale into income before the customer signs the contract;
- failing to make adequate provision for bad debts;
- sending invoices to customers for fictitious deliveries in the hope that, because of their poor internal control systems, they will pay;
- taking 100% of a sale as income even though the customer has paid only a 10% deposit;
- shipping goods early before the customer expected and including them as sales revenue for the current year – an extreme example was, when a customer refused delivery, to hire a warehouse, ship the goods to it and record the sales revenue immediately;
- grossing up sales, as when a travel agent sells a $1,000 ticket on which 10% commission is earned, but takes the full $1,000 as sales revenue;
- treating investment income and interest as operating sales revenue;
- lending money to customers to finance their purchases – the loan goes to the statement of financial position and the “sale” to the income statement;
- showing income from the sale of non-current assets as operating revenue.
More were added in the early 2000s, as the SEC brought to light:
- “channel-stuffing” – McAfee persuaded distributors of its computer-security software to hold excessive levels of inventory, using a special purpose entity (SPE) to repurchase unwanted inventory;
- making sure advertisers have funds to place adverts – Time Warner induced companies to place online adverts, which also enabled it to inflate its internet customer numbers to increase confidence in performance;
- HP Autonomy, a software company, appeared able to boost revenue by selling products at a loss to attract customers and calling this a marketing expense.
Moves by accounting bodies and stock exchanges have considerably reduced the scope for creativity in financial reports. Some of the analysis discussed later can help to highlight inconsistencies or blips in financial statements and at least signal that caution is required.
Segmental reporting
It is interesting to know a company’s total sales revenue for the year, but it is much more useful to be able to see in which businesses and where in the world that revenue was generated. Foreign operations may be seen as being more risky than home-based businesses, and it is useful to know where a company is making sales and profit. Watch out for examples of the Pareto principle or the 80/20 rule. Vilfredo Pareto, an Italian economist, found that 80% of wealth came from 20% of the population. Is a company generating 80% of income from 20% of its products or geographic areas? If so, is this likely to continue to be a practical and acceptable situation?
One of the most useful notes in a company’s annual report to help you understand what it does, where and how well is the one on what is called segmental information or reporting, or disaggregated information. The segmental report analyses a company’s turnover, profit and assets employed by major sector of activity and location. From this it is possible to study individual businesses within a group or conglomerate and to use the data to compare them with other, perhaps single business, companies. IFRS 8 provides guidelines for segmental reporting. In 2007 the EU endorsed IFRS 8 and its focus on the management information a company uses to assess its operating businesses.
The segment report should include at least 75% of a company’s revenue and profit.
UK companies have been providing segmental details since 1967 and US companies since 1970. A segment can be defined using the materiality rule of 10%. If a business or operation represents more than 10% of a company’s turnover, profit or assets, it should be shown separately in the segmental analysis report. IFRS 8 has provided guidance on segmental reporting since 2009. The aim is to show “information to enable users to evaluate the nature and financial effect of the business activities in which it engages and the economic environment in which it operates”.
The information used by management to run the company should help define the segments for inclusion in the report, so the presentation will be completed from a management viewpoint. Basing the segment analysis on a company’s internal management information is a positive step. But it means that no precise and detailed framework can be offered for the content and presentation of the report, as each company has its own methods. The information used regularly by the chief operational decision-maker (CODM) to assess performance and allocate resources should be considered a good starting point in framing the segmental report.
Generally, the three main areas of interest are revenue, profit and assets employed. Operating profit is commonly used in segmental reporting. Revenue is divided into that from external customers – as shown in the income statement – and that from other segments (internal customers). Where a single customer accounts for more than 10% of revenue the company must disclose this and identify the segment involved, but not necessarily provide any names or figures. The total assets and liabilities are shown together with depreciation and capital expenditure for each segment. Interest paid and received is also disclosed.
There is a choice to be made between the use of business or geographical segments as the basis for reporting to the company: “The dominant source and nature of the company’s risks and returns should dictate whether its primary segment reporting format will be business segments or geographical segments.”
These are normally referred to as operating segments. A 2012 survey by KPMG found that the majority of companies opted for a geographic-based segment report. A typical company will have around five segments in its segment report.
A business segment can be defined by reference to:
- nature of products or services;
- nature and technology of production;
- types of markets in which the company trades;
- major classes of customers;
- distribution channels.
A geographical segment can be defined by reference to:
- proximity of operations;
- similarity of economic and political conditions;
- relationship with operations in other geographical areas;
- special risks associated with a particular country.
There are often practical problems of allocating costs and expenses. For example, how can the total cost of a group’s directors be allocated, by product or by market? Such costs are defined as common costs, and when they are not spread among the segments they appear as a single line in the segmental report. Intersegment trading may create some technical problems for accountants and directors and will be shown separately in the report.
Cost of sales
Cost of sales can be considered the cost of materials and employees and other direct and indirect costs incurred in generating sales revenue including:
- direct materials;
- direct labour;
- all direct production overheads including depreciation;
- inventory change;
- hire of property, plant and equipment;
- product development expenditure.
Companies do not normally provide any further analysis of the cost of sales, although additional information may be found in the notes on the income statement.
Often details of employee numbers, non-current asset depreciation, leasing, and research and development will be found in the notes.
Change in inventory
Cost of sales includes the change in inventory between the beginning and end of the financial year. This is part of the matching process. Sales revenue for the year should be charged only with the cost of goods used in producing that revenue. Any items remaining unsold at the end of the year should not be charged against the year’s revenue.
Companies adopt either the perpetual method of inventory control where the records are updated each time a transaction occurs, or the periodic method where inventory is taken every now and again – including the year end. The statement of financial position value of a retail company’s inventory is often calculated by taking the selling price of the goods on shelves at the end of the year and deducting the normal profit margin – the retail method.
The value placed on inventory can be an important factor influencing the reported profit of a company. The basic accounting routine applied to arrive at the cost of sales charge in the income statement is as follows:
Opening inventory + purchases for the year = goods available for sale
goods available for sale – closing inventory = cost of sales
Inventory is often attractive not only to employees (shrinkage and wastage are euphemisms for theft) but also to those preparing a company’s financial statements for the opportunities it may allow for creativity. For example, if a company, for whatever reason, were to increase the value of inventory at the end of the year by $1,000, there would be an automatic improvement of reported profit of $1,000. Cost of sales is reduced by $1,000 to bring about the profit increase. A simple form of creative accounting is where a company keeps old and obsolete items valued at their cost in year-end inventory.

Profit is improved and the statement of financial position value for inventory increased. Nothing physical has occurred to the inventory; only its value has been changed. For every $1 added to the value of closing inventory there is an extra $1 at the bottom line of the income statement. Inventory and its valuation is an area attracting close scrutiny from a company’s auditor.
Valuing inventory
Although companies may be reluctant to admit that inventory is worth less than it cost to produce, the fair presentation requirement in financial reporting ensures that the simple rule of showing inventory at the lower of cost or net realisable value (NRV or fair value) is followed (FRS 102). The lower inventory figure shows caution in both the statement of financial position valuation and in defining the profit for the year.
IAS 2, originally issued in 1975 and revised in 2003, deals with inventories. The most common method of valuing inventory is called first in first out (FIFO). This assumes that the oldest inventory items are used first. As inventory is used or sold, it is charged to production or sales at the earliest cost price. Until it was banned in 2003, a method called last in first out (LIFO) – the reverse of FIFO – was commonly used by US companies.
The second means of inventory valuation is the weighted average cost method. The two methods are illustrated below using an example where 2,000 units of materials are purchased, 1,600 used in production, leaving 400 in the closing inventory.
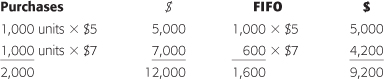
The cost of sales charge in the income statement is $9,200 and the closing inventory (400 units) is valued at $2,800 (400 units × $7). If prices are rising, FIFO may be assumed to value inventory close to its replacement cost in the statement of financial position ($4,200), but the charge for cost of sales in the income statement ($9,200) will be comparatively low. With rising prices, FIFO provides a higher “profit” than LIFO. With falling prices, LIFO is best for profit.

The cost of sales is $9,600 (1,600 units × $6) and the closing inventory is valued at $2,400 (400 units × $6).
Always read the notes relating to inventory valuation. They should show that the company has taken the lower of cost or NRV to produce the balance sheet value of closing inventory.
When cost is the basis for valuing inventory this normally includes the costs of raw materials and supplies, wages and appropriate overheads (indirect expenses). Read the notes supplied in the annual report to see if there has been any change in the calculation of the cost of inventory. This may be done to adjust the reported profit for the year. Companies should be consistent in their valuation methods; if this is not the case, there should be a good reason for the change.
If only a single figure for inventory is provided in the statement of financial position, read the notes supplied to see the split between the three headings: raw materials, work in progress and finished goods. A substantial or continuing increase in the level of finished goods may point to trading problems.
Sometimes reference may be made to a “product financing arrangement” where the company has “sold” inventory to a finance institution, agreeing to repurchase this at a set price (including financing costs) and date in the future. The company gains immediate access to cash with the inventory acting as security for the loan. On the agreed date the company repurchases the inventory for delivery to customers. Details of any such arrangements should be included in the notes to the accounts.
Gross profit
Gross profit is the first profit shown in the statement of comprehensive income using the by nature classification of expenses. This is produced by deducting the cost of sales from sales revenue. Other operating costs and expenses are deducted from gross profit to provide the operating profit and profit before income tax for the year.
Auditors’ fees
The fees paid to a company’s auditors will be shown under administrative expenses in the income statement. This figure should clearly distinguish between fees for audit and fees paid to the same firm for other work such as consultancy assignments (unlikely nowadays) or special investigations. For UK FTSE 350 listed companies, total audit fees are around £1 billion per year. A company’s audit committee has the responsibility of negotiating the audit fee and overseeing the work done. Details will be provided in their report.
As part of the annual reporting process, companies disclose details of full-time and part-time staff, either the number at the end of the financial year or, more commonly, the average, by category, employed during the year. The total payment to employees is also shown. The employee or staff cost heading covers all wages and salaries, social security costs, pensions and other employment-related payments.
Anyone legally contracted to work for the company is an employee, including part-time workers and directors. Where a company has a contract with a self-employed person, who by definition is not an employee of the company, the money is normally included under the other costs and charges heading. Directors who have a service contract with the company are classed as employees. Thus the total cost of directors is included in the figure for staff or employee expenses. There will be separate notes that deal in some detail with directors’ remuneration and rewards.
Pensions
The reward for long service with a company is normally a pension. In 1991 it was discovered that Robert Maxwell had misappropriated some £450m from his company’s pension fund. This illustrated the importance of keeping the pension fund separate from the control of the company. Companies operating a defined pension plan had some control over the amount paid in and if the investments grew faster than expected, they could both reduce the charge and bring the profit into revenue. In 1992 the Cadbury Committee made recommendations on accountability and corporate governance. Pension funds now have assets that are legally separate from the company and cannot be touched even in the event of the company’s bankruptcy. There are two types of pension scheme:
- Defined contribution. The employer pays a regular amount (normally a proportion of the wage or salary of the employee) into a pension fund. On retirement the employee receives a pension that is dependent on the size of the pension fund and its returns from investment. The company has no obligation to pay beyond its agreed contribution to the pension fund.
- Defined benefit. The pension is linked to the employee’s salary level or years of service. The company has an obligation to pay the pension whether or not the pension fund has sufficient assets or income. The company takes actuarial advice as to how much to put into the fund each year to allow future payment to retired employees. This will include the calculation of the average life expectancy of employees and the revaluation each year of the pension fund to produce a surplus or deficit.
The aim of accounting for pensions is to match the pension cost against income when it is paid. To defer any expense recognition until a pension is actually paid does not adequately match income and expense. In the early years there will be a low level of expense but it rises rapidly in later years. Matching the expected future cost against current income is crucial.
You may see reference to the “corridor approach”, which was previously allowed under IAS 19 to set limits on the actuarial differences being taken to the income statement. From 2013 all actuarial gains or losses will be shown in the statement of other comprehensive income.
IAS 19, revised in 2011, deals with employee benefits, but not the financing of pension schemes. FRS 102 requires pension costs to be charged to the income statement with any actuarial gain or loss being recognised in full in the statement of comprehensive income. The statement of financial position will show the fair value of the pension obligation. The notes to the financial statements should offer full details of a company’s post-employment benefits including a reconciliation of the movements during the year and the net asset or liability reported in the balance sheet.
Directors’ rewards
Directors’ service contracts
The Greenbury Code and the Hampel Committee (see Chapter 1) recommended that UK directors be given service contracts of no more than one year’s duration. The 2006 Companies Act sets an upper limit of two years for directors’ contracts, though shareholders can vote for a longer duration. The UK Corporate Governance Code, issued by the FRC in 2010, recommends that directors of large listed (FTSE 350) companies be subject to annual election by shareholders, and that all other company directors should serve no more than three years before re-election.
Directors’ remuneration
The actions and activities of a company’s directors form an important part of corporate reporting. In most countries there has been a flow of legislation, regulation or stock-exchange requirements covering disclosure of details of a company’s financial dealings with its directors. The Cadbury Report stated:
The overriding principle in respect of board remuneration is that of openness. Shareholders are entitled to a full and clear statement of directors’ present and future benefits, and of how they have been determined.
The Combined Code requires that three or more non-executive directors form a remuneration committee. This committee is to develop and oversee the company’s remuneration policy and the individual rewards of each executive director and the chairman. The committee will consider benefits in kind, share-based payments and any long-term incentive schemes. The intention is to provide a clear and transparent process for setting directors’ remuneration, with no director being involved in his or her personal reward package. Normally, the terms of reference and other details concerning the remuneration committee will be found on the company’s website.
In the UK, the Directors’ Remuneration Report Regulations (published in 2002), the Combined Code on Corporate Governance, updated by the FRC in 2006, and stock-exchange Listing Rules govern the directors’ report, which includes the remuneration committee report. This provides full details of the scope, membership and workings of the committee. Details of the individual directors’ remuneration packages are normally shown here. There may also be details of the number of board meetings attended during the year by each director.
Included in the remuneration committee report will be details of each named director’s:
- shareholding and options;
- salary and benefits (including increases during the year);
- bonuses and long-term incentives (cash and shares);
- key performance targets used in bonus schemes;
- service contracts;
- pension schemes.
The broad objective of a remuneration committee is seen as ensuring that:
[The] levels of remuneration should be sufficient to attract, retain and motivate directors of the quality required to run the company successfully, but a company should avoid paying more than is necessary for this purpose. A significant proportion of executive directors’ remuneration should be structured so as to link rewards to corporate and individual performance.
Best practice requires directors’ rewards to be firmly based on appropriate objective performance-related measures. These are referred to as key performance indicators (KPIs), which are defined by the 2006 Companies Act as:
Factors by reference to which the development, performance or position of the business of the company can be measured effectively.
The UK government became concerned that directors’ remuneration was getting out of control, resulting in a failure of effective corporate governance. In 2012 measures were announced to provide for better oversight of directors’ rewards through more detailed and structured directors’ remuneration reports.
The directors’ remuneration report is in two parts. The first sets out the company’s remuneration policy and its development. Shareholders are offered the opportunity to vote on their directors’ remuneration policy. The policy should be reviewed every three years. The second, published each year in the annual report (from 2014), explains how the policy was implemented during the year and the links between company performance and executive reward. A single figure for actual remuneration received by each director is shown.
Rather than being paid in cash employees may be given shares in their company. This is seen as an effective means of providing employees with the incentive to assist in the creation of a successful company. If the company performs well, the share price will rise and they will benefit. Share options may be offered as an alternative to pay or as part of an executive remuneration package. The current market share price can be taken as a simple guide to the benefits employees are receiving. Share options have long formed a part of directors’ remuneration packages.
It can be argued that share options offer management rewards but no penalties, and that they focus attention on short-term gains that may not be in the long-term best interests of the company. Management does not have the same downside as shareholders if things go wrong.
Many companies operate share (stock) incentive plans (SIPs). These give all employees the opportunity of owning shares in their company. Other companies offer selected employees, as a reward for past or as an incentive for future performance, the right to purchase shares at a favourable price. Share options can be a more effective means of providing employees with net income than straightforward taxable remuneration. In the 1990s many e-companies offered share options. The cost to the company was negligible and no cash was involved. The potential reward for the individual could be significant, and this was expected to ensure loyalty and top performance. In 2000, when many of these companies joined the “99% Club” (their share price dropped to 1% of its previous level), the true value of the share options was revealed.
IFRS 2 (130 pages in length), IAS 26 and FASB Statement 123 deal with share-based payment schemes. A key issue is the timing: when does the benefit from the share option occur? When should it be recognised in the income statement? Is it on the granting of the option or when the option is exercised? Whether it is even appropriate to charge the income statement with the fair value of share options has been the subject of fierce debate between businessmen (anti) and accountants (pro). Both the FRC and the FASB were in favour of charging the fair value of the share option as an expense in the income statement, but they came under considerable corporate and political pressure not to follow this route. Eventually the accountants got their way.
Share options act to reduce shareholders’ investment: when shares are issued their holding is worth less. There is a transfer from shareholders to management. IFRS 2 requires that the cost of the option be set at the time it is granted not when it is exercised. Share options are not revalued each year. The value of the option is set with reference to the fair value – normally the market price – of the shares when granted. If a comparable market price is not available, an option-pricing model – such as the Black-Scholes-Merton (BSM) formula, or the Cox, Ross and Rubinstein binomial model – may be used. The pricing model must take into account the:
- exercise price of the option;
- expected term of the option;
- current market price of the share;
- expected volatility of the share price;
- dividends expected to be paid;
- risk-free interest rate.
If a share option, expected to be taken up in five years’ time, is offered when the current share price is $10, with a risk-free interest rate of 4%, the option value is $1.78 per share.
PV of $10 at 4% in 5 years = $ 8.22 $10 – $8.22 = $1.78
The time value of money (present value or PV) is used to calculate the value of $10 received at the end of five years with an interest rate of 4% as $8.22. If $8.22 is invested for five years at 4% interest, in the first year it would earn $0.33 interest, in the second year $0.34 and so on until the capital value at the end of the fifth year is $10. This calculation is completed using present value factor (in this case 0.8219) tables found in any spreadsheet application.
The risk-free interest rate is normally taken to be that of government treasury notes with a similar lifespan to that of the option. Any dividends that would have been received on the shares are similarly discounted and the total deducted from the option – they have been forgone – to produce the net value. The fair value of an option is charged to the income statement over its expected life – this is the period it is earned by the employees. A compensating adjustment is made to equity which will show the share options granted as a separate item.
The remuneration committee’s report and notes should provide full details of each director’s options awarded or exercised during the year and the number of shares involved at end of the year. There are some weighty notes in the annual report. Do not be put off as their study may well repay the effort of analysis. IFRS 2 ensures that as a minimum the following information will be available:
- the nature and extent of the scheme;
- how fair value was determined;
- the effect on the profit or loss for the period;
- the effect on the company’s financial position.
Make a loss, take a profit
There have been many examples of directors receiving substantial sums – described by Vince Cable, a British politician, in 2012 as “rewards for failure” – in return for giving up their tenure of incompetence in managing loss-making companies. Charles Prince, CEO of Citigroup, left the company in some disarray. In 2007 it was expected that the bank might have to write off some $10 billion of subprime loans. Eventually, after a $45 billion government contribution, the figure was nearer $100 billion. Prince seems to have walked away with more than $40m, including pension, accumulated stock options and a final-year bonus of $12m. He did say “sorry”, but he is likely to be remembered for his statement:
When the music stops … things will get complicated. But as long as the music is playing, you’ve got to get up and dance.
Other financial institutions were forced to make more than generous final payments to executives who had taken their company to the brink, and sometimes over the edge, of the precipice. Any payment in compensation for loss of office and any significant payments made to directors, including former directors, should be fully disclosed in the annual report.
The annual report gives details of the directors’ aggregate remuneration or emoluments and identifies the total amount paid to each director for services in connection with the management of either the holding company or any subsidiary. Pensions paid to past directors are also shown. The disclosure should make it possible to identify all the payments made to directors during the year. For example, if a retired director is allowed to continue using a company car, the estimated value of this benefit should be shown separately within the disclosure on post-employment benefits.
Operating profit
An important measure and indicator of a company’s performance is the profit made from running the business; that is, the profit generated from its operations. If gross profit is not shown, this is normally the first profit disclosed in the income statement. Operating profit is calculated by deducting the cost of sales plus other operating expenses from sales revenue. It is reasonable to assume that the operating profits of different companies trading in the same business sector can be compared on a common basis.
Depreciation and profit
Capital maintenance is an important factor in corporate reporting. To continue in business, a company is expected at least to maintain the current level of investment in operating assets and to replace these assets as they wear out or become obsolete. Capital employed is on one side of the statement of financial position and assets on the other. If assets are maintained, capital must also be maintained. One way of achieving this is through depreciation, the setting aside of current revenue for future reinvestment in the business. The cost of the asset is charged against income over its useful working life. IAS 16 requires all tangible assets, except land, to be depreciated, and defines depreciation as “the systematic allocation of the depreciable amount of an asset over its useful life”.
It is possible to consider depreciation in at least three ways:
- In the statement of financial position a company is expected to provide a reasonable representation of the fair value of its assets. In normal circumstances a new car is worth more than an old car. As an asset gets older and its value decreases, this change in value should be reflected in the statement of financial position.
- As a company carries on its business, it uses resources. It incurs costs and expenses, uses labour and materials (direct costs), and uses up some of the value of the non-current assets, property, plant and equipment employed in the business. To produce a profit or loss in the income statement, all costs and expenses are deducted from revenue. The direct costs are charged and some allowance made for the cost of using the non-current assets during the year. Part of the value of property, plant and equipment has been used up during the year (indirect costs). To reflect this an amount is charged in the income statement. Thus depreciation may be considered to be the cost of the various non-current assets being used during the year.
- If a company is to continue in business, at some stage it will have to replace its non-current assets as they wear out or become obsolete. To provide for this the company prudently sets aside funds. Depreciation is charged in the income statement but is not actually paid out to any third parties; it is retained in the company.
A company that fails to charge depreciation breaches not only the requirement of prudence in financial reporting but also the fundamental requirement of capital maintenance.
Calculating depreciation
The annual depreciation charge should reflect “the pattern in which the asset’s future economic benefits are expected to be consumed”.
There are many ways of calculating depreciation. For example, a company purchases an asset with an expected working life of four years for $10,000. The company makes a profit of $3,000 per year, 50% of which is distributed as a dividend to shareholders. At the end of the fourth year the replacement cost of the assets is $10,000.
If no depreciation were charged, the company would retain $6,000 profit ($1,500 for four years). If there were no other transactions, this would appear in the closing cash balance at the end of year four. There would not be sufficient funds available for replacement. Had the company charged $2,500 per year for depreciation (writing off the asset over the four-year working life), the net profit would have been only $500 each year. If 50% of this had been paid to shareholders as dividend, there would have been only $1,000 of retained profit at the end of year four. However, there would be $10,000 available in cash to replace the asset ($2,500 for four years). IAS 16 offers three methods of depreciation: straight line, diminishing balance and unit of production.
Straight line method
The simplest and most commonly used method of calculating depreciation is the straight line method. The cost or value of the asset is divided by its anticipated useful working life to produce the annual depreciation charge.
Cost of asset |
$10,000 |
Estimated useful working life |
4 years |
Annual depreciation charge |
$2,500 |
Diminishing balance method
A second method, often required by tax authorities, is the diminishing or reducing balance method. This is sometimes referred to as accelerated depreciation as the higher charges occur in the first few years of the asset’s life.
Cost of asset |
$10,000 |
Depreciation rate per year |
50% |
In the first year $5,000 depreciation is charged in the income statement. This reduces the carrying value of the asset to $5,000, and so in the second year the depreciation charge is $2,500. Under this method the asset is never written down to a zero value.
A variation on this approach is the sum of the digits method. The expected useful working life of the asset is four years. All the digits – 1,2,3,4 – are added together, producing a total of 10. (If the asset life is ten years, the sum is 55.) In the first year the depreciation charge is four-tenths of the asset value ($4,000), in the second it is three-tenths, and so on, until in the final year one-tenth is charged to fully depreciate the asset.
Unit of production method
This is sometimes referred to as the unit of activity method. The total number of units that the asset is expected to produced is calculated. The cost of the asset is divided by this number to provide the depreciation charge per unit produced.
Cost of asset |
$10,000 |
Expected units to be produced over asset’s working life |
100,000 |
Depreciation charge per unit of production |
$0.10 |
If 30,000 units are produced in the first year, the depreciation charge will be $3,000. This depreciation method provides the most direct link between the use being made of the asset and the charge made against operating income. However, if the asset is not used during the year, there will be no charge against income even though, realistically, the asset can be assumed to have lost value.
The three methods of calculating depreciation will, each year, result in a different charge for the asset being made in the income statement and in its carrying value in the statement of financial position.
$ |
First-year charge |
Year-end value |
Straight line |
2,500 |
7,500 |
Diminishing balance |
5,000 |
5,000 |
Unit of production |
3,000 |
7,000 |
Depreciation policy
Always read the notes on non-current assets and their depreciation carefully. A company’s asset valuation and depreciation policies should be reasonable, prudent and consistent. If this is not the case, you need to satisfy yourself that income is not being manipulated. It is possible to boost reported profit if all expenses relating to an asset, including the interest charges for its finance, are capitalised rather than charged to the income statement. Compare the company’s policy with that of others in the same sector to make sure there is conformity.
It is not difficult to imagine a situation in which a company would prefer not to operate a prudent depreciation policy. Low profitability might be bolstered by not charging any depreciation in the first year of a new asset being brought into operation. The company might argue that as the new investment – particularly if it is property – was operational for only part of the year, it is reasonable that it should not be subject to depreciation. Thus the new investment would generate revenue but not be burdened with the depreciation. Once such an approach is accepted, the consistency rule will ensure its application in future years.
Taxing matters
The profit before tax reported in a company’s accounts is unlikely to be the profit used to calculate its eventual tax liability. A simple means of assessing this is to estimate the actual tax rate being paid on a company’s reported profit. This can be done by using the pre-tax profit and income tax expense appearing in the income statement. The resulting figure can then be compared with the rate of company taxation for the country involved. A number of international companies have been criticised for managing their corporate structures to ensure they pay as little tax as possible in high-tax countries. This is tax avoidance and, though seen by some as unethical, is not illegal. Tax evasion is illegal.
Generally, the actual company tax rate will be found to be lower than the standard rate imposed by government. The rate of tax being paid should be disclosed, and the amount due at the end of the year shown in the statement of financial position as part of current liabilities. IAS 12 requires that the tax due on a company’s ordinary operations should be shown in the statement of comprehensive income.
If companies were allowed to set their own rates of depreciation in arriving at taxable profit without any external controls or guidance, no company would need to end up with a tax liability. The standard practice in most countries is to have two rates of depreciation, one that is allowed and accepted for tax purposes and one that is applied by companies in their financial reports. Inevitably, there is a difference between the profit a company declares to its shareholders and the profit it declares to the tax authorities. Accounting profit is defined under generally accepted accounting principles (GAAP); taxable profit is defined by IAS 12 as:
The profit for a period, determined in accordance with the rules established by the taxation authorities, upon which income taxes are payable.
Deferred taxation
Depreciation is often the cause of a significant difference between a company’s reported and taxable profit. A company has little option but to accept the tax rules prescribed by the country or countries in which it operates. If tax incentives are offered to encourage investment, any company can be expected to take full advantage of them. However, this can affect its reported after-tax profits. This is the result of what is called timing or temporary differences.
One explanation for the taxation differences is that a company may depreciate its non-current assets using the straight line method of depreciation but is required by the tax authority to use a different depreciation method – normally an accelerated rate method – in calculating its taxable profit. As an incentive to investment, companies may be allowed to charge 125% of the asset cost as tax allowable depreciation, or be allowed to charge the total cost against taxable income in the first year of operation. A difference arises in the amount charged in the income statement to arrive at the profit for the year and that used in the tax calculation. Some tax is deferred to future years.
A company may have interest income during the year of $5,000 which will be included in pre-tax profit. If tax is paid only when the interest is received in cash, and at the end of the year $1,000 is still due, the company’s taxable profit will not be the same as its accounting profit. The impacts of investment and the associated tax implications may not occur in the same time period. This can distort the reported after-tax profits and is overcome by use of a deferred taxation account, sometimes referred to as a tax equalisation account.
IAS12 requires a company to show the amount of tax that relates to the pre-tax profit being reported. This is not the same as showing the actual amount of tax paid in the financial year. The income statement should show the amount of tax due to be paid in the current year (current tax expense). The statement of financial position should show the future tax liability (deferred tax liability). Deferred tax will be calculated using the expected future tax rates that will apply to the transaction involved. There may be both deferred tax liabilities and deferred tax assets. A deferred tax asset is where tax will be recoverable in future years including unused tax losses and credits.
Reconciling the books
Companies keep at least three sets of books. One is for management to enable them to run the company; the second is for the tax authorities to calculate the annual tax liability; and the third is presented to the shareholders at the AGM in the annual report. The three sets should, under normal sound accounting practices, be capable of reconciliation.
Capital or revenue
The decision on whether an item should be treated as capital (statement of financial position) or revenue (income statement) in the year reinforces the links between the statement of financial position and the income statement in connection with the treatment of non-current assets. Revenue expense is related to the normal business activity of the company or is concerned with maintaining the non-current assets. Capital transactions are normally intended to provide a long-lasting asset to the company.
The treatment of research and development (R&D) costs is a good example of the potential importance of the revenue or capital expense decision. The result of this decision can have a significant impact on both the income statement and the statement of financial position.
For example, a company invests $100,000 in R&D each year. It is expected that the new products and services delivered by the R&D will come on stream over the next ten years. The company’s policy is to provide shareholders with a regular $25,000 dividend, as shown in year 1.

The company experiences a downturn in business, profit is halved in year 2 and there is insufficient profit available to pay the dividend (year 2a). There is little the company can do in operational terms (generating additional revenue or reducing costs), but it might be tempted to consider a change in its policy for the treatment of R&D.
It could be argued that a better form of presentation and a more accurate reflection of the events would result from spreading the investment in R&D. That is, it would be better to spread the amount spent on R&D over the years when the new products and services result. It could be argued that it is unfair accounting treatment to burden one year’s sales revenue with what is really ten years’ investment in R&D.
The company opts to charge only one-tenth of the R&D spend against year 2 sales revenue, and to continue writing it off over the next nine years. The charge in the income statement is $10,000 (year 2b) and the balance, $90,000, is capitalised as a non-current asset in the statement of financial position.
The impact of this change in accounting presentation is that the company in year 2b shows a profit of $65,000, and so may pay the dividend to its shareholders. It also exhibits a new asset, R&D valued at $90,000, in the statement of financial position. Although it is not possible to fault the book-keeping involved in this exercise, it might be possible to raise questions about the validity of displaying R&D as an asset in the balance sheet.
There were many examples of companies capitalising R&D and then discovering that under pressure it was impossible for it to be translated quickly into positive cash flow. In response to this, and to avoid the potential misrepresentation or error in companies’ financial reports, R&D became subject to an accounting standard which enforced the prudence rule and required companies to write it off as incurred.
IAS 38 defines research as “original and planned investigation undertaken with the prospect of gaining new scientific or technical knowledge and understanding”. Development is defined as: “The application of research findings or other knowledge to a plan or design for the production of new or substantially improved … products … or services before the start of commercial production or use.”
The future economic benefit likely to flow from research is uncertain. It is an intangible internally developed asset and, as with internally generated goodwill, it cannot be capitalised. IAS 38 provides a list of criteria which must be met for development expenses to be capitalised.
The example of R&D may now be only of historical interest, but many of the same issues face companies today regarding such intangibles as brand names (see Chapter 2). When a company is so desperate to show a profit that it throws the rulebook away, it is not unusual to see expenses capitalised. In the 1990s there were examples of companies:
- adding maintenance and repairs to non-current asset values;
- capitalising software that had dubious real value;
- capitalising internal software costs;
- capitalising marketing and advertising expenses.
Once this is done the cost is written off over a number of years or treated as a one-off non-recurring or special charge not affecting the current year’s reported profit. With the CEO insisting “we have to hit our numbers”, reducing real capital expenditure and capitalising operating expenses were crucial to WorldCom’s creative accounting, contributing some $3.8 billion to the overall $11 billion fraud.
Interest paid by a company on borrowings and interest received on investments is shown either on the face of the income statement or in the notes. Often the income statement figure is for net interest payable, representing the interest payable less the interest received and any interest capitalised.
The total interest payable during the year should be divided into interest relating to short-term borrowings, such as bank loans, repayable on demand or within 12 months, and interest on loans falling due within five years.
Capitalising interest payments
If a company borrows money to complete a major project, such as building a new factory or hypermarket, it is possible, under IAS 23, to capitalise the interest payments and write them off following the company’s normal depreciation policy. Although this is acceptable as the interest expense has been incurred to allow the asset to be built, it does increase the reported profit. The notes in the accounts should clearly indicate how much interest has been capitalised during the year.
When looking at the interest paid by a company, perhaps for use in an interest cover measure, it is best to use the total interest payable figure. That a company has capitalised a proportion of its interest payments does not affect how much interest it has to pay.
Effective interest method
When a company invests or borrows money for a number of years in return for interest payments, there are some issues of recognition and valuation to be tackled. A company sells a product for $50,000 with a down payment from the customer of $10,000 and five annual instalments of $10,000. If the current cash price for the product is $40,000, and the ruling interest rate is 5%, what should be shown in the accounts? It would not be correct to record a sale of $60,000 immediately in the income statement. IAS 18 requires the transaction to be shown as part sales revenue and part interest income spread over the life of the contract.
The effective interest rate must be calculated. This is the rate that discounts the expected future income or expense stream to equal the current carrying amount of the asset or liability. This is undertaken using discounting techniques.
Using the present value of an annuity table (regular amounts paid for a defined number of years), it can be seen that the 5% factor for five years is 4.3295. If $10,000 is to be received for the next five years, its present value is $43,295. If $43,295 were invested today at 5% interest, in five years’ time it would be worth $50,000. Alternatively, if a loan was taken out for $43,295, it would be repaid (plus interest) with five annual payments of $10,000 according to the example below. The second column gives the 5% interest charge on the reducing balance and the third column the amount of principal that is being repaid.

The present value can be used to calculate the amount to be brought into the income statement as recognised revenue. The company should recognise $53,295 ($10,000 down payment PV $43,295) income in the first year. Each year the company would bring into the income statement the interest shown in column three of the example ($2,165 and so on).
Operating and finance leases
A further example of the distinction between capital and revenue items is found in the treatment of leases. FRS 102 and IAS 17 provide the guidelines for the treatment of lease agreements and define a lease as “an agreement whereby the lessor conveys to the lessee in return for a payment or series of payments the right to use an asset for an agreed period of time”.
Should lease payments be treated as an operating expense (income statement) or as the acquisition of a non-current asset (statement of financial position)? The decision will affect reported profit for the year. The reporting of lease arrangements was manipulated by companies in the 1990s to bolster profits and disguise asset ownership.
The main criterion is whether the rights and associated risks and rewards of ownership of the asset pass to the lessee. If they do, the lease is capitalised and taken into the statement of financial position (a finance lease). If they do not, it is assumed that the asset is being rented and the lease payments are included as an operating expense in the income statement (an operating lease).
A finance lease is one “that transfers substantially all the risks and rewards incidental to ownership of an asset. Title may or may not be eventually transferred”.
Substance over form – fair representation – requires that if the lease in effect transfers ownership to the lessee, it is treated as the acquisition of an asset. In 1974 Court Line, a UK package holiday company, collapsed. It leased its aircraft and kept them off-balance sheet. It had some £18m of shareholders’ funds but more than £40m of lease obligations. Today the application of IAS 17 would ensure the substance of the lease agreements would show in the statement of financial position under the heading of finance leases.
Any other type of lease agreement is an operating lease. An operating lease shows the lease payments as an expense in the income statement and there are no entries in the statement of financial position.
A finance lease is recognised in the statement of financial position at the fair value of the leased asset or the present value of the minimum lease payments (MLP). If a lease is agreed for an asset with an immediate payment of $10,000 and three annual payments of $10,000, and an implicit interest rate of 10%, it has a discounted present value of $34,869 (down payment $10,000 PV factor 2.4869). The present value of minimum lease payments is $34.869. An asset and a lease liability are recognised and depreciated over the lease period.
IAS 17 requires that leases be classified according to their life – within one year, 2–5 years and longer than five years – with the PV and MLP shown for each class of lease.
The profit attributable to shareholders forms the potential source of dividend payments. A dividend can only be paid from profit. If a dividend were paid from capital, the capital maintenance rule would be breached. The dividends the company has paid (interim dividends) and the amount the directors have proposed for the year (final dividend) are normally shown as a single figure in the statement of changes in equity.
When a dividend is declared as 10% this relates to the nominal value of the shares involved, not their market value. A company with $1 or £1 shares paying a 10% dividend is offering shareholders 10¢ or 10p per share.
It is common for companies to offer shareholders, as an alternative to taking a cash dividend, a scrip or stock dividend. This has the advantage of not reducing the company’s cash balances and of offering shareholders additional shares with the possibility of increased capital gains and future dividends.
No profit, no dividend
Basic good housekeeping would suggest that a company with little or no profit should not be expected to pay a dividend. Technically, it is possible for a company with a loss for the year to pay a dividend. As long as it has sufficient distributable reserves in the statement of financial position, and of course enough cash, a dividend can be declared.
Retained earnings
After all costs, expenses, and interest and dividend payments have been covered, what is left is retained earnings (net income or surplus). This is taken to the statement of financial position to add to the accumulating shareholders’ interest (equity).
Pro forma profits
Always make sure the profit figures you are using are taken from the published income statement. A recent trend is for companies to offer “pro forma” financial information to investors. In 2002 the International Organisation of Securities Commissions (IOSCO) recommended caution when using non-GAAP figures:
Investors should be aware that non-GAAP pro forma earnings measures are not prepared in accordance with the accounting standards applied to financial statements and may omit or reclassify significant expenses.
In the US, the Sarbanes-Oxley Act of 2003 was supported by the SEC with firm rules covering all pro forma financial information released by listed companies
Interim reports
The annual report is not the only financial statement available to assist in the analysis of a company’s performance and position. Listed companies are required to publish interim reports. These normally cover a period of three or six months. The objective is to keep investors aware of company performance. IAS 34 details the minimum content for an interim report. The report should assist in identifying any changes in the organisation, trends or volatility of company income, liquidity and cash flow generation. It should also bring investors up to date with new activities or circumstances arising since the last annual report. Comparative figures are provided.
There are two views of an interim report. US companies see it as part of the annual reporting process (integral view) and expenses are spread over the appropriate period. UK companies see it as a separate report (discrete view) to be prepared in exactly the same way as the annual report, and expenses are recognised as incurred with no spreading. A company can opt to present a complete set of financial statements rather than the condensed format, which includes a condensed:
- balance sheet;
- income statement;
- changes in equity statement;
- statement of cash flows.
Also disclosed are:
- earnings per share;
- dividends paid;
- segmental analysis;
- statement of accounting policies and methods;
- management discussion of events.
Companies generally publish their interim statements only online. Shareholders will not necessarily be mailed copies.
Preliminary announcements
Companies are expected to make a preliminary announcement of annual results and dividend within 120 days of the financial year end, with most companies complying within 90 days. The preliminary announcement contains information similar to that of an interim report, and, ideally, provides some linkage to the final quarter or second half of the year. It acts as a quick overview of the annual report and normally forms the basis of a company’s press releases and media comments on its performance.
Receipt of a preliminary announcement used to be a major advantage for analysts as it was not mailed to shareholders. The internet now makes it possible for anyone using the company’s website to have almost as speedy access to this information as the professionals.