Real-world math is our title for the grab bag of math topics that will be heavily tested on the GRE. This chapter details a number of important math concepts, many of which you’ve probably used at one point or another in your daily adventures, even if you didn’t recognize them. After completing this chapter, you’ll have brushed up on important topics such as ratios, proportions, and averages. You’ll also learn some important Princeton Review methods for organizing your work and efficiently and accurately answering questions on these topics.
A few years ago when ETS reconfigured the GRE, they wanted the Math section to test more of what they call “real life” scenarios that a typical graduate student might see. You can therefore expect the math questions on the GRE to heavily test topics such as proportions, averages, and ratios—mathematical concepts that are theoretically part of your everyday life. Regardless of whether that’s true of your daily life or not, you’ll have to master these concepts in order to do well on the GRE Math section.
If you’re comfortable working with fractions and percentages, you’ll be comfortable working with ratios and proportions, because ratios and proportions are simply special types of fractions. Don’t let them make you nervous. Let’s look at ratios first and then we’ll deal with proportions.
Recall that a fraction expresses the relationship of a part to the whole. A ratio expresses a different relationship: part to part. Imagine yourself at a party with 8 women and 10 men in attendance. Remembering that a fraction expresses a part-to-whole relationship, what fraction of the partygoers are female?  , or 8 women out of a total of 18 people at the party. But what’s the ratio, which expresses a part to part relationship, of women to men?
  , or as ratios are more commonly expressed, 8:10. You can reduce this ratio to 4:5, just like you would a fraction.
On the GRE, you may see ratios expressed in several different ways:
x : y
the ratio of x to y
x is to y
In each case, the ratio is telling us the relationship between parts of a whole.
Every ratio can be expressed as a fraction. A ratio of 1:2 means that the total of all the parts is either 3 or a multiple of 3. So, the ratio 1:2 can be expressed as the fraction  , or the parts of the ratio can be expressed as fractions of the whole as
  and
and  . Likewise, the fraction expresses the ratio 1:3. So if a question says “the ratio of x to 2y is ,” then that would be expressed as
  .
.
Anything you can do to a fraction you can also do to a ratio. You can cross multiply, find common denominators, reduce, and so on.
The key to dealing with ratio questions is to find the whole, or the total. Remember, a ratio tells us only about the parts, not the total. In order to find the total, add the numbers in the ratio. A ratio of 2:1 means that there are three total parts. A ratio of 2:5 means that we’re talking about a total of 7 parts. And a ratio of 2:5:7 means there are 14 total parts. Once you have a total you can start to do some fun things with ratios.
For example, let’s say you have a handful of pennies and nickels. If you have 30 total coins and the pennies and nickels are in a 2:1 ratio, how many pennies do you have? The total for our ratio is 3, meaning that out of every 3 coins, there are 2 pennies and 1 nickel. So if there are 30 total coins, there must be 20 pennies and 10 nickels. Notice that  is the same as
  , is the same as 2:1!
When you are working with ratios, there’s an easy way not only to keep track of the numbers in the problem but also to quickly figure out the values in the problem. It’s called a ratio box. Let’s try the same question, but with some different numbers; if you have 24 coins in your pocket and the ratio of pennies to nickels is 2:1, how many pennies and nickels are there? The ratio box for this question is below, with all of the information we’re given already filled in.
Remember that ratios are relationships between numbers, not actual numbers, so the real total is 24; that is, you have 24 actual coins in your pocket. The ratio total (the number you get when you add the number of parts in the ratio) is 3.
The middle row of the table is for the multiplier. How do you get from 3 to 24? You multiply by 8. Remember when we talked about finding equivalent fractions? All we did was multiply the numerator and denominator by the same value. That’s exactly what we’re going to do with ratios. This is what the ratio box looks like now:
Now let’s finish filling in the box by multiplying everything else.
Therefore, of the 24 coins, 16 are pennies and 8 are nickels.
Let’s try a GRE example.
Here’s How to Crack It
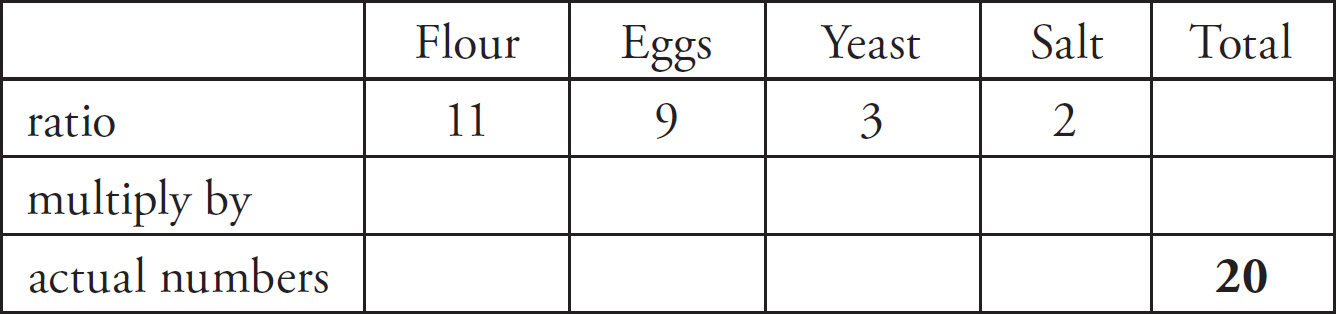
The minute you see the word ratio, draw a ratio box on your scratch paper and fill in what you know.
First, add all of the numbers in the ratio to get the ratio total.
Now, what do we multiply 25 by to get 20?
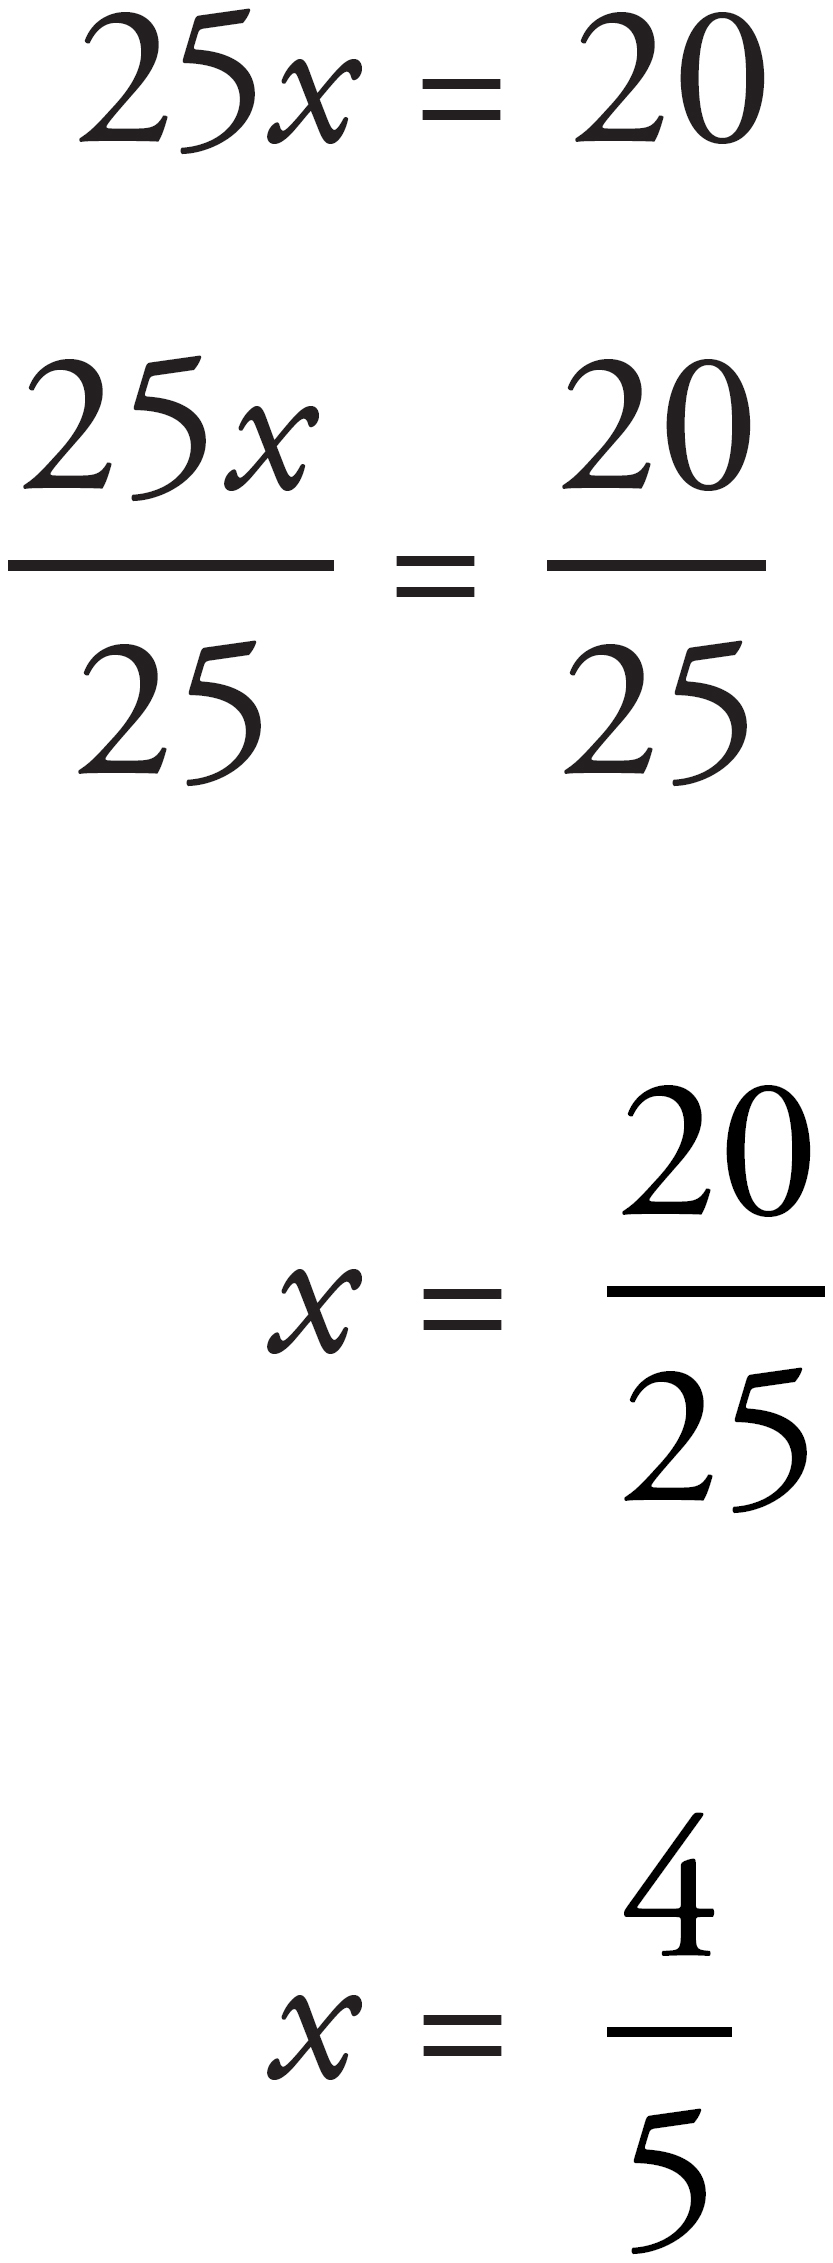
So  is our “multiply by” number. Let’s fill it in.
The question asks for the amount of yeast, so we don’t have to worry about the other ingredients. Just look at the yeast column. All we have to do is multiply 3 by to get the answer:  , which is (D).
So you know that a fraction is a relationship between part and whole, and that a ratio is a relationship between part and part. A proportion is an equivalent relationship between two fractions or ratios. Thus, and  are proportionate because they are equivalent fractions. But and are not in proportion because they are not equal ratios.
The GRE often contains problems in which you are given two proportional, or equal, ratios from which one piece of information is missing. These questions take a relationship or ratio, and project it onto a larger or smaller scale. Proportion problems are recognizable because they always give you three values and ask for a fourth value. Here’s an example:
If the cost of a one-hour telephone call is $7.20, what would be the cost in dollars of a 10-minute telephone call at the same rate?
Here’s How to Crack It
It’s very important to set up proportion problems correctly. That means placing your information on your scratch paper. Be especially careful to label everything. It takes only an extra two or three seconds, but doing this will help you catch lots of errors.
Relationship Review
You may have noticed a trend in the preceding pages. Each of the major topics covered—fractions, percents, ratios, and proportions—described a particular relationship between numbers. Let’s review:
-
A fraction expresses the relationship between a part and the whole.
-
A percent is a special type of fraction, one that expresses the relationship of part to whole as a fraction with the number 100 in the denominator.
-
A ratio expresses the relationship between part and part. Adding the parts of a ratio gives you the whole.
-
A proportion expresses the relationship between equal fractions, percents, or ratios.
-
Each of these relationships shares all the characteristics of a fraction. You can reduce them, expand them, multiply them, and divide them using the exact same rules you used for working with fractions.
For this question, let’s express the ratios as dollars over minutes, because we’re being asked to find the cost of a 10-minute call. That means that we have to convert 1 hour to 60 minutes (otherwise it wouldn’t be a proportion).

Now cross multiply.

Now we can enter 1.20 into the box.
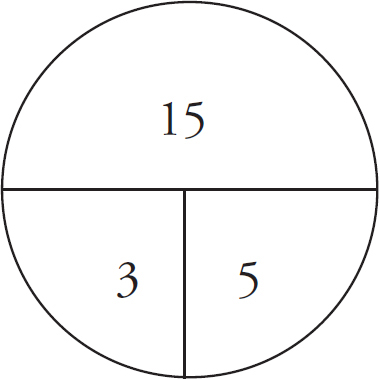
The average (arithmetic mean) of a list of numbers is the sum, or total value, of all the numbers in the list divided by the number of numbers in the list. The average of the list 1, 2, 3, 4, 5 is equal to the total of the numbers (1 + 2 + 3 + 4 + 5, or 15) divided by the number of numbers in the list (which is 5). Dividing 15 by 5 gives us 3, so 3 is the average of the list.
ETS always refers to an average as an “average (arithmetic mean).” This confusing parenthetical remark is meant to keep you from being confused by other more obscure kinds of averages, such as geometric and harmonic means. You’ll be less confused if you simply ignore the parenthetical remark and know that average means total of the elements divided by the number of elements.
Don’t try to solve average problems all at once. Do them piece by piece. The key formula to keep in mind when doing problems that involve averages is
Drawing an Average Pie will help you organize your information.
Here’s how the Average Pie works. The total is the sum of the numbers being averaged. The number of things is the number of different elements that you are averaging. And the average is, naturally, the average.
Say you wanted to find the average of 4, 7, and 13. You would add those numbers to get the total and divide that total by three.

Mathematically, the Average Pie works like this:
The horizontal bar is a division bar. If you divide the total by the number of things, you get the average. If you divide the total by the average, you get the number of things. If you have the number of things and the average, you can simply multiply them together to find the total. This is one of the most important things you need to be able to do to solve GRE average problems.
Using the Average Pie has several benefits. First, it’s an easy way to organize information.
Furthermore, the Average Pie makes it clear that if you have two of the three pieces, you can always find the third. This makes it easier to figure out how to approach the problem. If you fill in the number of things, for example, and the question wants to know the average, the Average Pie shows you that the key to unlocking that problem is finding the total.
Try this one.
The average (arithmetic mean) of seven numbers is 9 and the average of three of these numbers is 5. What is the average of the other four numbers?
 4
4
5
7
10
12
Here’s How to Crack It
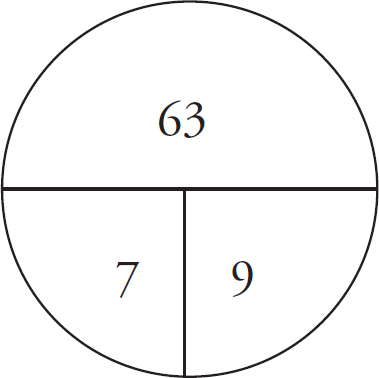
Let’s take the first sentence. You have the word average, so draw an Average Pie and fill in what you know. We have seven numbers with an average of 9, so plug those values into the Average Pie and multiply to find the total.
Now we also know that three of the numbers have an average of 5, so draw another Average Pie, plug those values into their places, and multiply to find the total of those three numbers.
The question is asking for the average of the four remaining numbers. Draw one more Average Pie and Plug In 4 for the number of things.
In order to solve for the average, we need to know the total of those four numbers. How do we find this? From our first Average Pie we know that the total of all seven numbers is 63. The second Average Pie tells us that the total of three of those numbers was 15. Thus, the total of the remaining four has to be 63 – 15, which is 48. Plug 48 into the last Average Pie, and divide by 4 to get the average of the four numbers.
The average is 12, which is (E).
Let’s try one more.
The average (arithmetic mean) of a set of 6 numbers is 28. If a certain number, y, is removed from the set, the average of the remaining numbers in the set is 24.
|
Quantity A
|
Quantity B
|
|
y
|
48
|
Quantity A is greater.
Quantity B is greater.
The two quantities are equal.
The relationship cannot be determined from the information given.
Here’s How to Crack It
All right, let’s attack this one. The problem says that the average of a set of six numbers is 28, so let’s immediately draw an Average Pie and calculate the total.
If a certain number, y, is removed from the set, there are now five numbers left. We already know that the new average is 24, so draw another Average Pie.
The difference between the totals must be equal to y: 168 – 120 = 48. Thus, the two quantities are equal, and the answer is (C).
Averages are very predictable. You should make sure you automatically know what happens to them in certain situations. For example, suppose you take three tests and earn an average score of 90. Now you take a fourth test. What do you know?
If your average goes up as a result of the fourth score, then you know that your fourth score was higher than 90. If your average stays the same as a result of the fourth score, then you know that your fourth score was exactly 90. If your average goes down as a result of the fourth score, then you know that your fourth score was less than 90.
The median is the middle value in a list of numbers; above and below the median lie an equal number of values. For example, in the list of numbers (1, 2, 3, 4, 5, 6, 7), the median is 4, because it’s the middle number (and there are an odd number of numbers in the list). If the list contained an even number of integers such as (1, 2, 3, 4, 5, 6), the median is the average of 3 and 4, or 3.5. When looking for the median, sometimes you have to put the numbers in order yourself. What is the median of the list of numbers (13, 5, 6, 3, 19, 14, 8)? First, put the numbers in order from least to greatest, (3, 5, 6, 8, 13, 14, 19). Then take the middle number. The median is 8. Just think median = middle and always make sure the numbers are in order.
The mode is the number in a list of numbers that occurs most frequently. For example, in the list (2, 3, 4, 5, 3, 8, 6, 9, 3, 9, 3), the mode is 3, because 3 shows up the most. Just think mode = most.
The range is the difference between the greatest and the least numbers in a list of numbers. So, in the list of numbers (2, 6, 13, 3, 15, 4, 9), the range is 15 (the greatest number in the list) – 2 (the least number in the list), or 13.
Here’s an example:
Set F = {4, 2, 7, 11, 8, 9}
|
Quantity A
|
Quantity B
|
|
The range of Set F
|
The median of Set F
|
Quantity A is greater.
Quantity B is greater.
The two quantities are equal.
The relationship cannot be determined from the information given.
Here’s How to Crack It
Let’s put the numbers in order first, so it’ll be easier to see what we have: {2, 4, 7, 8, 9, 11}. First, let’s look at Quantity A. The range is the greatest number, or 11, minus the least number, or 2. That’s 9. Now let’s look at Quantity B. The minute you see the word median, be sure to put the numbers in order. The median is the middle number of the set, but because there are two middle numbers, 7 and 8, we have to find the average. Or do we? Isn’t the average of 7 and 8 clearly going to be smaller than the number in Quantity A, which is 9? Yes, in quant comp questions, we compare, not calculate. The answer is (A).
Standard deviation is one of those phrases that people uncomfortable with math shy away from. In truth, standard deviation is fairly straightforward and with some understanding and a little practice, you can conquer standard deviation on the GRE. The prevalence of standard deviation questions on the GRE is small, and though the GRE might ask you questions about standard deviation, you’ll never have to actually calculate it; instead, you’ll just need a basic understanding of what standard deviation is and how it’s tested on the GRE. Generally, the GRE treats standard deviation as a measure of spread.
The first thing to know is what is meant by standard deviation on the GRE. Standard deviation is a measure of the amount of spread, or variation, of a set of data values. A low standard deviation indicates that the data values tend to be close to the mean (thus, to have little spread), while a high standard deviation indicates that the values are spread out over a wider range. So, the further the distance between the members of a set and the set’s average, the greater the standard deviation of the set.
Consider two sets of numbers, {4, 4, 4} and {3, 4, 5}. The first set, {4, 4, 4}, has a mean value of 4, as  is equal to 4. However, since each member of the set is equal to the mean (and thus to each other member of the set), there is no distance between the members of the set and the mean of the set, so there is no spread amongst the numbers. Now look at the second set, {3, 4, 5}. This set also has a mean of 4, as
  is equal to 4. However, in this group, instead of all numbers being equal to the mean, two members of the set have some distance from the mean (3 and 5 are not equal to the mean of 4). Therefore, since the second set has more spread (the members of the set have more distance from the mean), the second set has a greater standard deviation.
Here’s an example of how ETS might test standard deviation:
|
Quantity A
|
Quantity B
|
|
The standard deviation of a list of data consisting of 10 integers ranging from –20 to –5
|
The standard deviation of a list of data consisting of 10 integers ranging from 5 to 20
|
Quantity A is greater.
Quantity B is greater.
The two quantities are equal.
The relationship cannot be determined from the information given.
Here’s How to Crack It
ETS is hoping you’ll make a couple of wrong turns on this problem. The first trap they set is that one of the list of numbers contains negative integers while the other doesn’t—but this doesn’t mean that one list has a negative standard deviation. Standard deviation is defined as the distance a point is from the mean, so it can never be negative. The second trap is that ETS hopes you’ll waste a lot of time trying to calculate standard deviation based on the information given. But you know better than to try to do that. Remember that ETS won’t ask you to calculate standard deviation; it’s a complex calculation. Plus, as you know, you need to know the mean in order to calculate the standard deviation and there’s no way we can find it based on the information here. Thus, we have no way of comparing these two quantities, so the answer is (D).
Now, let’s try a question that deals with standard deviation differently.
For a certain distribution, the value 12.0 is one standard deviation above the mean and the value 15.0 is three standard deviations above the mean. What is the mean of the data set?
9.0
9.5
10.0
10.5
11.0
Here’s How to Crack It
This one’s a little tougher than the earlier standard deviation questions. The question provides neither the individual data points nor the mean, and ETS is hoping that this will throw you off. But remember that standard deviation deals with the distance from the mean. Start by determining the size of one standard deviation. Since 12.0 is one standard deviation above the mean and 15.0 is three standard deviations above the mean, the difference between the data values represents the difference in the number of standard deviations. Therefore,
15.0 – 12.0 = 3.0 st dev – 1.0 st dev, so 3.0 = 2.0 st dev
Now set up a proportion to find the size of one standard deviation:

Solve to find that x = 1.5, which means that one standard deviation for this data set is equal to 1.5. Since 12.0 is one standard deviation above the mean, the mean of the data set is 12.0 – 1.5 = 10.5, so the answer is (D).
Rate problems are similar to average problems. A rate problem might ask for an average speed, distance, or the length of a trip, or how long a trip (or a job) takes. To solve rate problems, use the Rate Pie.
The Rate Pie works exactly the same way as the Average Pie. If you divide the distance or amount by the rate, you get the time. If you divide the distance or amount by the time, you get the rate. If you multiply the rate by the time, you get the distance or amount.
Let’s take a look.
It takes Carla three hours to drive to her brother’s house at an average speed of 50 miles per hour. If she takes the same route home, but her average speed is 60 miles per hour, what is the time, in hours, that it takes her to drive home?
2 hours
2 hours and 14 minutes
2 hours and 30 minutes
2 hours and 45 minutes
3 hours
Here’s How to Crack It
The trip to her brother’s house takes three hours, and the rate is 50 miles per hour. Plug those numbers into a Rate Pie and multiply to find the distance.
So the distance is 150 miles. On her trip home, Carla travels at a rate of 60 miles per hour. Draw another Rate Pie and Plug In 150 and 60. Then all you have to do is divide 150 by 60 to find the time.
So it takes Carla two and a half hours to get home. That’s (C).
Try another one.
A machine can stamp 20 envelopes in 4 minutes. How many of these machines, working simultaneously, are needed to stamp 60 envelopes per minute?
5
10
12
20
24
Here’s How to Crack It
First, we have to find the rate per minute of one machine. Plug 20 and 4 into a Rate Pie and divide to find the rate.
The rate is 5. If one machine can stamp 5 envelopes per minute, how many machines do you need to stamp 60 per minute? 60 ÷ 5 = 12, or (C).
Every GRE Math section has a few questions that are based on a chart or graph (or on a group of charts or graphs). But don’t worry; the most important thing that chart questions test is your ability to interpret the information provided in the chart. Remember, the information is already there for you! You just need to go find it.
There are usually two or three questions per chart or per set of charts. Chart questions appear on split screens. Be sure to click on the scroll bar and scroll down as far as you can; there may be additional charts underneath the top one, and you want to make sure you’ve seen all of them.
Chart problems mostly recycle the basic arithmetic concepts we’ve already covered: fractions, percentages, and so on. This means you can use the techniques we’ve discussed for each type of question, but there are two additional techniques that are especially important to use when doing chart questions.
Get Your Bearings
Before you start the questions, spend a few seconds looking over the charts.
Work the Questions
-
Read the questions and determine
-
Which chart the question deals with
-
What information you need to find
-
What calculations you need to perform
-
Work the chart(s)
-
Approximate or calculate
Notice that, when working the questions, the final step is to determine whether to approximate or to calculate the answer. While the calculator is available to you, it’s important to remember that the calculator is only a tool and is only as smart as you are. Additionally, you can save yourself precious seconds by knowing the “friendly” percentages and their fractions (from back in Chapter 10) by heart.
Nonetheless, with chart questions it is occasionally easier to estimate percentages and round to whole numbers. This is most effective when the numbers in the answers are far apart and the values in the chart are difficult to work with. By estimating and rounding numbers under these conditions, often you can determine the correct answer based on the proximity of the answer to your estimated values.
Make sure you’ve read everything on the chart carefully before you try the first question.
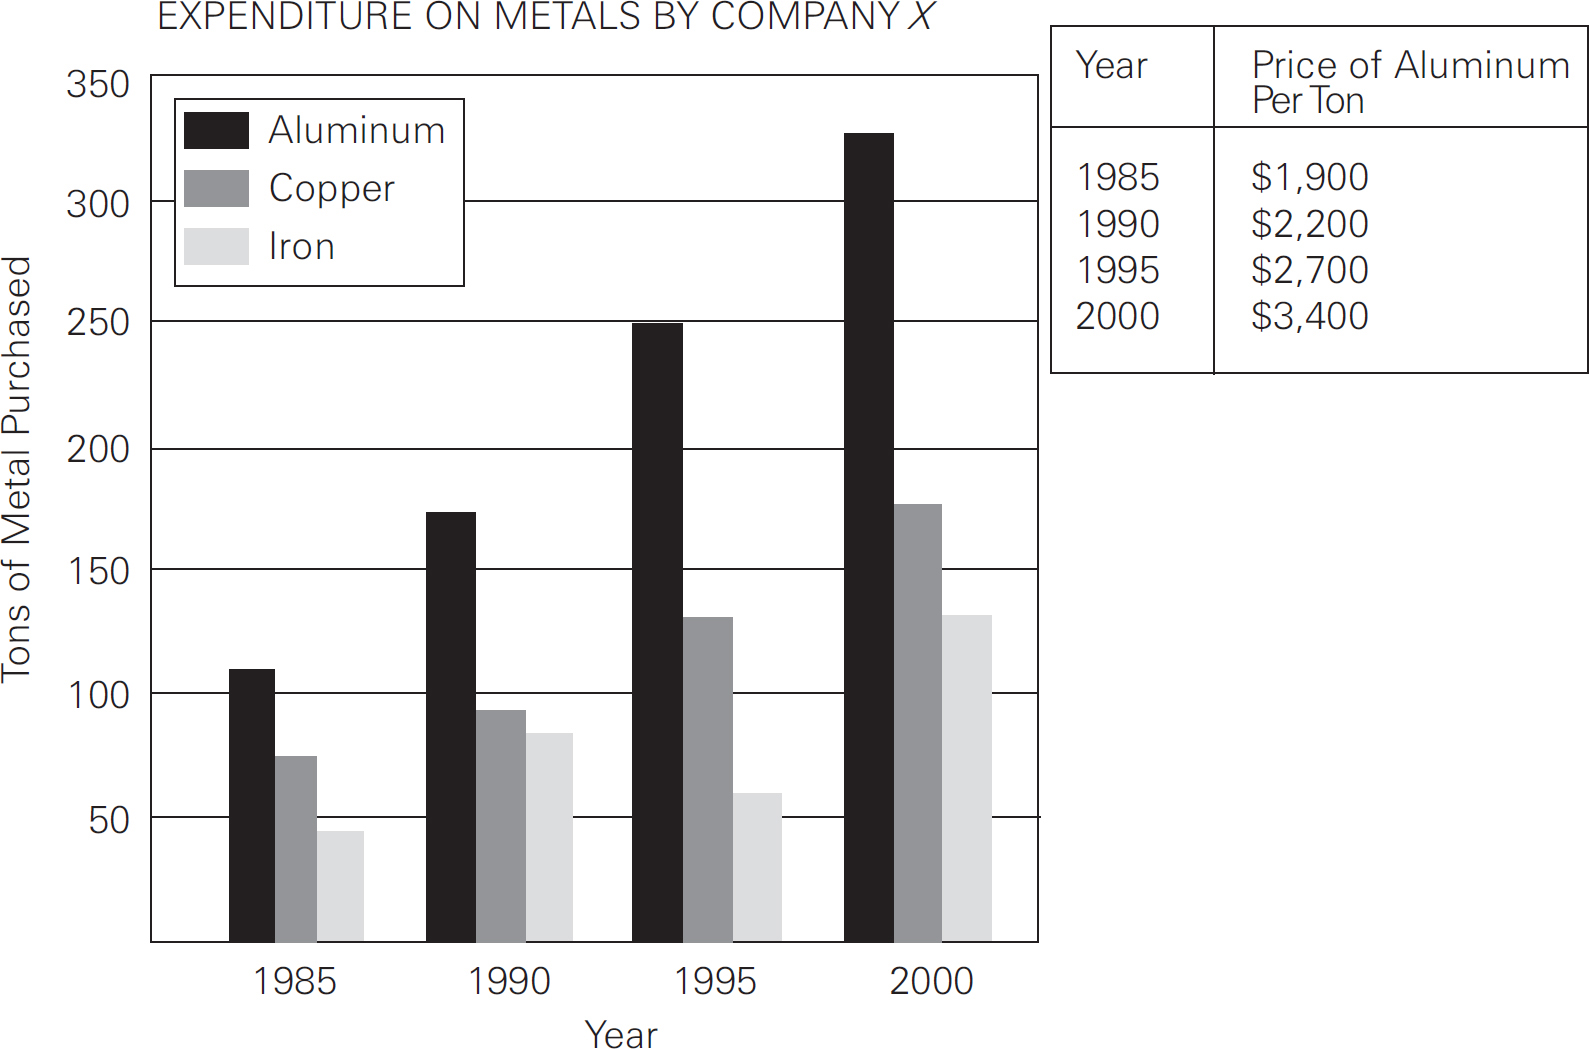
Approximately how many tons of aluminum and copper combined were purchased in 1995 ?
125
255
325
375
515
How much did Company X spend on aluminum in 1990 ?
$675,000
$385,000
$333,000
$165,000
$139,000
Approximately what was the percent increase in the price of aluminum from 1985 to 1995 ?
8%
16%
23%
30%
42%
Here’s How to Crack the First Question
As you can see from the graph on the previous page, in 1995, the black bar (which indicates aluminum) is at 250, and the dark gray bar (which indicates copper) is at approximately 125. Add those figures and you get the number of tons of aluminum and copper combined that were purchased in 1995: 250 + 125 = 375. That’s (D). Notice that the question says “approximately.” Also notice that the numbers in the answer choices are pretty far apart.
Here’s How to Crack the Second Question
We need to use the chart and the graph to answer this question, because we need to find the number of tons of aluminum purchased in 1990 and multiply it by the price per ton of aluminum in 1990 in order to figure out how much was spent on aluminum in 1990. The bar graph tells us that 175 tons of aluminum was purchased in 1990, and the little chart tells us that aluminum was $2,200 per ton in 1990: 175 × $2,200 = $385,000. That’s (B).
Here’s How to Crack the Third Question
Remember that percent increase formula from Chapter 10, Math Fundamentals?
Percent change =  × 100
× 100
We’ll need to use the little chart for this one. In 1985, the price of aluminum was $1,900 per ton. In 1995, the price of aluminum was $2,700 per ton. Now let’s use the formula: 2,700 – 1,900 = 800, so that’s the difference. This is a percent increase problem, so the original number is the smaller one. Thus, the original is 1,900, and our formula looks like this: Percent change =  . By canceling the 0’s in the fraction, you get
  , and multiplying gives you
  . At this point you could divide 800 by 19 to get the exact answer, but because they’re looking for an approximation, let’s round 19 to 20. What’s 800 ÷ 20? That’s 40, and (E) is the only one that’s close.
Click here to download a PDF of Real-World Math Drill.
Now it’s time to try out what you have learned on some practice questions. Try the following problems and then check your answers in Part V.
1 of 12
Sadie sells half the paintings in her collection, gives one-third of her paintings to friends, and keeps the remaining paintings for herself. What fraction of her collection does Sadie keep?
2 of 12
5x – 2y = 2y – 3x
|
Quantity A
|
Quantity B
|
|
x
|
y
|
Quantity A is greater.
Quantity B is greater.
The two quantities are equal.
The relationship cannot be determined from the information given.
Questions 3 through 5 refer to the following graph.
3 of 12
If the six New England states are ranked by population in Year X and Year Y, how many states would have a different ranking from Year X to Year Y ?
None
One
Two
Three
Four
4 of 12
In Year X, the population of Massachusetts was approximately what percent of the population of Vermont?
50%
120%
300%
800%
1,200%
5 of 12
By approximately how much did the population of Rhode Island increase from Year X to Year Y ?
750,000
1,250,000
1,500,000
2,250,000
3,375,000
6 of 12
A water jug with a capacity of 20 gallons is 20 percent full. At the end of every third day, water is added to the jug. If the amount of water added is equal to 50 percent of the water in the jug at the beginning of that day, how many days does it take for the jug to be at least 85% full?
4
6
12
15
20
7 of 12
Towns A, B, C, and D are all in the same voting district. Towns A and B have 3,000 people each who support referendum R and the referendum has an average (arithmetic mean) of 3,500 supporters in towns B and D and an average of 5,000 supporters in Towns A and C.
|
Quantity A
|
Quantity B
|
|
The average number of supporters of Referendum R in Towns C and D
|
The average number of supporters of Referendum R in Towns B and C
|
Quantity A is greater.
Quantity B is greater.
The two quantities are equal.
The relationship cannot be determined from the information given.
8 of 12
A company paid $500,000 in merit raises to employees whose performances were rated A, B, or C. Each employee rated A received twice the amount of the raise that was paid to each employee rated C; and each employee rated B received one-and-a-half times the amount of the raise that was paid to each employee rated C. If 50 workers were rated A, 100 were rated B, and 150 were rated C, how much was the raise paid to each employee rated A ?
$370
$625
$740
$1,250
$2,500
Questions 9 through 11 refer to the following graphs.
9 of 12
In 2013, the median reading test score for ninth-grade students was in which score range?
Below 65 points
65–69 points
70–79 points
80–89 points
90–100 points
10 of 12
If the number of students in grades 9 through 12 in School District X in 1995 comprised 35 percent of the number of students in City Y in 1995, then approximately how many students were in City Y in 1995 ?
9,700
8,700
3,400
3,000
1,200
11 of 12
Assume that all students in School District X took the reading test each year. In 2013, approximately how many more ninth-grade students had reading test scores in the 70–79 point range than in the 80–89 point range?
470
300
240
170
130
12 of 12
One ounce of Solution X contains only ingredients a and b in a ratio of 2 : 3. One ounce of Solution Y contains only ingredients a and b in a ratio of 1 : 2. If Solution Z is created by mixing solutions X and Y in a ratio of 3 : 11, then 630 ounces of Solution Z contains how many ounces of a ?
68
73
89
219
236
-
A ratio expresses a part-to-part relationship. The key to ratio problems is finding the total. Use the ratio box to organize ratio questions.
-
A proportion expresses the relationship between equal fractions, percents, or ratios. A proportion problem always provides you with three pieces of information and asks you for a fourth.
-
Use the Average Pie to organize and crack average problems.
-
The median is the middle number in a set of values. The mode is the value that appears most frequently in a set. The range of a set is the difference between the largest and smallest values in the set.
-
You will never have to calculate standard deviation on the GRE.
-
Standard deviation problems are really average and percent problems. Make sure you know the percentages associated with the bell curve: 34%, 14%, 2%.
-
Use the Rate Pie for rate questions.
-
On chart questions, make sure you take a moment to understand what information the chart is providing. Estimate answers to chart questions whenever possible.