Appendix C
Environmental Scan—Winston-Salem, North Carolina
The Economic Environment
The majority of constituents interviewed or in focus groups during the strategic planning process identified economic development as the single most important issue for the City. “Economic Development” helps to ensure the community will have enough good jobs in the future for its citizens. A healthy economic environment is a prerequisite for a healthy community. For individuals, a healthy economy means “having a good job now and tomorrow, and that my family and friends will also have good jobs.” For the community at large, a healthy economy means a strong tax base and diversified employment (not dependent on one or two businesses or industries). By providing meaningful employment to all citizens, a strong economy also helps to bridge the social gap between ethnic groups.
This section includes:
- Employment, workforce composition, and retail sales growth
- Tax base
- Annexation
- 18-to-34-year-olds
- Economic development efforts
Employment, Workforce Composition, and Retail Sales Growth
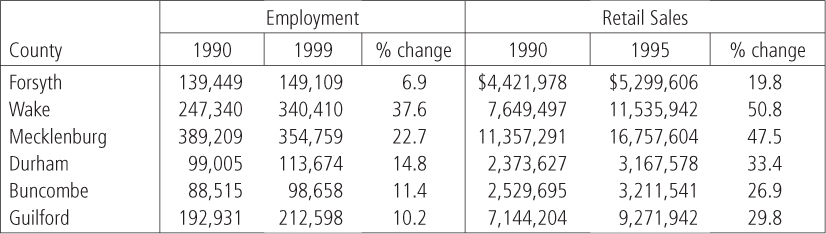
Economic development is an issue to constituents because over the last decade Forsyth County has not kept pace with the rest of North Carolina counties with major metropolitan areas in terms of employment growth and retail sales growth.
RJR, previously the largest employer in the City, has experienced large reductions in workforce. The medical community has experienced the largest increases. Wachovia has recently announced plans to merge with First Union with headquarters in Charlotte. Initial estimates of job reductions of up to 7,000 throughout North and South Carolina would likely impact Winston-Salem disproportionately.
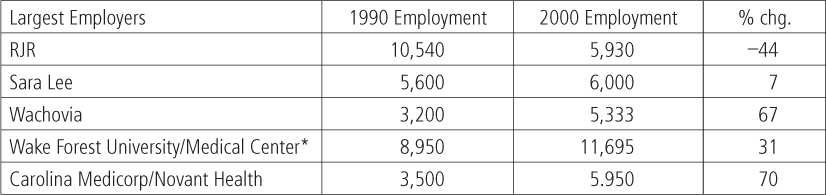
* includes former RJR World Headquarters building
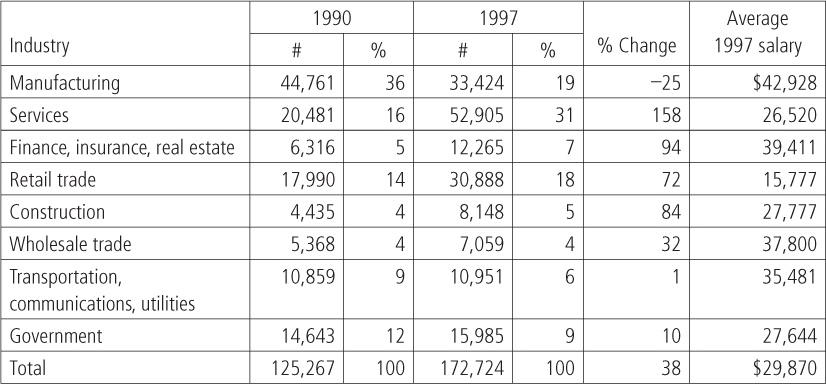
The composition of the workforce has changed away from higher-paying manufacturing jobs to service jobs. This has had a significant impact on revenue for the City. Average salaries are lower for non-manufacturing jobs (1997 manufacturing average = $42,928, total non-manufacturing = $21,714). Had the workforce composition been the same in 1997 as in 1980, total income would have been almost $475,000,000 higher. It is estimated that this additional income would generate almost $800,000 a year in sales tax revenue for the City.
Tax Base
During the 1990s, personal property declined from 29.8% to 21.6% of the tax base, while real property increased as a percent of the tax base. Business personal property makes up a large percentage of personal property and as manufacturing jobs have declined, so has the machinery and equipment used by manufacturers.
| Year | % of Tax Base | |
| Real property | Personal property | |
| 1991 | 67.8 | 29.8 |
| 1993 | 71.6 | 25.6 |
| 1995 | 71.4 | 26.1 |
| 1997 | 72.1 | 25.3 |
| 1999 | 73.7 | 23.8 |
| 2001 | 76.3 | 21.6 |
Corresponding to RJR’s workforce reduction, its property tax liability also has declined.
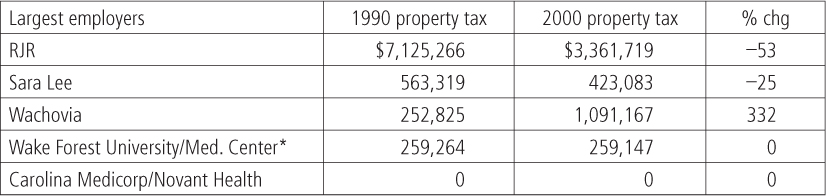
* Includes the former RJR world headquarters.
Two additional tax base trends are worth noting. Many medical doctors’ practices, previously for-profit organizations, have been bought out by nonprofits. As a result, these properties are no longer taxable. Also, the fast growth in the rise in the Hispanic population (discussed in the next section), particularly younger Hispanics, impacts City revenue because employment tends to be in the less-well-paying jobs, household income is lower, and home ownership is less.
Annexation
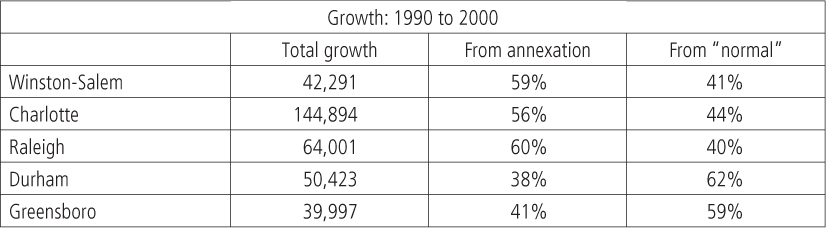
North Carolina’s annexation procedures are among the most favorable to cities. State law allows cities to expand into urbanizing areas in order to ensure that people who benefit from living in an urban environment pay the cost of maintaining the urban environment. While Winston-Salem annexed large areas on its borders in the early 1990s (1991 and 1992) and in 1996, no involuntary annexation has occurred since that time. The annexations of the early and mid-90s increased the City’s population base by about 25,000 people and its land area by over 35 square miles. Annexation accounted for 59 percent of the City’s population growth between 1990 and 2000, with most of the remainder due to the migration of Hispanics to the City. Winston-Salem’s ability to grow physically is becoming more difficult as unincorporated areas of the County are incorporated or annexed into smaller cities. The residents of these areas continue to work in Winston-Salem and make use of its cultural and leisure attractions, yet do not pay City property taxes to fund the services necessary to maintain them.
18-to-34-Year-Olds
During the 1990s Forsyth County had a negative net change of 2,800 18-to-34-year-olds. Forsyth County ranked 95 out of 100 counties in North Carolina in growth of this key age group. Many residents view this drain as a threat to the vitality of the community. Business leaders and others commented during the planning process that lack of 18-to-34-year-olds makes it difficult to find middle-management candidates to fill jobs. In each of the other major urban counties, the 18-to-34-year-old population grew during the 1990s and now makes up a greater proportion of the total population than in Forsyth County.
| 18–34-Year-Olds | ||
| County | Change in population 1990–2000 | % change |
| Wake | 30,791 | 20.60% |
| Mecklenburg | 33,817 | 20.60% |
| Durham | 9,551 | 15.5% |
| Guilford | 5,68 | 5.4% |
| Forsyth | –2,813 | –3.6% |
| Rest of NC | 11,939 | 0.9% |
Economic Development Efforts
Constituents believe it is very important to the community that the economic base grow and diversify. With the number of manufacturing employees declining, new opportunities for employees need to be developed. These opportunities can be with companies new to the area as well as existing companies. One estimate is that as much as 80% of a community’s job growth comes from existing businesses and organizations.
Constituents say that economic development efforts need to be both broad based and neighborhood specific, and need to impact all demographic groups. Some constituents expressed concern that currently most of East Winston is zoned residential, making it difficult to locate businesses in East Winston.
Efforts are under way to improve the city’s economic development base. Examples include:
- The Technology Blueprint of 1997, as well as the Idealliance, which manages the research park and guides technology development.
- The Education/Technology Blueprint that is designed to help the Winston-Salem/Forsyth County schools in applying technology.
- Brownfield redevelopment efforts to revitalize the Liberty Street corridor, including a $25 million business park near the Smith Reynolds airport.
- Downtown revitalization efforts, designed to make Winston-Salem’s downtown a focal point in the Triad, for business as well as entertainment. The downtown revitalization effort has involved a variety of organizations and is turning out to be an example of how City government can collaborate to achieve significant results. With respect to downtown revitalization, some constituents do not think they have enough of an understanding of anticipated results.
- Transportation initiatives such as the improvement of U.S. 52 and the effort to bring passenger rail service to Winston-Salem.
- Winston-Salem Business, Inc., provides business recruitment services to the
- City, with a focus on developing industrial property, particularly the Union Cross Business Park.
- WinstonNet, a project of Wake Forest University and the Chamber of Commerce, seeks to electronically connect government, educational institutions, nonprofits, and others and to help establish Winston-Salem’s reputation as a home for technology industries.
- The City offers economic incentives to attract new businesses as well as to keep growing businesses here.
Economic development projects from 1996 to 2000 had investments from the City of $6.4 million, the County of $1.8 million, and private industry of $187.2 million, resulting in 2,178 new jobs. The current economic incentive program is based on the anticipated revenue for the City that a business is expected to generate over a given period. There is some concern that new technology companies, often requiring fewer personnel and smaller amounts of capital investment, and sometimes requiring a longer payback, may not find the current incentive formula powerful enough to attract or keep them. To support economic development activities, the City appropriated funds for the following activities in the FY 00–01 budget:
| Economic Development Administration | $526,030 |
| Business Development Office | 209,130 |
| Economic Development Loan Fund | 62,000 |
| Economic Development Projects Fund* | 899,130 |
| East Winston Demonstration Projects | 70,000 |
| Total | $1,766,290 |
* The Economic Development Projects fund includes $500,000 for Union Cross Business Park and the remainder is primarily to cover the annual transfer for the Wachovia Parking Deck, which is supported for the most part by property tax revenue from the new Wachovia headquarters building.
Constituents note that if Winston-Salem succeeds in enhancing economic development, a side effect will be that the community’s education system must be able to produce workers who will be qualified to work in tomorrow’s economy. Winston-Salem State University produces more college graduates who live in (and presumably will work in) Winston-Salem than does any other college. Forsyth Technical Community College graduates over 600 students annually.
The Social Environment
This section includes:
- Population growth
- Demographics
- 18-to-34-year-olds
- Social capital
- Education
- Nonprofits
Population Growth
2000 Census information indicates that North Carolina grew 21.4% from 1990 to 2000 (6th in the U.S. in terms of increase). Winston-Salem’s population increased by 29.5% (42,291 people) from 1990 to 2000. Growth was due to two primary factors:
- Annexation in 1991, 1992, and 1996: 25,092 people
- Growth of the Hispanic population: 14,807 people (Some constituents think that the Hispanic population is still understated)
| State and counties | % |
| North Carolina | 21.4 |
| Wake County | 48.3 |
| Mecklenburg County | 36.0 |
| Guilford County | 21.2 |
| Durham County | 22.8 |
| Forsyth County | 15.1 |
| Cities/towns | % |
| Charlotte | 36.6 |
| Durham | 36.9 |
| Raleigh | 32.8 |
| High Point | 23.5 |
| Greensboro | 22.0 |
| Winston-Salem | 29.5 |
| Clemmons | 129.7 |
| Lewisville | 175.3 |
| Kernersville | 58.0 |
U.S. census data indicate that Winston-Salem’s growth was faster than that of High Point and Greensboro, but slower than that of the Triangle and Charlotte. Additionally, smaller communities in Forsyth County that neighbor Winston-Salem (Kernersville, Clemmons, and Lewisville) grew much more rapidly than did Winston-Salem.
In Winston-Salem, percentage growth due to annexation was similar to that of Raleigh and Charlotte. Durham and Greensboro had a higher percentage of “normal” growth (growth that was not due to annexation).
Demographics
The demographic makeup of Winston-Salem has changed in the last decade. African-Americans are the largest minority group in Winston-Salem, making up 37% of the population. Whites make up 56%. Both the African-Americans and Whites grew over 20% during the decade. There has been a significant growth in the Hispanic population.
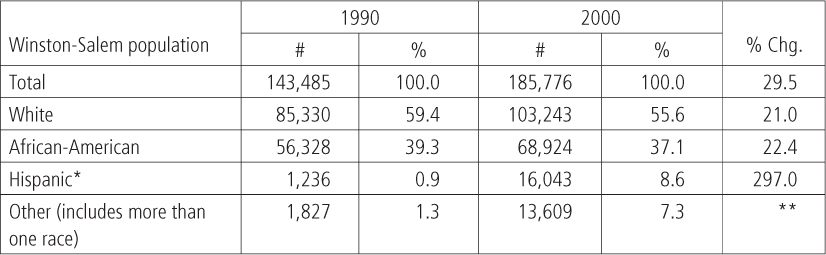
* Hispanic is an ethnicity, not a race. ** Comparisons not valid as data were categorized differently.
African-Americans make up a significant and important segment of Winston-Salem. One of the most important issues to African-American constituents is race relations, which has been an ongoing issue in Winston-Sa1em. Many African-Americans think that while the City cannot solve race relations by itself, it can serve as a model for how organizations should conduct themselves.
During the environmental scan, constituents advised the City to make sure that African-Americans fully participate in the economic development activities of the community. They advised that it will be important to understand what African-American businesses require to succeed, to consider zoning to ensure adequate space exists for business development, to increase incentives to locate in East Winston, and to leverage Community Development Corporations. Additionally, increasing the housing stock of all price ranges in East Winston can increase the number of consumers who will patronize businesses.
A significant change in the community’s population in the last decade has been the increase in the Hispanic population. Most recent U.S. census data indicate that there are nearly 20,000 Hispanics in Forsyth County, the majority of whom (16,043) live within Winston-Salem. The 1990 census reported only 1,236 Hispanic residents in Winston-Salem. The 1999 Neighbors In Ministry/Hispanic Services Coalition Community Plan indicated:
- Forsyth and Mecklenburg Counties have the highest Hispanic growth rates in the state, and North Carolina has one the highest Hispanic growth rates in the United States.
- Close to 30% of all births in Forsyth County are to Hispanic women.
- Close to 40% of adult Hispanics have only a grade school or less education.
- The Hispanic population has a significantly higher number of people/families with lower incomes than the general population.
- Service providers and local government report difficulty in approaching, providing outreach to, involving, and serving Hispanics. Some of the barriers identified are:
–The Hispanic population’s self-imposed isolation and distrust toward the social service and government sectors;
–Differences in language and culture from the mainstream community as well as within the Hispanic population; and
–Lack of sufficient information and understanding by most Hispanics of the resources, opportunities, and terms of coexistence within this community’s life.
Additionally, a report by the local Spanish-language newspaper Que Pasa references research that indicates over 85% of the Hispanic population in North Carolina read and speak only Spanish or have a very strong preference for using Spanish.
18-To-34-Year-Olds
The size and growth of the 18-to-34-year-old population in a community sometimes is considered a prediction of the future for that community. As discussed earlier, Forsyth County lost approximately 2,800 18-to-34-year-olds during the 1990s, and ranked 95 out of 100 in terms of growth of 18-to-34-year-olds. Job opportunities, as well as social environment, both play a role in this trend.
Social Capital
A recently completed study on civic involvement called the Social Capital Community Benchmark Survey, done in conjunction with The Winston-Salem Foundation, showed that Forsyth County ranked high in terms of giving, volunteering, and faith-based engagement, but relatively low on interracial trust and informal socializing. The study suggests that the community needs to improve and invest in social capital because of the positive impacts including less crime, better schools, and more economic development. Interestingly, the study also suggested that there are “serious challenges of building social capital in a large ethnically diverse community. The more diverse a community…the less likely its residents are to trust other people…to connect with other people…, to participate in politics,…[and] to connect across class lines….”
On a national basis the study found “disturbingly unequal access to social capital in most American communities…. For example, African-Americans/Hispanics were less than half as likely to trust other people in their neighborhoods as whites (56% of whites trusted people in their neighborhoods versus 21% for African-Americans and 19% for Hispanics). Forty-six percent of whites had 6 or more close friends versus only 28% of African-Americans and 30% of Hispanics. Sixteen percent of African-Americans and 26% of Hispanics never spoke with their neighbors versus this being the case with only 6% of whites.”
Education
Constituents believe high-quality education is important for both the economic and social viability of the community. Education makes the community more attractive for people to move here and helps to bridge the social divide. The community is fortunate to have as many educational institutions as it has, and they should be leveraged.
Additionally, even though the public schools are a County responsibility, constituents would like the City to “be at the table” on educational issues. For example, this could include continuing to define what job skills will be needed in the future and providing support for the establishment of an engineering/technical school in the community.
Nonprofits
The nonprofit sector in Winston-Salem is a significant contributor to the social fabric of the community. This includes private nonprofits, public nonprofits, educational and medical institutions, arts organizations, faith-based organizations, and foundations. They are all involved in improving the quality of life for the citizens of Winston-Salem. These are critical community assets that need to be included in efforts to achieve the community’s vision. Many constituents believe that City government undervalues the contribution nonprofits make to the community and that, were it not for nonprofits, the City would have to provide more services to disadvantaged citizens.
The Political Environment, Including Governance
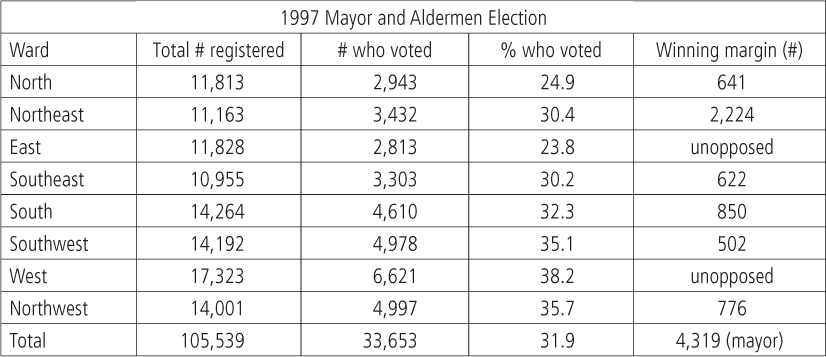
The City is governed by a mayor and eight aldermen. An alderman is elected by each of eight wards. In the 1997 election for the Board of Aldermen, 25% to 38% of voters in each ward voted. Aldermen who won the election generally won with a margin of 500 to 850 voters (excluding candidates who ran unopposed).
The City operates under a Council-Manager form of government, in which the City Manager is responsible for managing the operations of the City. All staff except the City Attorney report to the City Manager. The City Manager and the City Attorney report to the Mayor and Board of Aldermen. The Mayor’s position is compensated part-time. The Mayor votes only in the case of a tie vote.
There are over 30 citizen commissions and committees that advise the Mayor and the Board.
Constituent Input Regarding the Role of City Government
Most constituents interviewed or in focus groups want City government to play broader, higher-level roles in the community. These roles can include identifying strategic issues and stimulating community discussions, setting a community agenda on certain issues (such as housing and race relations), and collaborating with other elected bodies, the business community, and other organizations. Constituents say City government should be one of the leaders, working with others for community progress.
The business community, for example, wants the City to generate enthusiasm about science and technology. But, currently the business community perceives ambivalence on the part of the City’s elected officials regarding economic development. Indeed, there are differences among elected officials regarding the scope of City government’s role.
A large majority of constituents prefers the Council-Manager form of government to a strong Mayor form. The majority also believes that the Mayor’s position should focus on community-wide leadership. During interviews and focus groups, constituents consistently expressed concern about the ward system because they do not think it promotes a community-wide agenda. Several suggested including at-large positions on the Board of Aldermen to promote a community-wide perspective. They did not recommend that the Board be enlarged, but rather that two positions be converted and ward lines redrawn. Staggering the terms for aldermen was also suggested.
Constituents also believe that elected officials should work together more effectively, for the good of the City and community. They say elected officials should focus on the most important issues facing the community, and act as models in terms of cooperation, civility, and respect.
Constituents believe it is important that citizens have positive experiences with City government and feel appreciated for their efforts; for example, when they serve on committees or volunteer boards.
Additionally, constituents believe that the city and county governments should work together, at a minimum to consolidate specific services and address issues of common concern. Some believe that it may be inevitable that the governments would merge over time.
City Government Operations
Tax, Water, and Sewer Rates
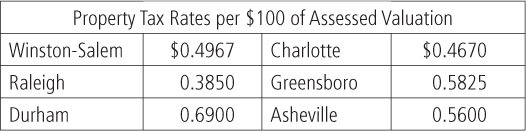
Tax rates compare favorably with other major North Carolina cities:
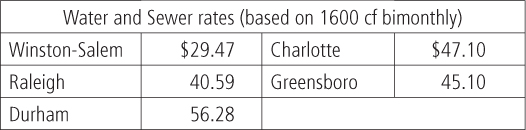
Water and sewer rates for Winston-Salem are significantly below those of other major North Carolina cities:
Budget Analysis and Projections
Recent and Current Budgets—General Government
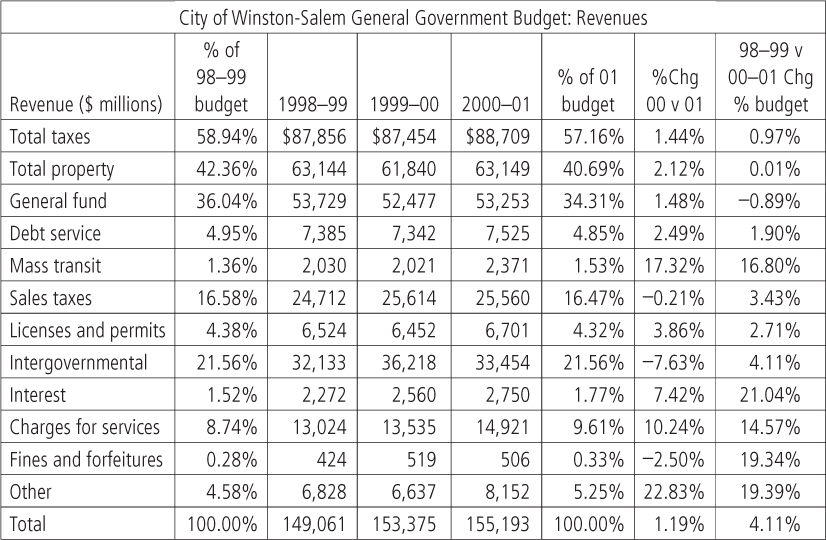
Revenue and expense information in the table below reflect general governmental revenues and expenditures (source 2000–2001 Budget) for fiscal years 1999, 2000, and 2001. Both the general fund and the debt service fund are included. This most accurately reflects government services and revenues. Budget information relating to capital projects and propriety funds (enterprise and internal service funds) and fiduciary funds (such as pensions) is excluded to provide a better picture of general government revenue and expenditure.
The budget increased slightly over 1% in the most recent year, and slightly over 4% in total over the last two years. Revenue from property taxes, the largest source of revenue, remained flat from 1999 to 2001. The rate has decreased by 2.83 cents per $100 of assessed property valuation over the same period (this is equivalent to a 5.4% decrease in the tax rate). At $1,290,000 per 1-cent on the property tax base projection for FY 01–02, the rate reduction has the impact of reducing property tax revenues by $3,650,700 for the upcoming fiscal year.
Sales tax receipts declined slightly in the last year, as did intergovernmental revenue. Charges for services and “other” had the greatest increases in revenue.
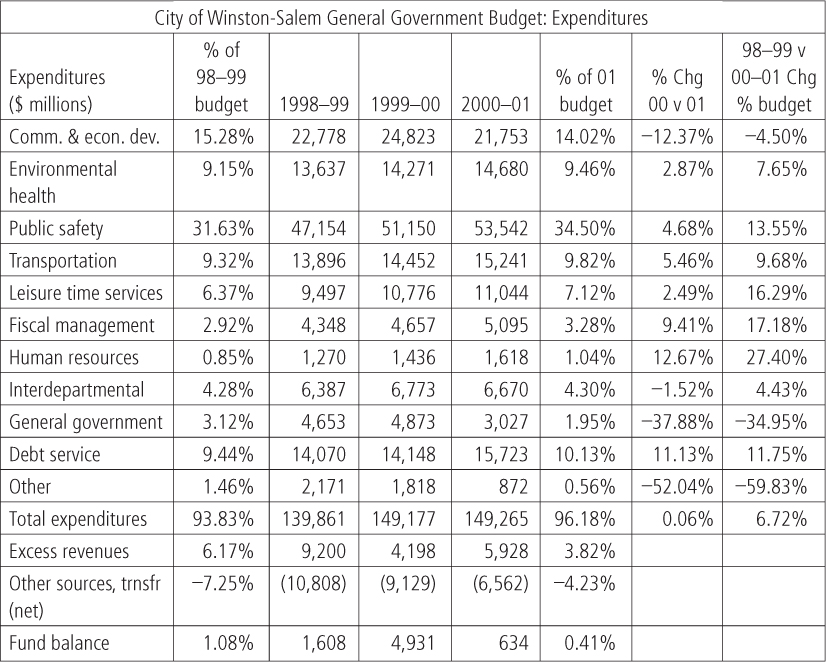
Expenditures for public safety, the largest category of expense, increased by over 13% during the last two years. Community and economic development expenditures, the next largest category of expenditures, have declined during the same period. General government expenses, while a small portion of expenditures, declined by a third in the most recent year.
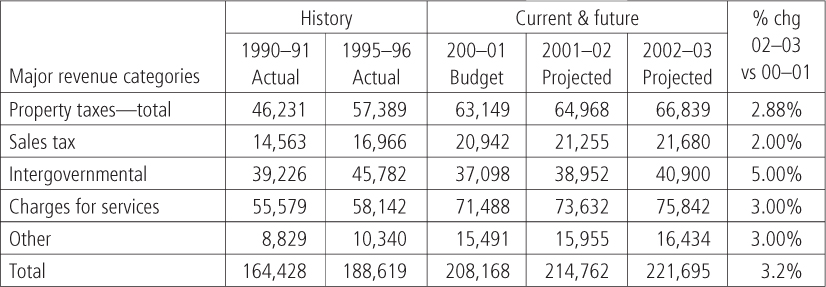
Revenue projections
Projected revenues for City government show an anticipated growth of only 3.2% over the next two years. This is below the expected increases in costs to provide current services in the future. Because City government is required to have a balanced budget, it will be necessary to reduce services or activities, or find appropriate ways to increase revenues. During the focus groups and interviews, constituents expressed concern about the City not having sufficient funds to address needs.
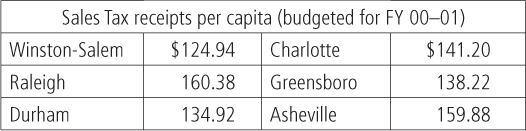
Sales tax receipts
The general fund receives two sales tax allocations, based on several formulas that take into account both sales tax revenue generated by each county and actual population. Sales tax receipts are less for Winston-Salem than for other major cities in North Carolina. It is a source of concern for the Board of Aldermen that the City’s share of the total sales tax receipts coming to the county has dropped from around 34% in FY 90–91 to 30% in FY 00–01. Given the current method of allocation of sales tax receipts, reductions in property tax rates reduce the amount of sales tax receipts for the City.
Budget balancing activities
Because City government is required to have a balanced budget, “normal” cost of living increases (3 1/2 % to 4% for personnel, 70% of the total expenditures) need to be offset by reductions in other areas. For example, the City has implemented an operations review process every year since 1990–1991, yielding annual savings of around $10 million. The City also budgeted $336,860 in general fund savings from the CERC recommendations, in the FY 00–01 budget. Other offsets to the annual “gap” between operating expenses and revenues have included fleet services savings, a drop in the State retirement costs, and the use of excess investment income from RAMCO and Post-Employment Benefits funds for general purposes.
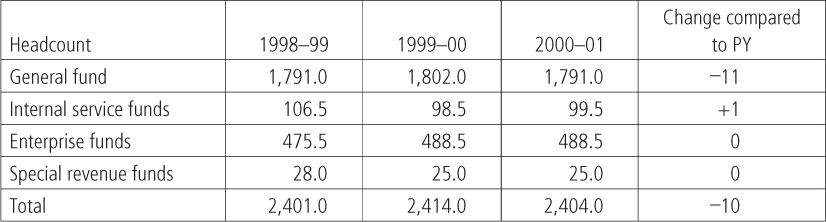
Staffing
In the last three years headcount has decreased by 10 positions overall.
Market Pay Adjustments
For FY 00–01, salary increases were instituted after an analysis indicated salaries were not fully competitive. This had an impact of adding approximately $3.4 million to all funds annually. The portion of the increase that went to the general fund was $2.5 million, which represents a 3% increase over the total general fund personnel base budget for FY 99–00.