APPENDIX D (CHAPTER 21)
In chapter 21, I showed you how to project how long it will take for a person or family to become financially independent. To recap . . .
Step 1: Figure out how much this person or family is spending per year.
Step 2: Calculate their FI target by multiplying that number by twenty-five.
Step 3: Figure out their starting balance and their annual savings (how much money they’re able to save in a year).
Step 4: Create a simple spreadsheet that tracks the growth of their portfolio.
Step 5: Figure out when their portfolio crosses their FI target.
It’s a relatively simple exercise that has become second nature to me, but that’s because I do this so often for my blog. If you’re still wondering how to do it yourself, allow me to show you how, using the magic of Excel.
Yes, you read that right. It’s time to talk about the mind-bending excitement of Excel and Excel formulas. (Now you know why I decided to include this as an appendix rather than in the main chapters.)
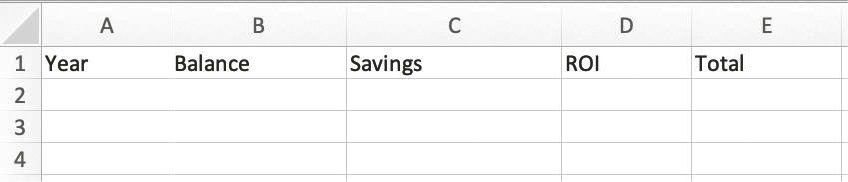
First, open up Excel and create the following column headings.
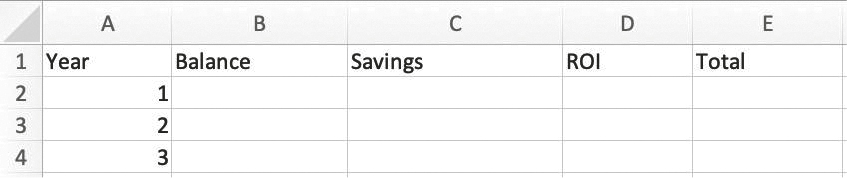
Next, make a counter on the leftmost column for each year. I type 1 into the first row, then use the “Fill Series” feature to fill in the rest. Consult Excel’s Help feature if you’re not sure how to do this.
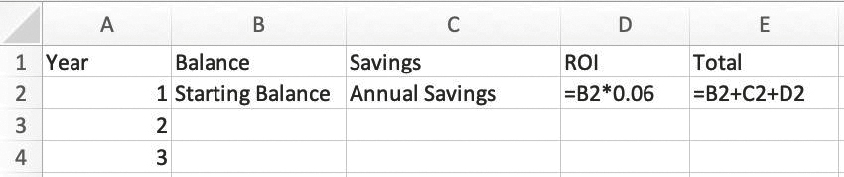
Next, populate the first row. The first “Balance” value should be the total of your investable assets. This includes cash, 401(k)s, and IRA balances, but not your house equity if you own a home. This is because generally, your primary home’s equity can’t be used to help you retire, it just provides a place for you to live. This is why retirement planners often refer to home equity as “dead equity.”
The next cell, “Savings,” is how much you save each year. Again, this includes money that you put into your investment accounts, savings accounts, and retirement accounts, but not your mortgage payments.
The “ROI” (or Return on Investment) column is how much your retirement accounts are growing each year. Make a formula that points back to the “Balance” column and multiply it by your expected ROI. Retirement planners generally use 7 to 8 percent in their projections, but I use 6 percent to be conservative.
Now, create a formula in the “Total” column that adds up all the cells in your row. Your first row should look something like this.
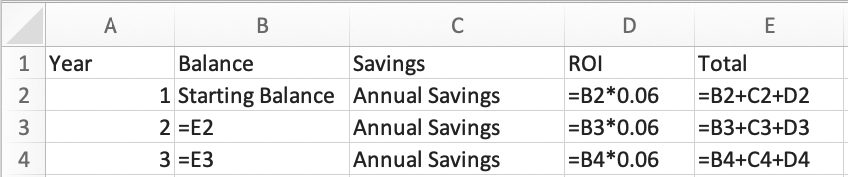
And finally, for each column use Excel’s “Fill Down” feature to copy your formulas down your spreadsheet, like so.
SIMPLE EXAMPLE
Say we have a couple who earns $80,000 after tax. This couple spends $40,000 a year, so that means their FI target is $40,000 × 25 = $1,000,000. This couple is just starting out in their journey, so they have zero assets. How long will it take for them to reach financial independence?
|
Year |
Balance |
Savings |
Return (6%) |
Total |
|
1 |
$0.00 |
$40,000.00 |
$0.00 |
$40,000.00 |
|
2 |
$40,000.00 |
$40,000.00 |
$2,400.00 |
$82,400.00 |
|
3 |
$82,400.00 |
$40,000.00 |
$4,944.00 |
$127,344.00 |
|
4 |
$127,344.00 |
$40,000.00 |
$7,640.64 |
$174,984.64 |
|
5 |
$174,984.64 |
$40,000.00 |
$10,499.08 |
$225,483.72 |
|
6 |
$225,483.72 |
$40,000.00 |
$13,529.02 |
$279,012.74 |
|
7 |
$279,012.74 |
$40,000.00 |
$16,740.76 |
$335,753.50 |
|
8 |
$335,753.50 |
$40,000.00 |
$20,145.21 |
$395,898.71 |
|
9 |
$395,898.71 |
$40,000.00 |
$23,753.92 |
$459,652.63 |
|
10 |
$459,652.63 |
$40,000.00 |
$27,579.16 |
$527,231.79 |
|
11 |
$527,231.79 |
$40,000.00 |
$31,633.91 |
$598,865.70 |
|
12 |
$598,865.70 |
$40,000.00 |
$35,931.94 |
$674,797.64 |
|
13 |
$674,797.64 |
$40,000.00 |
$40,487.86 |
$755,285.50 |
|
14 |
$755,285.50 |
$40,000.00 |
$45,317.13 |
$840,602.63 |
|
15 |
$840,602.63 |
$40,000.00 |
$50,436.16 |
$931,038.79 |
|
16 |
$931,038.79 |
$40,000.00 |
$55,862.33 |
$1,026,901.12 |
After throwing all that info into our spreadsheet, we can see that this couple can retire in seventeen years (or more accurately, at the end of the sixteenth year), since that’s when their “Balance” column crosses their FI target of $1,000,000.
WHAT ABOUT INFLATION?
One question we often get is “What about inflation?” That table doesn’t appear to account for it at all. The key is that the conservative 6 percent ROI I use for stock market returns is after-inflation, or real, growth, as we alluded to in chapter 21, whereas the 7 to 8 percent that retirement planners often use is preinflation, or nominal, growth. That’s the actual growth of the stock market’s value, plus dividends, and it is the most intuitive way of looking at stock market performance. The trouble with using nominal growth is that while it makes the stock market’s performance easier to understand, it makes everything else more complicated because you now have to explicitly account for inflation. Specifically, inflation shows up in my analysis in three places:
-
I have to account for the couple’s salary’s going up with inflation. In other words, they’d be getting yearly cost-of-living raises, and as a result, the amount of money they’d be able to sock away each year would go up with inflation as well.
-
Their portfolios would be growing at the nominal rate rather than the real rate.
-
Your FI target also has to adjust for inflation. After all, even though you’re living on $40,000 now, you’ll need more than that over time since the cost of living is increasing.
So what does that mean for our table? It means we have to add the effects of inflation to the “Savings” and “ROI” columns, as well as add a new column that shows how our FI target changes over time.
|
Year |
Balance |
Savings |
ROI |
Total |
FI Target |
|
1 |
$0.00 |
$40,000.00 |
$0.00 |
$40,000.00 |
$1,000,000.00 |
|
2 |
$40,000.00 |
$40,800.00 |
$3,200.00 |
$84,000.00 |
$1,020,000.00 |
|
3 |
$84,000.00 |
$41,616.00 |
$6,720.00 |
$132,336.00 |
$1,040,400.00 |
|
4 |
$132,336.00 |
$42,448.32 |
$10,586.88 |
$185,371.20 |
$1,061,208.00 |
|
5 |
$185,371.20 |
$43,297.29 |
$14,829.70 |
$243,498.19 |
$1,082,432.16 |
|
6 |
$243,498.19 |
$44,163.24 |
$19,479.86 |
$307,141.29 |
$1,104,080.80 |
|
7 |
$307,141.29 |
$45,046.50 |
$24,571.30 |
$376,759.09 |
$1,126,162.42 |
|
8 |
$376,759.09 |
$45,947.43 |
$30,140.73 |
$452,847.25 |
$1,148,685.67 |
|
9 |
$452,847.25 |
$46,866.38 |
$36,227.78 |
$535,941.41 |
$1,171,659.38 |
|
10 |
$535,941.41 |
$47,803.71 |
$42,875.31 |
$626,620.43 |
$1,195,092.57 |
|
11 |
$626,620.43 |
$48,759.78 |
$50,129.63 |
$725,509.84 |
$1,218,994.42 |
|
12 |
$725,509.84 |
$49,734.98 |
$58,040.79 |
$833,285.61 |
$1,243,374.31 |
|
13 |
$833,285.61 |
$50,729.68 |
$66,662.85 |
$950,678.14 |
$1,268,241.79 |
|
14 |
$950,678.14 |
$51,744.27 |
$76,054.25 |
$1,078,476.66 |
$1,293,606.63 |
|
15 |
$1,078,476.66 |
$52,779.16 |
$86,278.13 |
$1,217,533.95 |
$1,319,478.76 |
|
16 |
$1,217,533.95 |
$53,834.74 |
$97,402.72 |
$1,368,771.41 |
$1,345,868.34 |
The point at which the couple reaches financial independence is no longer when their net worth crosses $1,000,000 but rather when it crosses the constantly moving FI target, which in this case is $1,345,868.34.
See how much more complicated this analysis becomes? And it still comes out to the same answer: seventeen years. That’s why I use a real return rate and do all the math at today’s dollars, rather than trying to show the effect of inflation and do all the math using future dollars. Doing it that way just confuses the hell out of everyone, while ultimately arriving at the same answer.