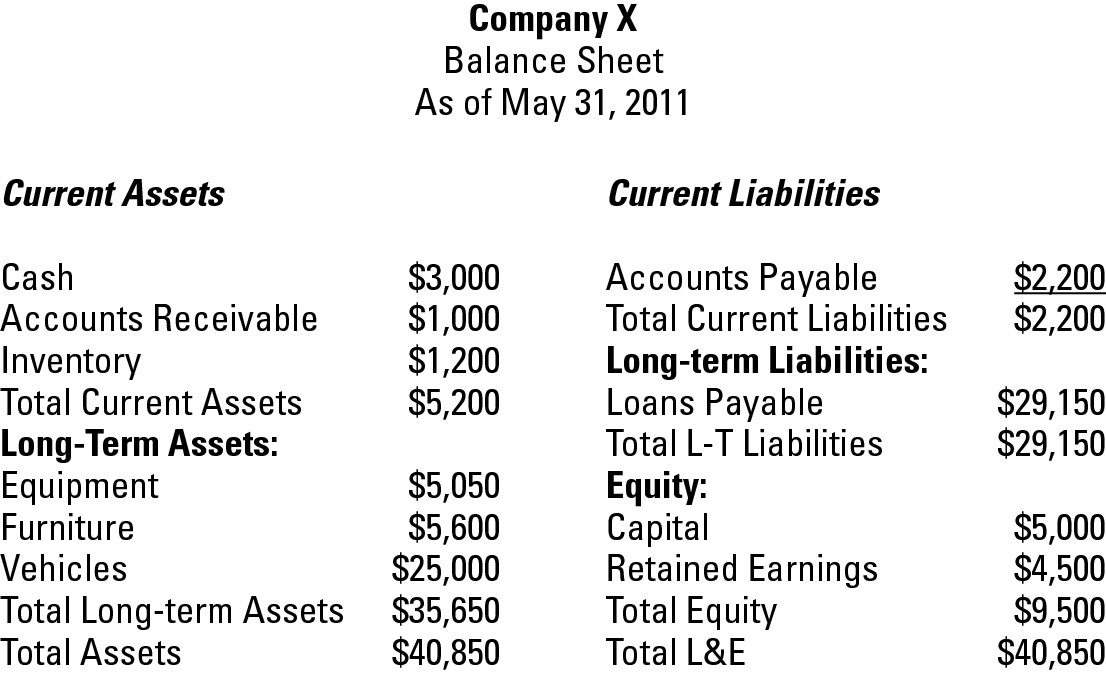
Figure 18-1: A sample Account format balance sheet.
Chapter 18
Developing a Balance Sheet
In This Chapter
 Breaking down the balance sheet
 Pulling together your balance sheet accounts
 Choosing a format
 Drawing conclusions from your balance sheet
 Polishing electronically produced balance sheets
Periodically, you want to know where your business stands. Therefore, at the end of each accounting period, you take a snapshot of your business’s condition. This snapshot, which is called a balance sheet, gives you a picture of how much your business has in assets, how much it owes in liabilities, and how much the owners have invested in the business at a particular point in time.
This chapter explains the key ingredients of a balance sheet and tells you how to pull them all together. You also find out how to use some analytical tools called ratios to see how well your business is doing.
Gathering Balance Sheet Ingredients
You can find most of the information you need to prepare a balance sheet on your trial balance worksheet, the details of which are drawn from your final adjusted trial balance. (I show you how to develop a trial balance in Chapter 16 and how to adjust that trial balance in Chapter 17.)
The company name and ending date for the accounting period being reported appear at the top of the balance sheet. The rest of the report summarizes
 The company’s assets, which include everything the company owns in order to stay in operation
 The company’s debts, which include any outstanding bills and loans that must be paid
 The owners’ equity, which is basically how much the company owners have invested in the business
To keep this example somewhat simple, I assume that the fictitious company has no adjustments for the balance sheet as of May 31, 2011. In the real world, every company needs to adjust something (usually inventory levels at the very least) every month.
To prepare the example trial balances in this chapter, I use the key accounts listed in Table 18-1; these accounts and numbers come from the fictitious company’s trial balance worksheet.
Table 18-1 Balance Sheet Accounts
|
Account Name |
Balance in Account |
|
Cash |
$2,500 |
|
Petty Cash |
$500 |
|
Accounts Receivable |
$1,000 |
|
Inventory |
$1,200 |
|
Equipment |
$5,050 |
|
Vehicles |
$25,000 |
|
Furniture |
$5,600 |
|
Accounts Payable |
$2,200 |
|
Loans Payable |
$29,150 |
|
Capital |
$5,000 |
Dividing and listing your assets
The first part of the balance sheet is the Assets section. The first step in developing this section is dividing your assets into two categories: current assets and long-term assets.
Current assets
Current assets are things your company owns that you can easily convert to cash and expect to use in the next 12 months to pay your bills and your employees. Current assets include cash, Accounts Receivable (money due from customers), marketable securities (including stocks, bonds, and other types of securities), and inventory. (I cover Accounts Receivable in Chapter 9 and inventory in Chapter 8.)
When you see cash as the first line item on a balance sheet, that account includes what you have on hand in the register and what you have in the bank, including checking accounts, savings accounts, money market accounts, and certificates of deposit. In most cases, you simply list all these accounts as one item, Cash, on the balance sheet.
The current assets for the fictional company are
|
Cash |
$2,500 |
|
Petty Cash |
$500 |
|
Accounts Receivable |
$1,000 |
|
Inventory |
$1,200 |
You total the Cash and Petty Cash accounts, giving you $3,000, and list that amount on the balance sheet as a line item called Cash.
Long-term assets
Long-term assets are things your company owns that you expect to have for more than 12 months. Long-term assets include land, buildings, equipment, furniture, vehicles, and anything else that you expect to have for longer than a year.
The long-term assets for this fictional company are
|
Equipment |
$5,050 |
|
Vehicles |
$25,000 |
|
Furniture |
$5,600 |
Most companies have more items in the long-term assets section of a balance sheet than the few long-term assets I show here for the fictional company. For example, a manufacturing company that has a lot of tools, dies, or molds created specifically for its manufacturing processes would have a line item called Tools, Dies, and Molds in the long-term assets section of the balance sheet.
Similarly, if your company owns one or more buildings, you should have a line item labeled Land and Buildings. And if you lease a building with an option to purchase it at some later date, that capitalized lease is considered a long-term asset and listed on the balance sheet as Capitalized Lease.
Some companies lease their business space and then spend lots of money fixing it up. For example, a restaurant may rent a large space and then furnish it according to a desired theme. Money spent on fixing up the space becomes a long-term asset called Leasehold Improvements and is listed on the balance sheet in the long-term assets section.
Everything I’ve mentioned so far in this section — land, buildings, capitalized leases, leasehold improvements, and so on — is a tangible asset. These are items that you can actually touch or hold. Another type of long-term asset is an intangible asset. Intangible assets aren’t physical objects; common examples are patents, copyrights, and trademarks (all of which are granted by the government).
 Patents give companies the right to dominate the markets for patented products. When a patent expires (14 to 20 years, depending on the type of patent), competitors can enter the marketplace for the product that was patented, and the competition helps to lower the price to consumers. For example, pharmaceutical companies patent all their new drugs and therefore are protected as the sole providers of those drugs. When your doctor prescribes a brand-name drug, you’re getting a patented product. Generic drugs are products whose patents have run out, meaning that any pharmaceutical company can produce and sell its own version of the same product.
 Copyrights protect original works, including books, magazines, articles, newspapers, television shows, movies, music, poetry, and plays, from being copied by anyone other than their creators. For example, this book is copyrighted, so no one can make a copy of any of its contents without the permission of the publisher, Wiley.
 Trademarks give companies ownership of distinguishing words, phrases, symbols, or designs. For example, check out this book’s cover to see the registered trademark, For Dummies, for this brand. Trademarks can last forever as long as a company continues to use the trademark and to file the proper paperwork periodically.
Acknowledging your debts
The Liabilities section of the balance sheet comes after the Assets section (see the “Dividing and listing your assets” section) and shows all the money that your business owes to others, including banks, vendors, contractors, financial institutions, or individuals. Like assets, you divide your liabilities into two categories on the balance sheet:
 Current liabilities: All bills and debts you plan to pay within the next 12 months. Accounts appearing in this section include Accounts Payable (bills due to vendors, contractors, and others), Credit Card Payable, and the current portion of a long-term debt (for example, if you have a mortgage on your store, the payments due in the next 12 months appear in the Current Liabilities section).
 Long-term liabilities: All debts you owe to lenders that will be paid over a period longer than 12 months. Mortgages Payable, Loans Payable, and Bonds Payable are common accounts in the long-term liabilities section of the balance sheet.
The fictional company used for the example balance sheets in this chapter has only one account in each liabilities section:
|
Current liabilities: |
|
|
Accounts Payable |
$2,200 |
|
Long-term liabilities: |
|
|
Loans Payable |
$29,150 |
Naming your investments
Every business has investors. Even a small mom and pop grocery store requires money upfront to get the business on its feet. Investments are reflected on the balance sheet as equity. The line items that appear in a balance sheet’s Equity section vary depending upon whether the company is incorporated. (Companies incorporate primarily to minimize their personal legal liabilities; I talk more about incorporation in Chapter 21.)
If you’re preparing the books for a company that isn’t incorporated, the Equity section of your balance sheet should contain these accounts:
 Capital: All money invested by the owners to start up the company as well as any additional contributions made after the start-up phase. If the company has more than one owner, the balance sheet usually has a Capital account for each owner so that their individual stakes in the company can be tracked.
 Drawing: All money taken out of the company by the company’s owners. Balance sheets usually have a Drawing account for each owner in order to track individual withdrawal amounts.
 Retained Earnings: All profits that have been reinvested into the company.
For a company that’s incorporated, the Equity section of the balance sheet should contain the following accounts:
 Stock: Portions of ownership in the company, purchased as investments by company owners
 Retained Earnings: All profits that have been reinvested in the company
Because the fictional company isn’t an incorporated company, the accounts appearing in the Equity Section of its balance sheet are
|
Capital |
$5,000 |
|
Retained Earnings |
$4,500 |
Ta Da! Pulling Together the Final Balance Sheet
After you group together all your accounts (see the section “Gathering Balance Sheet Ingredients”), you’re ready to produce a balance sheet. Companies in the United States usually choose between two common formats for their balance sheets: the Account format or the Report format. The actual line items appearing in both formats are the same; the only difference is the way in which you lay out the information on the page. A third option, the Financial Position format, is more commonly used in Europe, but I explain it in this section in case you ever come across it.
Account format
The Account format is a two-column layout with Assets on one side and Liabilities and Equity on the other side. Figure 18-1 shows a sample Account format balance sheet.
Report format
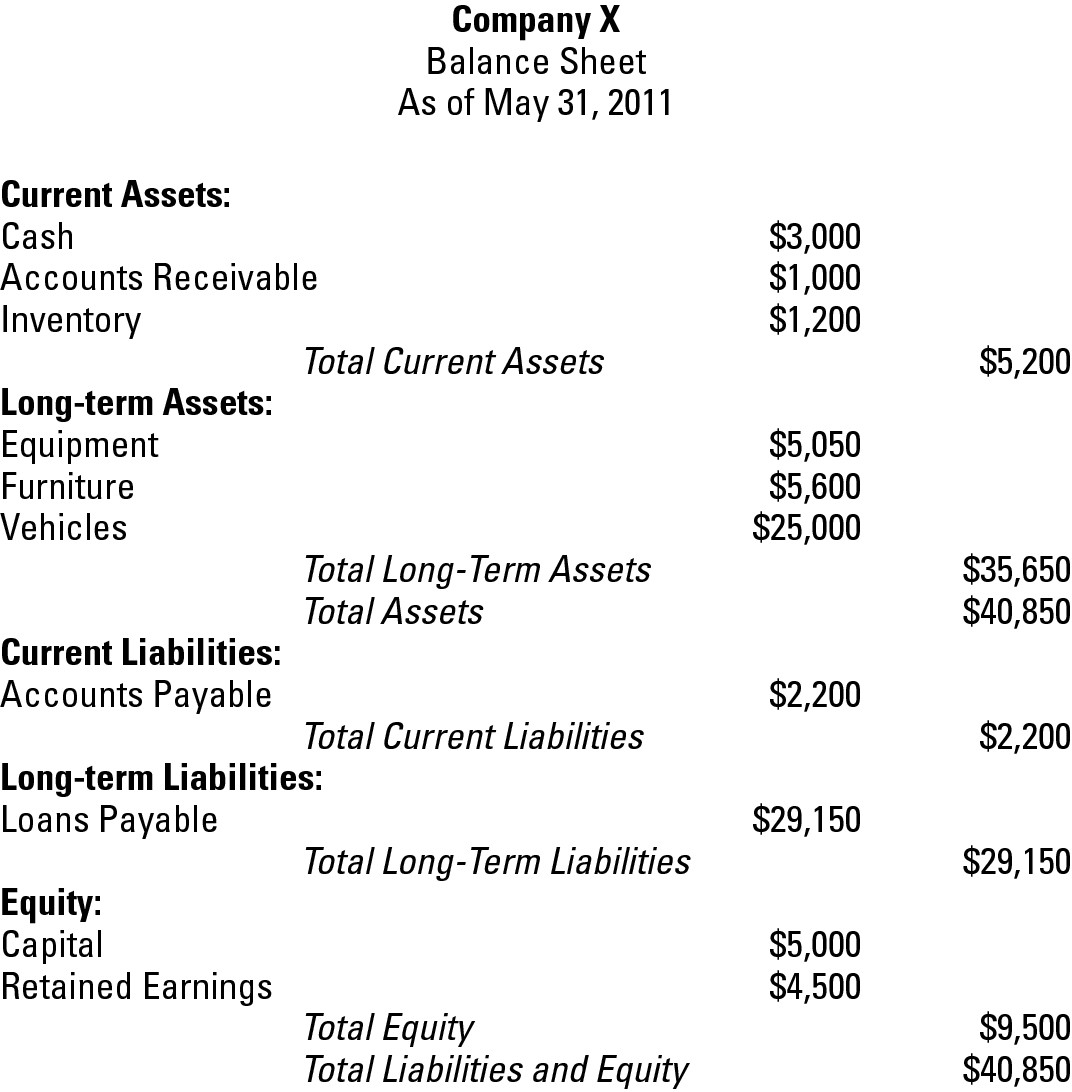
The Report format is a one-column layout showing assets first, then liabilities, and then equity. Figure 18-2 shows the Report format balance sheet for Company X.
Figure 18-2: A sample Report format balance sheet.
Financial Position format
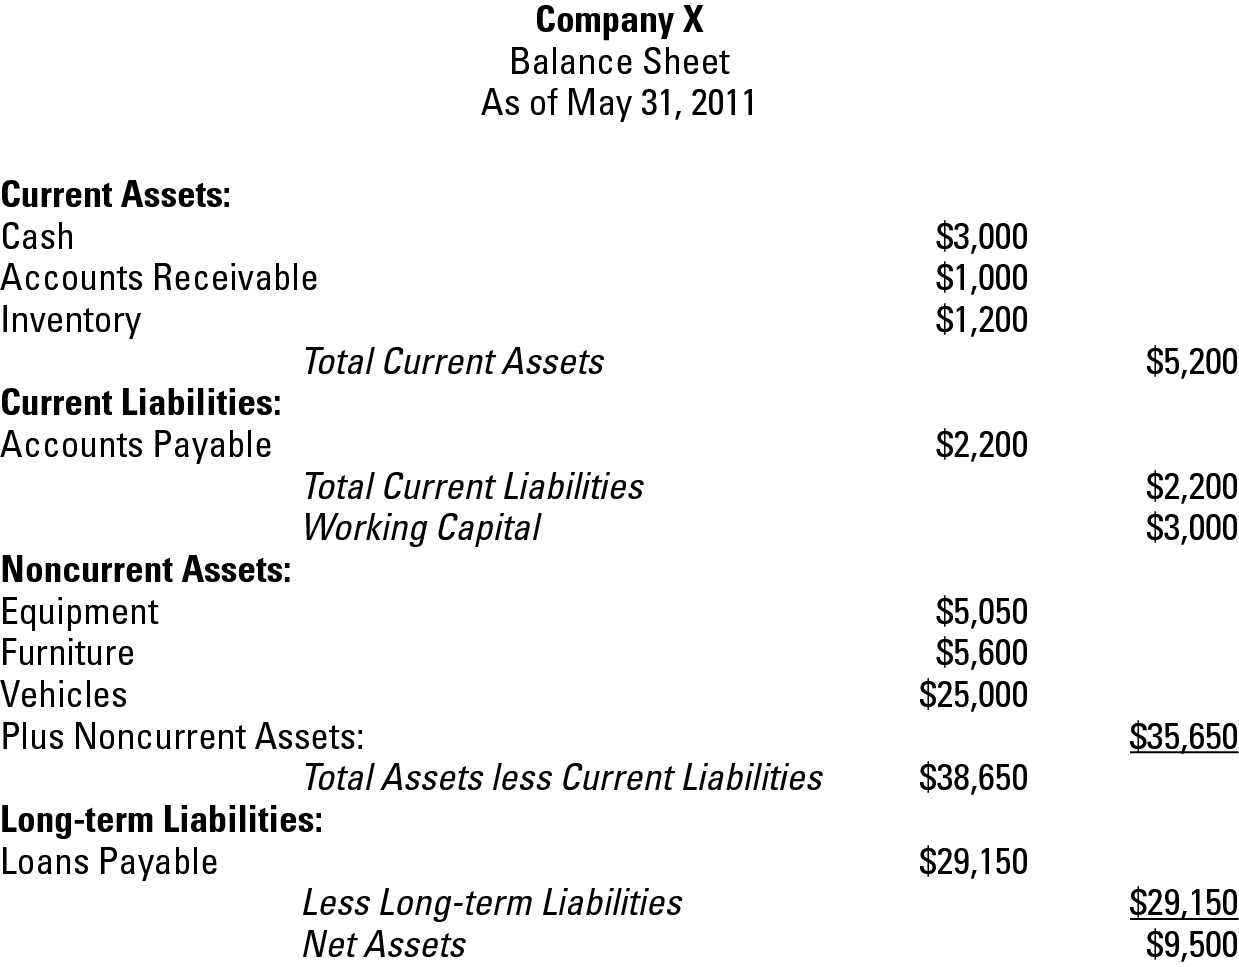
The third type of balance sheet format, the Financial Position format, is rarely seen in the United States but is used commonly in the international markets, especially in Europe. This format doesn’t have an Equity section but includes three line items that don’t appear on the Account or Report formats:
 Working Capital: Calculated by subtracting current assets from current liabilities. It’s a quick test to see whether a company has the money on hand to pay bills.
 Noncurrent Assets: Essentially the same as long-term assets.
 Net Assets: What’s left over for a company’s owners after all liabilities have been subtracted from total assets. (Note that Net Assets is generally the same number as Total Equity in the other two formats.)
Figure 18-3 shows the Financial Position format balance sheet for Company X.
Figure 18-3: A sample Financial Position format balance sheet.
Practice: Formatting Balance Sheets
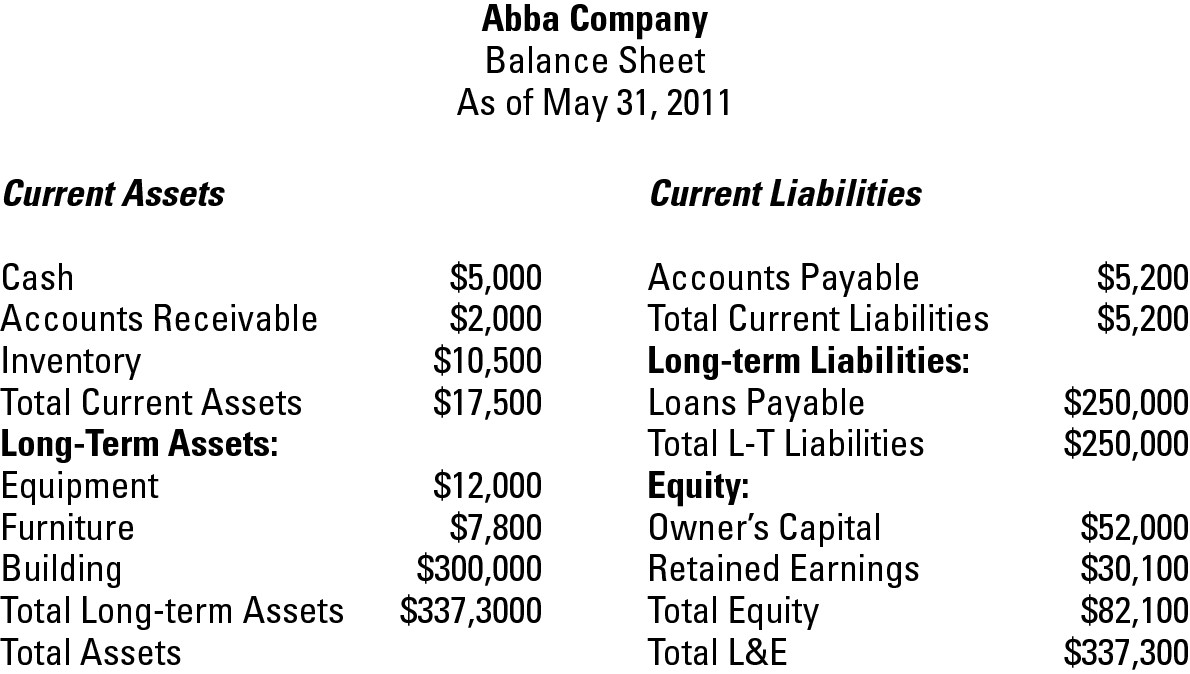
1. To practice preparing a Balance Sheet in the three different types of formats, use this list of accounts to prepare a Balance Sheet for the Abba Company as of the end of May 2011 in the Account format, the Report format, and the Financial Position format:
|
Cash |
$5,000 |
|
Accounts Receivable |
$2,000 |
|
Inventory |
$10,500 |
|
Equipment |
$12,000 |
|
Furniture |
$7,800 |
|
Building |
$300,000 |
|
Accounts Payable |
$5,200 |
|
Loans Payable |
$250,000 |
|
Owners Capital |
$52,000 |
|
Retained Earnings |
$30,100 |
Solve It
Putting Your Balance Sheet to Work
With a complete balance sheet in your hands, you can analyze the numbers through a series of ratio tests to check your cash status and track your debt. Because these are the types of tests financial institutions and potential investors use to determine whether to loan money to or invest in your company, running these tests yourself before seeking loans or investors is a good idea. Ultimately, the ratio tests I cover in this section can help you determine whether your company is in a strong cash position.
Testing your cash
When you approach a bank or other financial institution for a loan, you can expect the lender to use one of two ratios to test your cash flow: the current ratio and the acid test ratio (also known as the quick ratio).
Current ratio
The current ratio compares your current assets to your current liabilities. It provides a quick glimpse of your company’s ability to pay its bills.
The formula for calculating the current ratio is
Current assets ÷ Current liabilities = Current ratio
The following is an example of a current ratio calculation:
$5,200 ÷ $2,200 = 2.36 (current ratio)
Lenders usually look for current ratios of 1.2 to 2, so any financial institution would consider a current ratio of 2.36 a good sign. A current ratio under 1 is considered a danger sign because it indicates that the company doesn’t have enough cash to pay its current bills.
Acid test (quick) ratio
The acid test ratio uses only the financial figures in your company’s Cash account, Accounts Receivable, and Marketable Securities. Although it’s similar to the current ratio in that it examines current assets and liabilities, the acid test ratio is a stricter test of your company’s ability to pay bills. The assets part of this calculation doesn’t take inventory into account because inventory can’t always be converted to cash as quickly as other current assets and because, in a slow market, selling your inventory may take a while.
Calculating the acid test ratio is a two-step process:
1. Determine your quick assets.
Cash + Accounts Receivable + Marketable Securities = Quick assets
2. Calculate your acid test ratio.
Quick assets ÷ Current liabilities = Acid test ratio
The following is an example of an acid test ratio calculation:
$2,000 + $1,000 + $1,000 = $4,000 (quick assets)
$4,000 ÷ $2,200 = 1.8 (acid test ratio)
Lenders consider a company with an acid test ratio around 1 to be in good condition. An acid test ratio of less than 1 indicates that the company may have to sell some of its marketable securities or take on additional debt until it’s able to sell more of its inventory.
Assessing your debt
Before you even consider whether to take on additional debt, you should always check out your debt condition. One common ratio that you can use to assess your company’s debt position is the debt to equity ratio. This ratio compares what your business owes to what your business owns.
Calculating your debt to equity ratio is a two-step process:
1. Calculate your total debt.
Current liabilities + Long-term liabilities = Total debt
2. Calculate your debt to equity ratio.
Total debt ÷ Equity = Debt to equity ratio
The following is an example of a debt to equity ratio calculation:
$2,200 + $29,150 = $31,350 (total debt)
$31,350 ÷ $9,500 = 3.3 (debt to equity ratio)
Lenders like to see a debt to equity ratio close to 1 because it indicates that the amount of debt is equal to the amount of equity. A debt to equity ratio of 3.3 means most banks probably won’t loan the company in this example any more money until either the company lowers its debt levels or the owners put more money into the company.
Practice: Calculating Balance Sheet Ratios
2. Suppose your Balance Sheet shows that your current assets equal $22,000 and your current liabilities equal $52,000. What’s your current ratio? Is that number a good or bad sign to lenders?
Solve It
3. Suppose your Balance Sheet shows that your current assets equal $32,000 and your current liabilities equal $34,000. What is your current ratio? Is that number a good or bad sign to lenders?
Solve It
4. Suppose your Balance Sheet shows that your current assets equal $45,000 and your current liabilities equal $37,000. What is your current ratio? Is that number a good or bad sign to lenders?
Solve It
5. Suppose your Balance Sheet shows that your Cash account equals $5,000, your Accounts Receivable account equals $20,000 and your Marketable Securities account equals $10,000. Your current liabilities equal $52,000. What’s your acid test ratio? Is that number a good or bad sign to lenders?
Solve It
6. Suppose your Balance Sheet shows that your Cash account equals $15,000, your Accounts Receivable account equals $17,000, and your Marketable Securities account equals $8,000. Your current liabilities equal $37,000. What is your acid test ratio? Is that number a good or bad sign to lenders?
Solve It
7. Suppose a business’s current liabilities are $2,200, and its long-term liabilities are $35,000. The owner’s equity in the company totals $12,500. What’s the company’s debt to equity ratio? Is that number a good or bad sign to lenders?
Solve It
8. Suppose a business’s current liabilities are $5,700, and its long-term liabilities are $35,000. The owner’s equity in the company totals $42,000. What’s the company’s debt to equity ratio? Is that number a good or bad sign?
Solve It
9. Suppose a business’s current liabilities are $6,500, and its long-term liabilities are $150,000. The owner’s equity in the company totals $175,000. What’s the company’s debt to equity ratio? Is that number a good or bad sign?
Solve It
Generating Balance Sheets Electronically
If you use a computerized accounting system, you can take advantage of its report function to automatically generate your balance sheets. These balance sheets give you quick snapshots of the company’s financial position but may require adjustments before you prepare your financial reports for external use.
One key adjustment you’re likely to make involves the value of your inventory. Most computerized accounting systems use the averaging method to value inventory. This method totals all the inventory purchased and then calculates an average price for the inventory (see Chapter 8 for more information on inventory valuation). However, your accountant may recommend a different valuation method that works better for your business. I discuss the options in Chapter 8. Therefore, if you use a method other than the default averaging method to value your inventory, you need to adjust the inventory value that appears on the balance sheet generated from your computerized accounting system.
Answers to Developing a Balance Sheet
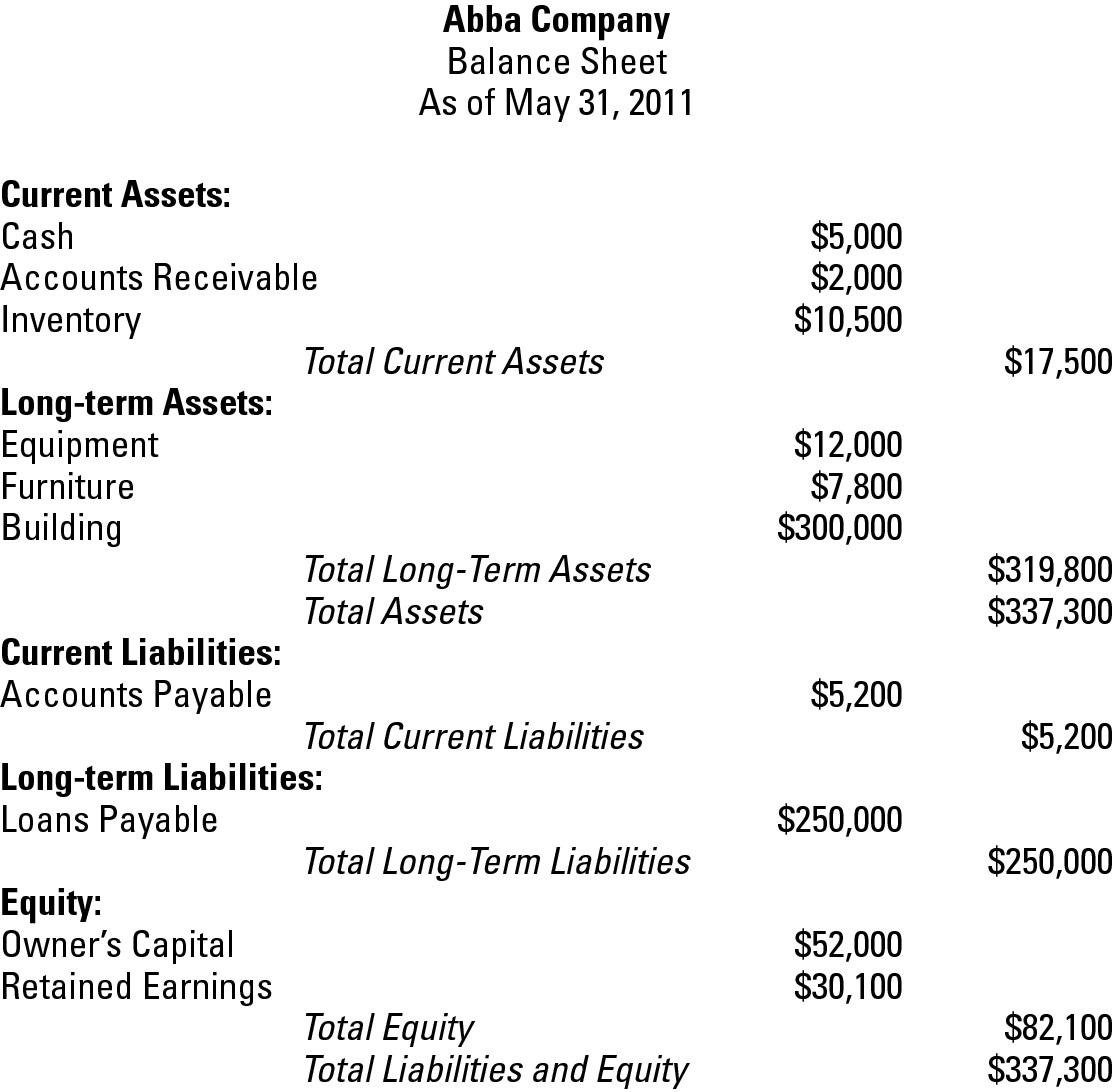
1 Here is what the Account format looks like:
Here is what the Report format looks like:
Here is what the Financial Position format looks like:
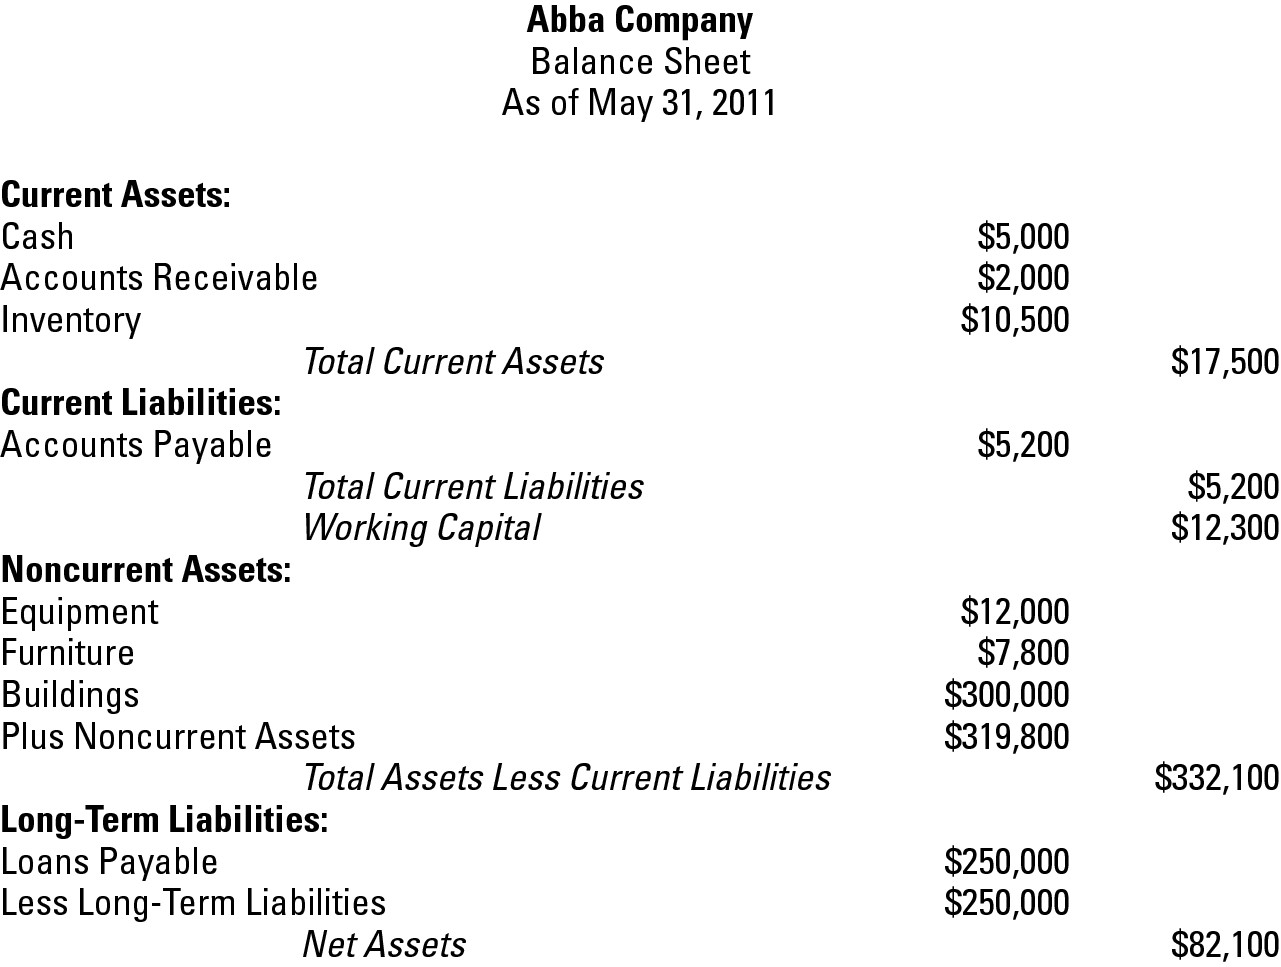
2 Here’s the current ratio calculation:
$22,000 ÷ $52,000 = .42
This ratio is considerably below 1.2, so lenders would consider it a very bad sign. A ratio this low indicates that a company may have trouble paying its bills because its current liabilities are considerably higher than the money it has on hand in current assets.
3 Here’s the current ratio calculation:
$32,000 ÷ $34,000 = .94
The current ratio is slightly below the preferred minimum of 1.2, which lenders would consider a bad sign. A financial institution may loan money to this company but consider it a higher risk; a company with this current ratio would pay higher interest rates than one in the 1.2 to 2 current ratio preferred range.
4 Here’s the current ratio calculation:
$45,000 ÷ $37,000 = 1.22
The current ratio is at 1.22, so lenders would consider it a good sign, and the company probably wouldn’t have difficulty borrowing money.
5 First, you calculate your quick assets:
$5,000 + $20,000 + $10,000 = $35,000
Then, you calculate your acid test ratio:
$35,000 ÷ $52,000 = .67
Lenders would consider this acid test ratio of less than 1 a bad sign. A company with this ratio would have a difficult time getting loans from a financial institution.
6 First, you calculate your quick assets:
$15,000 + $17,000 + $8,000 = $40,000
Then, you calculate your acid test ratio:
$40,000 ÷ $37,000 = 1.08
Lenders would consider this acid test ratio of over 1 a good sign. A company with this ratio would probably be able to get loans from a financial institution without difficulty.
7 First, you calculate your total debt:
$2,200 + $35,000 = $37,200
Then, you calculate your debt to equity ratio:
$37,200 ÷ $12,500 = 2.98
Lenders would consider this debt to equity ratio of over 1 a bad sign. A company with this ratio would probably not be able to get loans from a financial institution until the owners put more money into the business from other sources, such as family and friends or a private investor.
8 First, you calculate your total debt:
$5,700 + $35,000 = $40,700
Then, you calculate your debt to equity ratio:
$40,700 ÷ $42,000 = .97
Lenders would consider this debt to equity ratio near 1 a good sign. A company with this ratio would probably be able to get loans from a financial institution, but if the company is applying for a large unsecured loan, the institution may require additional funds from the owner or investors as well. A loan secured with assets, such as a mortgage, wouldn’t be a problem.
9 First, you calculate your total debt:
$6,500 + $150,000 = $156,500
Then, you calculate your debt to equity ratio:
$156,500 ÷ $175,000 = .89
Lenders would consider this debt to equity ratio of less than 1 a good sign. A company with this ratio would probably be able to get loans from a financial institution without any problems.
 Assets, liabilities, and equity probably sound familiar — they’re the key elements that show whether your books are in balance. If your liabilities plus equity equal assets, your books are in balance. All your bookkeeping efforts are an attempt to keep the books in balance based on this formula, which I talk more about in Chapter 2.
 Most businesses try to minimize their current liabilities because the interest rates on short-term loans, such as credit cards, are usually much higher than those on loans with longer terms. As you manage your company’s liabilities, you should always look for ways to minimize your interest payments by seeking longer term loans with lower interest rates than you can get on a credit card or short-term loan.
 A current ratio over 2.0 may indicate that your company isn’t investing its assets well and may be able to make better use of its current assets. For example, if your company is holding a lot of cash, you may want to invest that money in some long-term assets, such as additional equipment, that you need to help grow the business.