I sometimes think that speculation must be an unnatural sort of business, because I find that the average speculator has arrayed against him his own nature.
—Jesse Livermore, How to Trade in Stocks1
People began lining up in the rain hours before Target’s Buffalo store opened for business on Black Friday 2010. At 4:00 A.M., manager Ben Gregory unlocked the doors, and a torrent of shoppers poured in. Keith Krantz, who had been waiting eight hours for a chance to buy a sale-priced flat-screen TV, was pinned against the metal door frame in the surge, then shoved to the ground. He screamed in pain as shoppers stepped over, around, and on him in their frenzy to snatch up bargains. Keith thought at that moment he might die. He told an interviewer at the hospital, “I was thinking I don’t want to die here on the ground. That’s exactly what I thought.” Keith was lucky. Exactly two years earlier, 34-year-old WalMart employee Jdimytai Damour was trampled to death by shoppers when the doors of the Valley Stream store in Long Island opened on Black Friday.
While the behavior of bargain hunters is at times deplorable, the attractiveness of a bargain is self-evident. We all understand immediately what drives bargain hunting. The impulse is built in, an integral part of a larger scheme of dispositions which shapes our everyday behavior. So powerful is this fragment of our own nature that most of us carry the habit into our trading.
If a man is offered a fact which goes against his instincts, he will scrutinize it closely, and unless the evidence is overwhelming, he will refuse to believe it. If, on the other hand, he is offered something which affords a reason for acting in accordance to his instincts, he will accept it even on the slightest evidence.
—Bertrand Russell2
We are by nature contrarian, so it is only natural to seek support in narratives that accord with our instinctive sense of how things work. Most new traders assume that profits are won by first detecting bargains overlooked by others and then selling once the real value of the asset is broadly realized. Even practiced contrarian traders fancy that they lean against the crowd, against the majority. But do they? As William Eckhardt observes in Jack D. Schwager’s New Market Wizards, “if you bring normal human habits and tendencies to trading, you’ll gravitate toward the majority.” If Eckhardt is right, then contrarians make up the majority of traders. Eckhardt adds, “In the long run, the majority loses.”3
If so, there is something heroic in contrarians’ stand against the odds. Perhaps for that reason, contrarian victories, when they come, are that much sweeter and make for memorable stories. When asked about their best experiences by the authors of Traders, most interviewees spoke of making a great deal of money or of taking a large position.
However, several responded to this open-ended question by talking in explicitly contrarian terms; the best trade was seen as the one which proved their theory right in the face of arguments to the contrary, irrespective of profitability.4
Trades of any stripe may prove profitable, and some who choose contrarian trade-entry methods have done extremely well, including Warren Buffet, David Dreman,5 John Neff,6 and Jim Rogers. These traders are not just among the contrarian majority but also among a minority of successful traders. Successful contrarians tend to be value investors who invest over the long term, a strategy supported by academic investigation.7 In this chapter, we will examine the dynamics of contrarian trading, including opportunities as well as threats present during contrarian-dominated episodes.
Both the stock and group universes we’ve examined so far include selections from a diversified list of industries. But what happens to feedback dynamics when a universe is not diversified? In the next study, 151 bank stocks make up a single-industry universe for analysis.8 Figure 7.1 sums the average daily changes of those bank stocks from February 1997 through early June 2011.
FIGURE 7.1 Bank Stock Average (Log Scale)
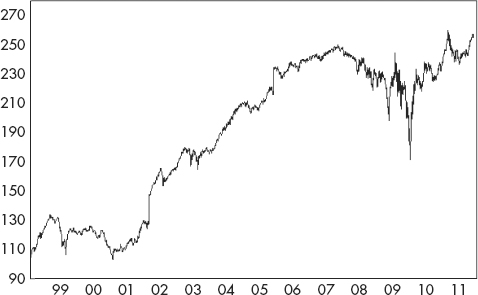
Figure 7.2 shows the running sum of forward changes in the strongest and weakest 10 percent of the bank stock universe. Note that the forward performance of relative strength (RS) leaders trends lower while that of RS laggards advances.
FIGURE 7.2 Forward Performance of Bank Stock Leaders and Laggards

As a consequence of the negative divergence of bank stock leaders and laggards, the performance spread between the top and bottom 10 percent of the universe declines steadily and confirms a dynamic of chronic negative feedback (see Figure 7.3).
FIGURE 7.3 Bank Stock Performance Spread
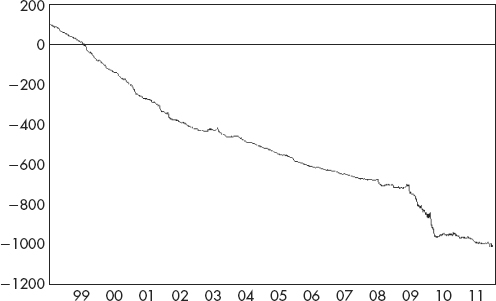
Because exogenous economic factors that affect one bank usually affect all banks to some degree, traders naturally expect stocks within the group to move together. So when one stock trades out of line with others, traders note the anomaly and respond in a way that repairs the discrepancy. The performance spread constantly declines because negative-feedback traders persist in turning outliers near both perimeters of the universe back toward the benchmark equivalence line (BEL). Stocks that are significantly stronger than the group average are viewed as overpriced and are offered, while laggards receive a bid. In effect, traders act like sheep dogs, chasing stocks that stray too far afield back into the fold. Generalizing, any universe of thematically related stocks tends to huddle like a herd of sheep under the watchful eyes of contrarian shepherds. It follows that a universe of stocks is likely to exhibit a rising spread only if selections are thematically diversified.
Since bank stock leaders and laggards are negatively correlated, does a hedged trade, short of leaders and long of laggards, generate sustained profits? Notional long profits from the laggard 10 percent of bank stocks averaged an impressive 0.22 percent daily, twice the 0.11 percent daily profit from shorts in the strongest bank stocks. Skewed results favoring laggard longs are consistent with the bullish trend of the average bank stock over most of the period.
Hedged strategies utilizing the top and bottom 5, 10, and 20 percent of the bank stock universe all showed profits before any allowance for trading costs. Average daily change and portfolio turnover for each are shown below (Table 7.1).9
TABLE 7.1 Results of Hedged Strategies
| Series | Average Daily Change | Average Daily Turnover |
| 5% Leaders | −.11% | 50% |
| 5% Laggards | +.23% | 70% |
| 10% Leaders | −.11% | 41% |
| 10% Laggards | +.22% | 42% |
| 20% Leaders | −.09% | 31% |
| 20% Laggards | +.18% | 32% |
Portfolio turnover in each category is high. Weak stocks that rally well quickly lose their laggard status and are replaced by other stocks that qualify as laggard, while shorts in the strongest stocks are exited once those stocks fall from leadership. Because leaders and laggards change rapidly under negative feedback, to execute the proposed contrarian hedge, multiple trades must be made as often as daily.10 Costs of execution, including commissions and slippage, would likely erode posted results considerably. However, the persistence of negative feedback is prima facie evidence that artful contrarians have found a way to profit from the trade. More generally, if contrarians could not find profitable opportunities, there would be few contrarians, and without contrarians, the dialectic that sustains the market would collapse.
It is always the same. At some point during a momentum-driven decline, a switch flips in the collective mind of traders. They become skeptical enough of the extended move that they turn contrarian and fade the trend. Contrarian traders are net buyers at such times because there are oversold bargains at hand, but they are not bullish. They have little confidence that rallies will be sustained, and they are prepared to take profits on a rebound.
The territory around bear market lows is prime hunting ground for contrarians seeking bargains. The weakest, most oversold stocks then receive the strongest bids and, as a result, recover faster than stocks that held up relatively well during the preceding decline. This contrarian phenomenon is reliable enough to be counted upon. The initial phase of a bull market always begins as a correction, driven by negative feedback and signaled by a falling performance spread.
The historically strongest stocks are not likely to be the best selections near the bottom of a bear market. . . . The continuation of relative strength concept produces superior results during all periods except those immediately succeeding a comparatively weak market.
—Robert A. Levy11
Since, in our lexicon, a bear market is a momentum-driven decline, we may recast Levy’s formulation more positively:
The historically weakest stocks are likely to be the best (long) selections after a momentum-driven decline.
Just as an archer generates and stores energy by drawing a bow, positive feedback during a bear market pulls leaders and laggards apart, generating and storing energy as structural difference. The ensuing corrective rally is propelled by the energy released when RS differences collapse.
Toward the end of a bear market rally, the RS gap between leaders and laggards has narrowed. Energy stored during the previous decline has been spent, and contrarian bids fall off. The initial, corrective phase is over, and the market is now at a tipping point. Just when a bear market rally appears close to exhaustion, the switch in traders’ heads may unaccountably flip again, this time the other way. No longer skeptical and risk averse, they exhibit new confidence in the immediate direction of price. Instead of hunting for bargains among laggard issues, they turn the focus of their buying to groups and stocks leading the rally higher. Not all bear market corrections morph into bull markets, but when they do, a rising spread signals the transition from contrarian rebound to a new, momentum-driven phase.
In the examples of bear market corrections offered below, the forward performance of RS leaders and laggards, as well as the performance spread, are shown. In each case, the performance spread falls during the initial phase of recovery as RS laggards outpace RS leaders to the upside.
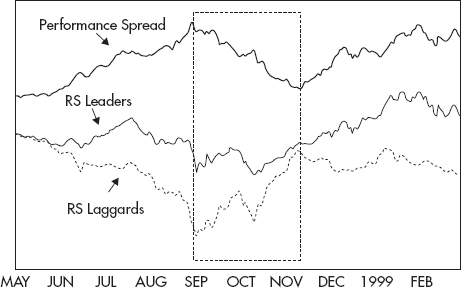
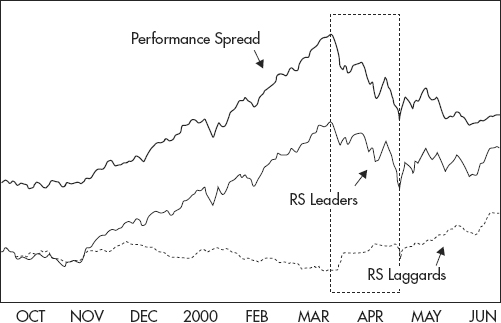
In the spring of 1998, a momentum-driven decline began which cut 50 percent from the price of laggard groups by that fall (Figure 7.4). The first, contrarian phase of the rally began in September but lasted just two months, after which a rising performance spread announced resumption of the secular bull market.
FIGURE 7.4 May 1998—February 1999
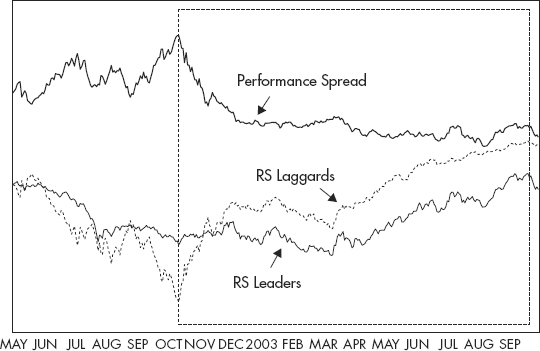
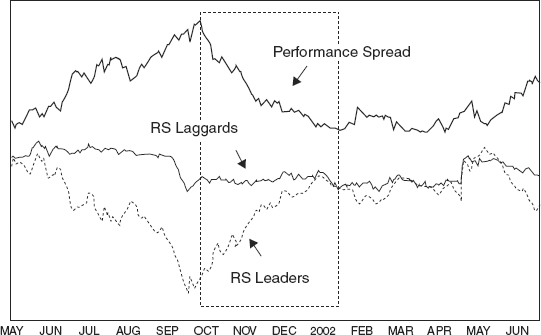
In April of 2000, the S&P 500 topped 1,500, but by October of 2002, the most severe bear market since the 1970s had cut the price of the index in half. The rebound from the October low was typical, as energetic RS laggards outran lethargic RS leaders to the upside (see Figure 7.5). A retest sent prices moderately lower, but a flat spread indicated weak downside momentum. Then in March of 2003, a second contrarian-sponsored rally took both leaders and laggards higher. The spread fell only slightly during this rally, evidence that most of the energy generated and stored during the bear market had been exhausted in the October to December contrarian rally.
FIGURE 7.5 May 2002—September 2003
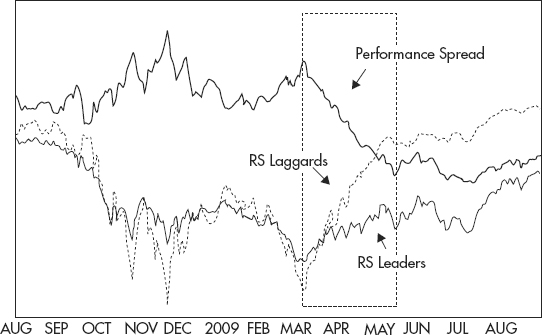
Following the “flash crash” of 2008, RS laggards were conspicuous beneficiaries of contrarian bargain hunting during the rebound following the March 2009 low (see Figure 7.6).
FIGURE 7.6 August 2008—August 2009
The contrarian rebound is a regular feature after bear market bottoms, but not all contrarian rallies mark the beginning of a new bull market. Contrarian rallies are, by our definition, corrective, and any number of corrections may interrupt an extended bear market. As our examples demonstrate, until confirmed by a rising spread, the initial, contrarian-driven phase of a bull market is indistinguishable from a bear market correction.
A broad decline began in 2000, and in action definitive of momentum-driven declines, laggards outpaced RS leaders to the downside (see Figure 7.7). A rebound from fall 2001 lows featured RS laggards, and the performance spread fell as the market rose. The rally during that fall and winter was identical in every respect to corrective recoveries that initiate bull markets. In early 2002 the spread rose a bit before stalling as group leaders and laggards meandered through the next three months. In April the spread began to rise, but the transition to a rising spread did not mark the beginning of a new bull market. Instead, momentum pointed the way lower, and the bear market resumed.
FIGURE 7.7 May 2001—June 2002
A market can and does often cease to be a bull market long before prices generally begin to break. My long expected warning came to me when I noticed that one after another, those stocks which had been the leaders of the market reacted several points from the top and—for the first time in many months—did not come back.
—Jesse Livermore12
This proposition is a familiar one to market traders. The stocks which are strongest just prior to a bear market are often those that suffer a substantial price decline when the bear market begins.
—Robert A. Levy13
Contrarian herding is seen not only near bear market bottoms, but as well around bull market tops, though not with the same dependable regularity. Once a bull market has peaked, traders sometimes take profits in RS leaders earlier and more decisively than in laggard issues. Laggards may even improve as bids shift from stronger to weaker stocks. The behavior of RS leaders during the spring of 2000 is a good example of the contrarian collapse (see Figure 7.8). A powerful bull market had lifted favored stocks, mostly technology and Internet issues, to large premiums over laggards. Once traders began to take profits, inflated RS leaders fell sharply. The decline in leaders gave laggards a boost as traders, still bullish but now less inclined to take on risk, retreated into dependable blue chips, which had lagged during the advance.
FIGURE 7.8 Contrarian Collapse—Spring 2000
A normal bull market correction is a pause within a longer uptrend. Prices react then recover to new highs. A contrarian collapse, on the other hand, is a deathblow to a bull market. It is a correction from which there is no recovery. The difference between a normal correction and a contrarian collapse is one of degree, not kind. I know of no way definitively to distinguish a contrarian collapse from other bull market corrections, but note that historically such reversals have occurred only after sustained, momentum-driven advances.
A contrarian collapse knocks strong groups out of market leadership and often into the bottom quartile of RS. It is not unusual for strong groups to drop collectively by 20 percent or more within several months. The contrarian collapse, like the contrarian rebound, is corrective. Since all corrections are countertrend moves, trading these episodes is risky business. However, given the long-term bullish bias of traders, attempting to profit by shorting RS leaders during a contrarian collapse is particularly hazardous.
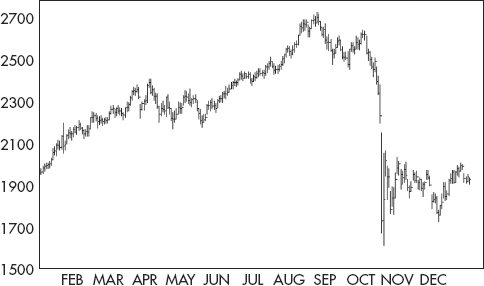
On October 19, 1987, the Dow Jones Industrial average declined 22.6 percent in the largest single-day drop in history. The decline on Black Monday was nearly twice that of Black Tuesday on October 29, 1929. From the opening of the market on October 14, 1987, through the close on October 19, the major U.S. stock indexes fell on average more than 30 percent. Academics have been scratching their heads since trying to account for the suddenness and severity of the decline. Computer trading, the use of derivatives, illiquidity generated by massive sell orders, less-restrictive margin requirements, and overvaluation have all been offered as explanations. Our concern is not with such accounts, but with traders’ behavior. Specifically, would the indicators developed so far have offered practical aid to momentum traders?
The opening bell on January 2, 1987, began a rally that added more than 40 percent to the Dow Jones 30 by late August (see Figure 7.9). A normal-looking correction from the August high shaved a little more than 8 percent from the index before prices rallied again into the early days of October. The index gave little indication of what was to follow.
FIGURE 7.9 Dow Jones Industrial Average—1987
The forward performances of RS leaders and laggards tell another story.14 Through early May, momentum advanced leaders faster than laggards, but then leaders began to flag as laggards outran leaders to the upside (see Figure 7.10). On the evidence, traders had become less inclined to pursue the strongest stocks and now preferred other issues that had lagged during the previous advance. This behavior suggests that traders were turning risk averse and contrarian, even as the market continued to rally.
FIGURE 7.10 Stock Leaders and Laggards—1987

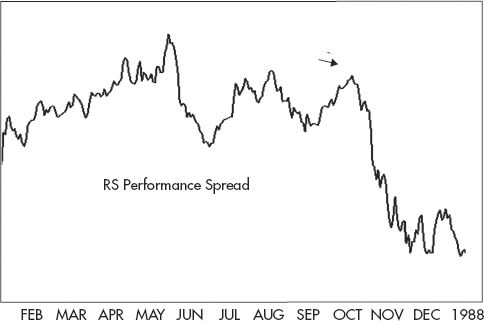
These indications are confirmed by the performance spread, which rose during the first four months of the year before peaking in May (see Figure 7.11). The decline in the performance spread from that point was punctuated by rallies in July and September, neither of which threatened the overall declining trend of the series. The failure of momentum signaled by the irregular descent of the performance spread after May issued a clear warning that the summer rally was losing momentum.
FIGURE 7.11 Performance Spread—1987
The relative strength spread gave indications of a loss of momentum similar to those offered by the performance spread (see Figure 7.12).
FIGURE 7.12 Relative Strength Spread—1987
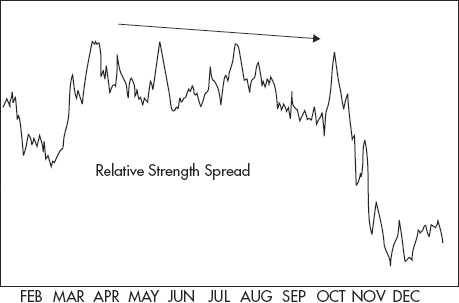
By late August, declines in both versions of the spread confirmed the absence of positive feedback. The subsequent price decline that October was attended by falling spreads, evidence that the drop was not a momentum-driven bear market, but a deep correction within a longer-term bull market.
1. Jesse Livermore, How to Trade in Stocks (New York: Duell, Sloan and Pearce, 1940).
2. Bertrand Russell, The Will to Doubt (New York: Philosophical Library, 1958).
3. Jack D. Schwager, The New Market Wizards (New York: Harper Collins, 1992).
4. Mark Fenton-O’Creevy, Nigel Nicholson, Emma Soane, and Paul Willman, Traders: Risks, Decisions, and Management in Financial Markets (New York: Oxford University Press, 2005).
5. Chairman of Dreman Value Management.
6. Head of Vanguard’s Windsor Fund from 1964 to 1995.
7. Eugene F. Fama and Kenneth R. French, “The Cross-Section of Expected Stock Returns,” Journal of Finance 47, no. 2 (1992); and Josef Lakonishok, Andrei Shleifer and Robert W. Vishny, “Contrarian Investment, Extrapolation, and Risk,” Journal of Finance 49, no. 5 (1994).
8. Some of the 151 bank stocks in this study are thinly traded, and as a practical matter would be difficult to trade actively:

9. The back test assumes that dollar amounts short and long are equalized daily.
10. During periods of positive feedback, the lists of leaders and laggards do not change as rapidly, since under those conditions strong stocks tend to remain strong, and weak stocks, weak.
11. Robert A. Levy, The Relative Strength Concept of Common Stock Price Forecasting (New York: Investors Intelligence, Inc., 1968).
12. Livermore, How to Trade in Stocks.
13. Levy, The Relative Strength Concept of Common Stock Price Formatting.
14. These 151 stocks make up the universe used in this analysis: