Control Groups in Pretest-Posttest Research
Controls with behavioral measures
Controls with self-report measures
Noting instances of reactivity
Sources of Demand Characteristics
Controlling Demand Characteristics
Measurement of the dependent variable
Influencing participants’ responses
Minimizing the experimenter’s role
Suggestions for Further Reading
Questions for Review and Discussion
A major objective of research design is ensuring that any effects found are caused only by the independent variable and not by other factors in the research situation. These other factors are extraneous variables. Extraneous variables provide alternative explanations for the observed effect; if they are present, the researcher cannot conclude that the independent variable caused the effect. For example, in Chapter 2 we noted that in cross-sectional developmental research it is difficult to separate the effects of age, the independent variable in the research, from cohort effects, which provide a possible alternative explanation for any differences found between age groups. To the extent that there are plausible alternative explanations for the effect of an independent variable, we say that a study exhibits low internal validity; conversely, to the extent that we can have confidence that the results of a study are due only to the effects of the independent variable, we can conclude that a study exhibits high internal validity.
The presence of plausible alternative explanations for an effect can be ruled out on either of two grounds. Sometimes logic can show that it is unlikely that an extraneous variable had an effect. For example, in cross-sectional developmental research, if the difference in ages between the groups being compared is not large—say, 2-year-olds being compared to 3-year-olds—then cohort effects are unlikely. Cohort effects result from differences in age groups’ social environments, and in many cases a small age difference reflects a small difference in social environments. There are, of course, exceptions. For example, a child’s transition from preschooler to kindergartner represents both a 1-year age difference and a major change in the social environment.
The second way of ruling out alternative explanations is either to institute control measures that limit the effects of extraneous variables or to use research designs that estimate their effects as well as the effect of the independent variable. In the latter case, one could show that even if extraneous variables did have effects on the dependent variable, the independent variable also had an effect and so was a cause of the dependent variable. These control measures will be included in the discussions of possible sources of alternative explanations.
Alternative explanations can be classified into two broad categories, confounds and artifacts. A confound exists when two variables are combined so that the effect of one cannot be separated from the effect of the other. For example, if you conducted a study in which the experimental group contained only men and the control group contained only women, sex of participant would be confounded with the independent variable. An artifact exists when some aspect of the research situation other than the independent variable affects the dependent variable. For example, as we saw in Chapter 5, the so-called Mozart effect, is artifactual (Thompson, Schellenberg, & Husain, 2001). In the original research on the effect, music composed by Mozart was compared to relaxing music. However, later research demonstrated the performance improvement that the researchers found emerged because the pieces of Mozart’s music that they used as stimuli were arousing and put people in a good mood; relaxing music did not have this effect. Because other arousing stimuli also increase performance, the “Mozart effect” is not due to Mozart’s compositions per se but instead to the mood-improving qualities they share with other stimuli. The distinction between confound and artifact is not rigid; if an extraneous variable causes an artifact in only one condition of an experiment, it also constitutes a confound. In this chapter, we discuss the nature of confounds, a set of factors identified by Campbell and Stanley (1963) as possible sources of artifacts and confounds, and three other possible sources of artifacts and confounds: reactivity, demand characteristics, and experimenter expectancies.
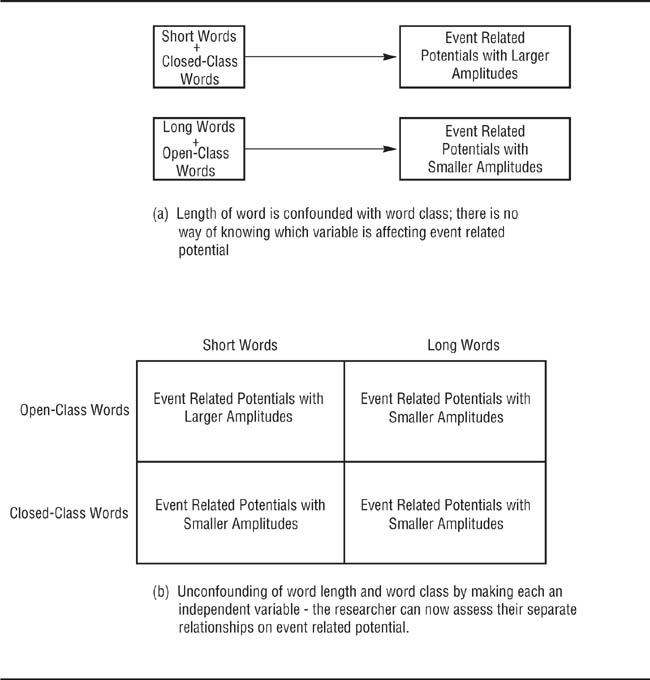
Researchers can easily avoid obvious confounds, such as having only men in one experimental condition and only women in another, which makes it impossible to separate the effect of participant sex from the effect of the independent variable However, more subtle confounds can creep into research and sometimes remain undetected until later researchers look at the topic of the research from a new perspective. Luck (2005) offers the example of an experiment that examined event related potential (ERP) waveform activity during a stimulus discrimination task. The experimenter was interested in sensory responses to closed-class words (such as articles and prepositions) and open-class words (such as nouns and verbs). However, closed-class words tend to be shorter than open-class words and, as illustrated in panel (a) of Figure 7.1, viewing shorter words could produce a different response than viewing longer words, so word length is confounded with type of word and there is no way of knowing which variable produced the obtained differences in ERP. One way in which to disentangle the effects of confounded variables is to “unconfound” them by treating each as an independent variable in the same study. This procedure results in what is called a factorial research design, which we discuss in Chapter 9. Such a design is illustrated in panel (b) of Figure 7.1 and lets the researcher determine the separate effects of two previously confounded variables on a dependent variable.
In nature, some variables tend to be associated with certain other variables. For example, people who share demographic characteristics such as age, sex, and ethnicity have undergone a common set of experiences associated with those variables, leading them to have some common attitudes, values, and other characteristics. Preschool girls and boys may choose to play with gender-stereotypic toys (such as dolls and trucks) because their parents have encouraged them to do so or because they inherently prefer those toys. Because of such natural confounds, when demographic variables are used as independent variables in research, one can almost never be sure whether group differences found on the dependent variable are due to the demographic variable, such as biological sex, or to a confounded variable, such as the results of gender-role socialization.
Confounding and Unconfounding of Independent Variables.
Treatment confounds occur when the manipulated independent variable (or treatment) in an experiment is confounded with another variable or treatment. For example, having a female experimenter conduct all the experimental sessions and a male experimenter conduct all the control sessions would result in a treatment confound. Although participants in each condition should have been exposed to only one treatment—the conditions of the independent variable—they actually received two combined treatments, condition of the independent variable and sex of the experimenter.
Because researchers are aware of the dangers of treatment confounds, they are careful to avoid them when they design research. However, confounds sometimes slip in when the study is conducted. For example, if the experimental condition requires equipment that is in short supply and the control condition does not, the researcher might have people participate individually in the experimental condition and in groups in the control condition. Although this procedure makes data collection easier and faster than having people in the control condition participate individually, it also confounds treatment with the social context of research participation. If differences between the experimental and control conditions are found, are they due to the independent variable or to working alone versus working in a group? A confound can also develop when data collection extends over a period of time, such as a semester, and all the research sessions for the control condition are run early in the term and all the experimental condition sessions later in the term. Such a procedure might be convenient if the experimental condition requires an elaborate lab set-up that would have to be frequently dismantled if experimental and control sessions were alternated. However, you would not know if any effects found were due to the independent variable or to the time period during which the sessions were conducted.
You must be very careful to avoid treatment confounds when designing and conducting research. The critical question to ask is, Do the participants in the experimental and control conditions have exactly the same experiences in exactly the same physical, social, and temporal environment except for the manipulation of the independent variable? If the answer is no, then a treatment confound exists and must be eliminated.
Confounds can occur in the measures used to assess dependent variables as well as in independent variables. A measurement confound occurs when a measure assesses more than one hypothetical construct. For example, many self-report measures that are designed to assess depression also assess anxiety (Dobson, 1985). Consequently, one does not know if a high score on such a measure represents high depression, high anxiety, or both. Measurement confounds, which are shown by the lack of discriminant validity in a measure, often result from natural confounds between the constructs being assessed. For example, a high degree of anxiety might be a natural concomitant of depression. However, because measurement confounds, even natural confounds, obscure the relationship between an independent variable and the dependent variable that one is interested in, only measures high in discriminant validity should be used in research. When measurement confounds cannot be avoided, statistical techniques, such as partial correlation analysis (described in Chapter 11), can sometimes be used to separate the effects of the confounded variables.
In 1963, Campbell and Stanley published the first, and now classic, analysis of the concept of internal validity in research. They identified a number of potential threats to internal validity, eight of which will be discussed here. Five of these threats are problems that can arise when research is conducted over a period of time, and the other three are related to the assignment of participants to experimental and control conditions.
Campbell and Stanley (1963) initially wrote their analysis of internal validity for educational researchers, especially those interested in the effectiveness of new educational programs. These researchers frequently conduct longitudinal studies, examining the impact of a program on students’ test scores by testing the students before the program is implemented (a pretest) and again after the program has had an opportunity to have an effect (a posttest). Campbell and Stanley’s analysis therefore focused largely on problems that can arise in these pretest-posttest designs. Some of these problems were examined in the discussion of longitudinal research in Chapter 2. This discussion focuses on their potential impact on studies in which data are collected over a period of time and on the role of the control group as a way of assessing the impact of these problems on a study.
History. The term history refers to events occurring outside the research situation while the research is being conducted that affect participants’ responses on the dependent measure. For example, Greene and Loftus (1984) conducted a study in which university students read a story about a trial that included eyewitness testimony and gave their opinions about whether the defendant was guilty or not guilty. They collected their data over the course of a semester, and partway through the semester an incident in which a man was mistakenly identified as a criminal received wide publicity in the city where the university was located. Greene and Loftus found that fewer participants made “guilty” judgments during the time the incident was publicized compared to students who participated before and after the publicity. A follow-up experiment provided evidence that the publicity caused the drop in “guilty” judgments. Because events outside the research situation can affect participants’ responses, researchers must be aware of events that could affect their data and check to see if such an effect is present.
Maturation. The term maturation refers to natural change over time. The change can be related either to age, as the term implies, or to the cumulative effects of various experiences over a period of time—what might be considered as getting wiser in addition to getting older. For example, Bouchard (1972) examined the relative effectiveness of two problem-solving strategies with college students as research participants. Students who were instructed to use the control strategy participated early in the semester, and those instructed to use the experimental strategy participated later in the semester. The participants in the experimental condition performed better on the problem-solving task than those in the control condition. Although this difference could reflect a difference in the effectiveness of the strategies, it could also be due to maturation: Because of their classroom experiences, students could have become better problem solvers over the course of the semester. Such maturation problems can be controlled by distributing experimental and control sessions of a study evenly across the time period over which the study is conducted. Maturation effects will then be about equal in both conditions, so they will cancel out when the conditions are compared.
Testing. Much behavioral science research is directed at testing the effectiveness of an intervention for changing a personal characteristic, such as mental health, behavior, or attitudes. One way to conduct such research is to pretest participants on the dependent variable (the characteristic to be changed), conduct the intervention, posttest participants on the dependent variable, and examine the amount of change from pretest to posttest. A testing confound occurs when taking the pretest affects scores on the posttest independently of the effect of the intervention. For example, people might try to keep their responses consistent across different administrations of a measure or try to “do better” on the posttest than they did on the pretest. The simplest way to deal with testing confounds is not to give a pretest; as noted later, pretesting is not necessary in many forms of research.
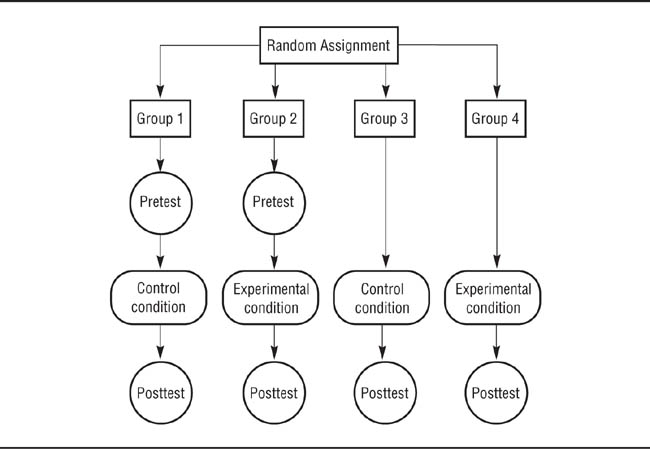
The Solomon Four-Group Design.
A difference in the posttest means of Groups 1 and 3 indicates a simple testing confound: Responses on the posttest differ because of a pretest. Unequal differences in the posttest means of Groups 1 and 3 versus Groups 2 and 4 indicate a complex testing confound: The effect of the pretest is different in the experimental and control conditions.
If a pretest is necessary or desirable, the presence and degree of testing effects can be tested by using what is known as a Solomon four-group experimental design (Braver & Braver, 1988). As its name says, the Solomon four-group design requires four sets of research participants (see Figure 7.2): two control conditions, one with a pretest and one without, and two experimental conditions, one with a pretest and one without. If a simple testing confound exists, the posttest means of Groups 1 and 3 in Figure 7.2 will differ: Because the only way in which these groups differ is in whether or not they received a pretest, a difference in the posttest means indicates that the pretest affected performance on the posttest. The presence of a more complex testing confound can be detected by comparing the differences in the posttest means of Groups 1 and 3 (the control conditions of the experiment) with the difference in posttest means of Groups 2 and 4 (the experimental conditions). If these differences are not equal, then pretesting is combining with the effect of the experimental manipulation to affect posttest scores: The pretest has different effects on the posttest performance of the experimental and control groups. Either form of testing confound calls the internal validity of the research into question.
Instrumentation change. Instrumentation change occurs when the measure used to assess the dependent variable changes over time, leading to artificial differences in scores at different points in time. Instrumentation change can take several forms. Mechanical and electrical measuring devices can go out of calibration as they are used, resulting in cumulative inaccuracies. For example, a timer may begin to run faster or slower with use. Although this problem is probably less severe with modern solid-state electronic devices than in the days of electromechanical instrumentation, battery powered instruments can go out of calibration when their batteries weaken. The solution to this form of instrumentation change is to periodically test any apparatus that might be subject to it. Another form of instrumentation change occurs during the process of coding or categorizing qualitative data; this observer drift is due to coders becoming less reliable over time. One cause of this decline is fatigue or habituation. Another cause is a change in the way observers classify participants’ behaviors into categories; for example, as they gain experience, observers may change how they categorize aggressive or nonaggressive behaviors. In such cases, it is a good idea to assess the reliability of raters at several points in the coding process. Problems due to observer drift can also be reduced by careful construction of classification systems and carefully training observers. Another solution is to have different observers code the behavior of interest in different random orders so that effects due to fatigue or habituation are spread out over the ratings (Hoyle, Harris, & Judd, 2002).
Statistical regression. Statistical regression can occur when people are selected for participation in research based on their having extreme scores on what will be the dependent variable. For example, treatment outcome research is conducted with participants who have extreme scores on measures of the problem being treated: To test the effectiveness of a treatment program designed to alleviate a problem such as test anxiety, you need participants who score high on a measure of test anxiety. Recall the discussion of random measurement error in Chapter 6. One reason why a person might get an extremely high score on a measure is because random error raised the score beyond the person’s already high true score; conversely, random error could make a low true score extremely low. When extreme scorers are measured a second time, random error can have little influence in raising extremely high scores or lowering extremely low scores: Those scores are already about as high or low as they can go. However, random error can move the scores in the other direction, where there is room for change. Consequently, people who get extreme scores on the first administration of a measure will, on the average, get less extreme scores on the second administration of the measure: Scores for high initial scorers decrease and scores for low initial scorers increase. This increase and decrease of initial extreme scores is called statistical regression; because the scores change in the direction of the population mean score on the measure, this phenomenon is also called regression toward the mean.
Changes in Scores From Pretest to Posttest Grouped by Pretest Scores.
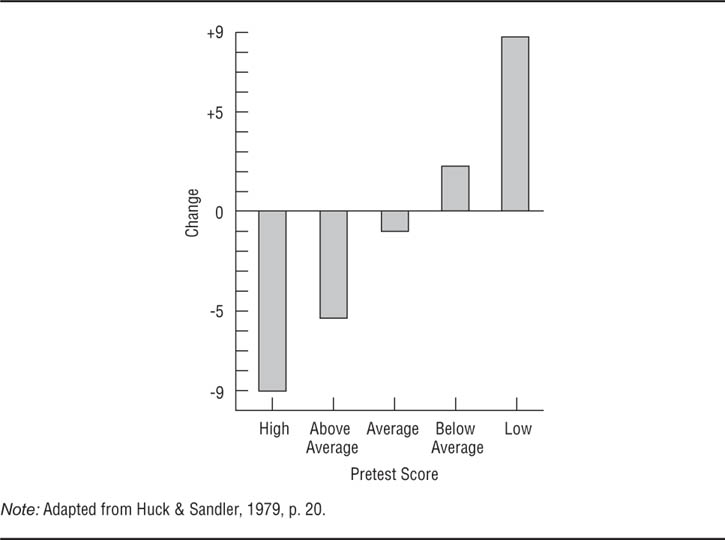
Extreme scores on the pretest are partially due to random measurement error; these errors tend to be in the other direction at the posttest, causing extreme scores to change more than moderate scores, a process called regression toward the mean.
Huck and Sandler (1979) describe an excellent example of statistical regression. Cadets in an Air Force officer training program took a personality test near the beginning of their training and were divided into five groups based on their scores: high, above average, average, below average, and low. They took the same test near the end of their training. Figure 7.3 shows the average amount of change in each group’s scores. Notice that the cadets who had the most extreme scores on the initial administration of the test showed the greatest change and that the change was in the direction of the mean: Initially high scorers went down and initially low scorers went up. The best solution to the problem of statistical regression is not to select research participants on the basis of extreme scores on the dependent variable. However, this procedure is impossible in some forms of research, such as that on treatment effectiveness. In those cases, the solution to this problem, and to other time-related problems in pretest posttest research, is use of a control group.
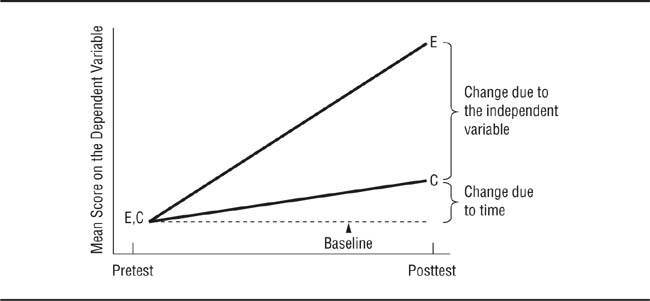
You can separate the effects of time-related threats to internal validity from the effects of the independent variable in pretest-posttest research by using a control group. For this procedure to be effective, the members of the control group must be as similar as possible to the members of the experimental group. In most research, this equivalence is attained by randomly assigning participants to groups. Hence, when participants are selected on the basis of extreme scores on the dependent variable, you should randomly assign the people selected to the experimental and control groups. As discussed in the Chapter 9, although random assignment does not guarantee equivalence between groups, it produces equivalence most of the time. As shown in the “Pretest” section of Figure 7.4, this procedure results in the members of the experimental and control groups having the same mean pretest score on the dependent variable. The “Posttest” section of Figure 7.4 shows mean posttest scores for the two groups; the dashed line indicates the baseline score—the pretest mean. The pretest-posttest change in mean scores for the control group represents the collective effects of time-related threats to internal validity—the amount of change that would have occurred if no experimental treatment had taken place. The posttest difference between the mean scores of the experimental and control groups represents the effect the experimental treatment has over and above the effects of time-related threats to internal validity.
The last sentence has two important implications. The first is that pretest-posttest research must always include a control group. Without a control group, there is no way to determine whether any changes found are due to the effect of the independent variable or the effects of one or more of the time-related threats to internal validity. The second implication is that a pretest is not needed in most research. If the experimental and control groups have the same mean score on the dependent variable before the manipulation of the independent variable, the effect of the independent variable will always be shown in the difference in the mean scores of the groups when the effect of the independent variable is measured. Not conducting a pretest has two advantages: It saves the time and other resources that would be expended on pretesting, and it avoids the possibility of testing confounds and the need to use the complex Solomon four-group design.
Use of a Control Group to Separate Treatment-Related and Time-Related Change.
The pretest-posttest change for the experimental group includes both treatment and time effects, whereas the change for the control group includes only time effects; therefore, the difference between the two shows the true treatment effect.
Although pretesting has these disadvantages, we don’t want to leave the impression that it should never be used. Pretesting serves several valuable purposes in research, such as verifying the preexperimental equivalence of experimental and control groups on the dependent variable and allowing researchers to compare the characteristics of people who drop out of a study with the characteristics of those who complete it. In planning research in which pretesting might be used, carefully consider its advantages and disadvantages for that piece of research to determine if the value of the information that it will produce will compensate for the difficulties it entails.
A selection bias occurs when research participants in the control condition differ in some way from those in the experimental condition. This section briefly considers three forms of selection bias: nonrandom assignment of research participants to the conditions of an experiment, the use of preexisting groups in research, and mortality.
Nonrandom assignment. The example given earlier of a confound—having only men in the experimental condition and only women in the control condition—is an example of a selection bias due to nonrandom assignment. When possible, researchers are careful to avoid such obvious selection confounds, but they can slip in unnoticed in other ways. A selection bias occurs anytime participants in the experimental condition of a study differ from participants in the control condition—such as when an experimenter uses people who volunteer for research as the experimental group and uses data from nonvolunteers for the control condition. For example, if cancer patients volunteer for an experimental treatment and their responses are compared to cancer patients who did not volunteer for the study, any differences in outcome may be due to characteristics of the volunteers and not to the treatment. As shown in Box 7.1, people who volunteer for research differ on a number of characteristics from those who do not volunteer. To the extent that these characteristics are related to the dependent variable in the research, you cannot be sure that any differences found between the experimental and control groups are due to the independent variable rather than to differences in participant characteristics. Data collection procedures can also lead to selection confounds. For example, collecting all the data for one condition of an experiment before collecting the data for the other condition can cause a selection confound as well as leave the door open for a history confound if people who volunteer early in the data collection period differ from those who volunteer later in the period.
• |
People who volunteer for psychological research tend to be |
• |
Better educated |
• |
Of higher socioeconomic status |
• |
Higher scorers on IQ tests |
• |
Higher in need of social approval |
• |
More sociable |
• |
More excitement-seeking |
• |
More unconventional |
• |
Less authoritarian |
• |
Less conforming |
• |
From smaller towns |
• |
More interested in religion |
• |
More altruistic |
• |
More self-disclosing |
• |
More maladjusted, especially when the research appears to deal with unusual situations or with treatment for a psychological disorder |
• |
Younger |
• |
Women are more likely to volunteer than are men for most research, but men are more likely to volunteer for stressful research. |
• |
Jews are more likely to volunteer than are Protestants, and Protestants are more likely to volunteer than are Catholics |
Source: Based on Rosenthal & Rosnow (1975, pp. 88-89).
Preexisting groups. Selection biases can also arise in research conducted in natural settings when researchers must assign preexisting natural groups, rather than individuals, to experimental and control conditions. Selection bias is a problem in these situations because people are not randomly assigned to natural groups. Sometimes people choose to join a group, sometimes the group chooses them, and sometimes they are assigned to a group by a decision maker, such as a school administrator or personnel director. In any of these cases, the choices and assignments are probably not random, but are based on the characteristics of the people involved. Therefore, people in preexisting groups have common characteristics that can be confounded with treatment conditions when the groups are used as experimental and control groups in research. For example, Duncan (2007) tested whether allowing students to use notes during their final exam improved test performance. She allowed students in five of her course sections to use notes while those in three other sections could not use notes during the exam. One problem with this experiment is that students chose which section to enroll in, and students who choose sections that meet early in the day may differ from students who enroll in sections that meet later in the day. We discuss this problem in more detail in Chapter 10, which deals with research in natural settings.
Mortality. Mortality refers to people’s dropping out of a study as it is conducted. In longitudinal research, if only people with certain characteristics drop out, such as the heaviest drug users in a study of drug abuse, the results of the study can be applied only to those people whose characteristics match those of the “survivors.” In experimental research, differential mortality occurs when people in one condition of the experiment are more likely to withdraw from the research than are people in other conditions. For example, Huck and Sandler (1979) describe a study that tested the effect of isolation on attention over a 7-day period. Participants in the experimental condition were put in isolation chambers that were dark and soundproof, providing little sensory stimulation; participants in the control condition were put in similar chambers that were well lit and each of which contained a television and a radio that the participant could use when testing was not in progress. Testing consisted of 90-minute periods in which participants were required to pull a lever as soon as they heard a “beep”; 60 beeps were sounded at random intervals during each test period. Five percent of the control participants withdrew from the research, compared to 48 percent of the experimental participants. The researchers found that the experimental participants made more correct responses to the beeps than did the control participants. However, because the experimental participants who finished the research were people who could put up with 7 days of isolation, they were probably very different from the control participants in their psychological makeup. Consequently, there was probably a confound between participants’ characteristics and the condition in which they participated.
There is no real solution to the problem of differential mortality. When faced with the problem, researchers can try to determine if survivors and dropouts in the high dropout condition differ on any demographic characteristics or on variables assessed during a pretest. If they do, these differences can be taken into account when interpreting the results of the research by comparing the survivors with the members of the other group who have similar characteristics. If differences appear between the groups on the dependent variable, then the independent variable probably caused them. However, the results of the study would apply only to people with characteristics similar to those of the survivors in the high-dropout condition. Also, if differential mortality does not occur until after some time into the data collection period, analysis of the data collected before mortality became a problem would not be affected by selection. For example, if none of the experimental participants in the isolation study just described dropped out until the 5th day, the data from the first 4 days would present no selection problem.
Whenever the process of measuring a variable rather than the content of the measure affects scores on the measure, the process is said to be reactive. Reactivity threatens the internal validity of research because participants’ scores on measures result from the reactive situation rather than from the effects of the independent variable. This section examines the sources of reactivity in measurement and some steps the researcher can take to control reactivity.
Reactivity can stem from two sources: evaluation apprehension and novelty effects. These factors can elicit social desirability response biases, distract people from the research task, and affect physiological response.
Evaluation apprehension. Evaluation apprehension is the nervousness people feel when they believe someone is judging their behavior. High levels of evaluation apprehension motivate people to avoid the adverse judgments of others by behaving in ways they believe will lead to positive judgments. Consequently, people review their behavioral options in the situation and choose the one they think will put them in the best light with anyone observing their behavior. In this context, “behavior” includes both directly observable actions and responses to self-report measures; “behavior” also includes the lack of an active response, such as remaining passive in the face of a stimulus or omitting an item on a questionnaire. Evaluation apprehension is especially likely to be aroused in the presence of authority figures and people who are perceived to have special abilities to analyze human behavior. Researchers are viewed this way by most research participants (even though we may not view ourselves that way), so evaluation apprehension is likely to be high among research participants (Haynes & Horn, 1982; Weber & Cook, 1972).
Evaluation apprehension is also likely to make a research participant more aware of other people present in the research setting, such as the researcher and other participants, and so lead the participant to pay attention to those people and their reactions to her or his behavior. Consequently, the participant can become distracted from the research task, leading to deficits in task performance, such as an increased number of errors. If error rate or evaluation of the participants’ performance is a dependent variable in the research, then the validity of the research could be reduced even if there is no social desirability response bias.
The nature of the behavior being studied can increase participants’ levels of evaluation apprehension. When people believe they are being observed, they are likely to try to avoid acting in ways that contravene social norms, such as acting aggressively or expressing prejudicial attitudes, or performing behaviors that they believe would embarrass them. For example, Yu and Liu (2009) found that Taiwanese students were more comfortable posting questions they had about assignments in a physics course to an online forum when they could use a nickname or post anonymously than when they were required to use their name, mainly because not identifying themselves avoided the potential for embarrassment. People are also likely to underreport non-normative and potentially embarrassing attitudes and behaviors on self-report measures. It is important to remember that the social desirability and embarrassment potential of behaviors are in the eyes of the research participant, not necessarily those of the researcher. What the researcher considers an innocuous behavior or question might be quite sensitive for the research participant. Consider a hypothetical study that tests the prediction that high levels of anxiety lead people to eat more than they would if they were not feeling anxious. The researcher manipulates participants’ anxiety levels and has them fill out a questionnaire. There is a bowl of peanuts on the table at which the participants sit, and the researcher tells the participants they can snack on the peanuts while completing the questionnaire. Although eating peanuts is a relatively innocuous behavior, an overweight person might avoid eating while under observation, no matter how strong the desire to eat, to avoid making a bad impression on the researcher. Other behaviors assessed by self-report, such as sexual behavior or aspects of personal history, might be considered private by people and so might not be reported accurately.
Cultural differences may also affect the extent to which behavior is influenced by evaluation apprehension. For example, there are cultural differences in people’s willingness to make favorable self-evaluations, with individuals from Western cultures such as Europe and the United States being much more willing to evaluate themselves favorably than individuals from Eastern cultures such as Japan and China. However, Kim, Chiu, Peng, Chai, and Tov (2010) showed that under experimental conditions that reduced evaluation apprehension, such as allowing participants to privately evaluate their performance, these culture differences were reduced. Other researchers have found that Japanese research participants are more likely to engage in the self-serving bias—the tendency to take credit for one’s successes but to avoid self-blame for one’s failures—when their responses are anonymous (Kudo & Numazaki, 2003). Hence, what look like culture differences may actually be due to experimental procedures, in this case procedures that resulted in increased evaluation apprehension for members of some cultural groups.
Novelty effects. Any aspects of the research situation that are new (or novel) to the participants can induce reactivity. These novelty effects stem from participants’ apprehension about dealing with the unfamiliar and paying attention to the novel features of the situation rather than the task at hand. For example, people are more likely to experience a novelty effect when they are brought into a new environment, such as a laboratory, to participate in the research than they are in a more familiar setting. However, adding a new feature, such as an observer or a piece of research equipment, to a familiar environment can also cause a novelty effect; this problem may be especially severe when children are studied. People are often apprehensive about being attached to physiological recording equipment because they are unsure of the effects it will have, and this apprehensiveness will be reflected in the levels of physiological arousal the equipment records. Finally, researchers should be cautious when conducting research based on Western concepts in non-Western cultures; performance may be influenced when participants are tested using measuring instruments or experimental procedures that are common in the researchers’ culture but uncommon in the participants’ culture. For example, in Western cultures, intelligence is often assessed by cognitive tests of abstract reasoning that may be unfamiliar to people in non-Western cultures. If so, it would be inappropriate to conclude that group differences in test scores on such measures reflected cultural differences in intelligence (Smith, Bond, & Kağitçibaşi, 2006).
There are a number of steps researchers can take to limit reactivity. Some of these control measures can be used with more than one measurement modality, and others are better suited to self-report or behavioral measurement. In addition, it can be useful to keep track of apparently reactive behavior.
General control measures. Because evaluation apprehension is a major factor in reactivity, research procedures directed at reducing this form of anxiety can limit reactivity (Harris & Lahey, 1982; Weber & Cook, 1972). Labeling experimenters as psychologists or implying they have special expertise in evaluating abilities or personality tends to increase evaluation apprehension and so should be avoided. Experimenters should also avoid giving participants negative feedback to responses, such as by frowning or other nonverbal or paralinguistic cues. In contrast, putting participants at ease, such as by greeting them in a friendly manner and explaining the experiment to them, tends to reduce evaluation anxiety. Reactivity effects are also reduced when the researchers are fluent in the participants’ native language and are clearly familiar with their culture (Ross, 2004). Aronson, Ellsworth, Carlsmith, and Gonzales (1990) suggest that research situations and tasks that participants find interesting and psychologically involving can get them so wrapped up in what they are doing that they are distracted from their anxiety and focus on the research task rather than on the researcher and the research environment.
Novelty effects can be controlled by giving participants time to adjust to the new situation. For example, once people become used to the feel of physiological recording devices, pulse rate and other physiological variables return to their normal ranges. Similarly, people can become so used to having outside observers present in their natural environments that they forget to “edit” their behavior for social desirability or are no longer motivated to do so (Harris & Lahey, 1982; Haynes & Horn, 1982). Schofield (1982) gives an example of the latter response in this quotation from her field notes from an observational study of a middle school:
Today as I entered the sixth grade house as classes were changing, I saw Richard and another black male whom I don’t know tussling. After glancing at me, Richard’s companion drew away from him and leaned over as if to pick up his books on the floor. Richard said, “Aw, come on, she just writes. She never does anything.” He then gave his companion a light shove and they were at it again. (p. 33)
Finally, when studying behaviors that might be influenced by social desirability concerns, one could deceive the research participants about the true nature of the research, leading them to believe that the study is concerned with some innocuous behavior. For example, Milgram (1974) told the participants in his studies of destructive obedience that the research dealt with the use of punishment in learning. Milgram believed that if he told his participants that the purpose of the research was to see if they would follow instructions that would result in severe pain for a fellow participant, then his dependent variable of whether the participants gave or refused to give the severe shock would be impossible to interpret. Because hurting someone is socially undesirable, Milgram would have no way of knowing whether a participant’s refusal to continue was the participant’s true response to the situation or simply a case of social desirability response bias. However, before using deception to reduce reactivity, you should carefully consider its ethical implications (see Chapter 3).
Controls with behavioral measures. Because some reactivity stems from research participants’ knowledge that they are under observation, one way to limit reactivity is to prevent participants from realizing they are being observed. One way to accomplish such covert observation is to keep the observers hidden or have them play a role that allows them to blend into the environment. In an example of the latter strategy, Piliavin, Rodin, and Piliavin (1969) studied subway riders’ responses to a staged emergency by having an observer play the role of a passenger. Modern technology has facilitated covert observation through the development of small television cameras and other devices that can be easily concealed and record behavior without the presence of an observer but, as we discussed in Chapter 3, there are ethical considerations in doing so. There is also what Aronson et al. (1990) call the waiting room ploy, in which people come to participate in an experiment, but the experimental manipulation occurs while they are waiting for what they think will be the experiment to begin. Latané and Darley (1968), for example, had a receptionist greet college students who had come to participate in an experiment and direct them to a waiting room. As they waited, either alone or with other students waiting for experiments (who were actually confederates of the experimenters), the room began to fill with what appeared to be smoke. The researchers wanted to see if the participants’ responses would be affected by the presence of the confederates, who ignored the smoke. Finally, research in natural environments can use participant observation, in which the researcher pretends to be just another person in the situation that he or she observes. For example, a researcher lived in a co-ed college dorm for a year and took a full load of classes as a “returning older student” (Nathan, 2005). In doing so, she learned about the typical undergraduate experience on a large university campus, including students’ study and eating habits, what students did for fun, who they socialized with, and their willingness to engage in behaviors such as cheating. Although methods such as participant observation are effective in preventing reactivity, they raise the ethical issue of collecting data without people’s knowledge and consent.
As an alternative to covert observation, you could have observations made by people, such as parents or teachers, who form a natural part of the observation setting. Unfortunately, unless such observers are well trained, two problems can arise. First, the observers’ data might be biased because of their knowledge of and prior beliefs about the people being observed. Second, the observers’ behavior can change as a result of making and recording observations, which, in turn, can affect the behavior of the people being observed (Hay, Nelson, & Hay, 1980).
Controls with self-report measures. When collecting self-report data, it is impossible to prevent people from knowing that they are, in a sense, under observation. However, allowing people to respond anonymously helps to reduce evaluation apprehension and so can lessen reactivity. Anonymity is easily gained through the use of written questionnaires. When questionnaires are administered in a group setting or online, research procedures can be established that make it impossible for the responses of any participant to be identified as coming from that person. As a result, evaluation apprehension is minimized. Paulhus (1991) suggests three procedures for enhancing and reinforcing participants’ perceptions of anonymity: (a) Physically separate people (for example, leave an empty chair between two people), especially people who are acquainted; (b) remind people several times to leave their names and other identifying information off the questionnaire and response sheet; and (c) have participants turn their questionnaires in by sealing them in envelopes and dropping them in a box on the way out and tell them about this procedure before they begin to fill out the questionnaire. Not surprisingly, administration of a questionnaire in an interview format is most reactive because anonymity is impossible (Paulhus, 1991).
Another way to reduce socially desirable responding in self-reports is to convince people that you know when they are not being completely truthful. Most people would rather admit to a socially undesirable truth than be caught lying. The bogus pipeline technique, for example, has people answer questions while attached to what they think is a lie detector; various deceptions are used to convince research participants of its accuracy (Roese & Jamieson, 1993). However, with this procedure you face the ethical dilemmas of (a) lying to research participants so that they will be truthful and of (b) falsely convincing them of the effectiveness of an invalid lie-detecting device.
Noting instances of reactivity. Although reactivity should be avoided to the greatest extent possible, it sometimes becomes obvious, especially early in observational research, that people’s awareness of being under observation is affecting their behavior. Schofield (1982) recommends that researchers carefully note instances of apparent reactivity because these occurrences can be helpful in several ways. First, knowledge of the circumstances that lead to reactive behavior can provide clues for finding ways to avoid it. For example, an observer might be able to locate a less conspicuous spot from which to make observations. Second, people are likely to be most reactive in situations that raise sensitive issues; these issues might become an additional focus of the research. Schofield, for example, noted that during faculty meetings she observed teachers glancing at her when they discussed certain topics; she then incorporated these topics into her interview and observation plans. Finally, noting which responses appear to result from reactivity prevents them from being confused with natural responses during data analysis.
Orne (1962) postulated that participants in behavioral science research are curious about what is happening to them and want to understand their experience and its meaning. He suggested that to achieve this understanding, participants look for information about the nature of the research and form their own hypotheses about the goals of the research. They can then act on these hypotheses, purposively behaving in ways that affect the outcome of the research. Orne gave the name demand characteristics to the information present in the research situation that allows participants to form their own hypotheses. He used the term demand because holding a hypothesis could place a demand on participants to act in certain ways. When demand characteristics affect participants’ behavior in ways that lead them to give artificial responses, they constitute a form of reactivity.
Research participants have two sources of information available to them that allow them to formulate hypotheses. One is the information that the researcher provides them as part of the informed consent procedure. For example, AuBuchon and Calhoun (1985) wanted to know if women would report more negative menstrual symptoms when they knew that those symptoms were the research topic. They told half the women in a study that the study was examining the physical and psychological changes women experience during menstruation; the other participants were told that the study was examining such changes over time, with no mention of menstruation. The researchers found that the women who were told the study was about menstrual symptoms reported high levels of negative mood and more physical symptoms than did the women who did not know the study was about menstruation. The latter group of women reported the same average mood state and number of symptoms as did a comparison group of men. AuBuchon and Calhoun (1985) concluded that “the report of stereotypic menstrual cycle symptomatology is influenced by social expectancy [that such symptoms will occur] and experimental demand characteristics” (p. 35).
The second source of information is clues to the research hypothesis that are part of the research procedures. For example, Velten (1968) developed a procedure for inducing mildly depressed and happy mood states in research participants. Participants read aloud a set of 60 mood-related statements; in the depressed condition, one such statement might be “Right now, I am feeling sadder than I have in a very long time.” Velten found that people who underwent the mood induction reported happier or sadder moods, as appropriate, than people who read a set of 60 neutral statements. However, as Polivy and Doyle (1980) have pointed out, the Velten mood statements provide research participants with very strong cues about how the researcher expects them to feel. Consequently, participants who are unaffected by the mood induction statements might simulate the appropriate mood, acting as though they were happy or sad in order to help the researcher get “good” data. The following sections examine aspects of demand characteristics: the motivations that research participation can arouse and the behavioral consequences of those motivations, and means of controlling demand characteristics in research.
Participation in psychological research can lead to three types of motivation: evaluation apprehension, reactance, and apathy. When demand characteristics allow participants to deduce a hypothesis for the research, these motivations can lead participants to play one of three corresponding participant roles: the good participant, the negative participant, and the apathetic participant (Greenberg & Folger, 1988).
The good participant. In our discussion of reactivity we noted that it is not unusual for research participants to feel anxious about how the researcher will evaluate their behavior. A possible result of this evaluation apprehension is a social desirability response bias, which could lead the participant to want to “help” the researcher by responding in the “right” way—a way that will support the hypothesis the participant thinks is under investigation. As Orne (1962) noted,
A volunteer who participates in a psychological experiment may do so for a wide variety of reasons ranging from the need to fulfill a course requirement, to the need for money, to the unvoiced hope of altering his personal adjustment for the better, etc. Over and above these motives, however, college students tend to share (with the experimenter) the hope and expectation that the study in which they are participating will in some material way contribute to science … [I]t follows that the subject has a stake in the outcome of the study in which he is participating. For the volunteer subject to feel that he has made a useful contribution, it is necessary for him to assume that the experimenter is competent and that he himself is a “good subject.” (p. 778)
To the extent that the desire to see oneself as a “good subject” leads to behaviors that fail to reflect participants’ true responses to the independent variable, they reduce the internal validity of the research: The outcome is determined by the participant’s response bias, not by the independent variable.
The negative participant. At the other end of the behavioral spectrum from the good participant is the negative participant. This role can be activated when people feel they are being coerced into doing something they don’t want to do, such as doing what the researcher is telling them to do. This perceived infringement on participants’ freedom of choice arouses a state called psychological reactance (Brehm & Brehm, 1981) that motivates them to show the researcher they cannot be pushed around. They demonstrate their independence by doing the opposite of what they think the researcher wants them to do. In contrast to good participants who try to confirm what they believe is the researcher’s hypothesis, negative participants try to disconfirm the hypothesis. As with good participants, to the extent that these behaviors do not reflect the negative participants’ normal responses, they reduce the internal validity of the research.
The apathetic participant. Both good participants and negative participants feel a high level of motivation to affect the results of research, albeit in opposite directions. Apathetic participants feel no motivation; they simply don’t want to be there. Consequently, they pay little attention to the research task, responding in essentially a random fashion to the independent variable and rushing through the research task as quickly as possible in order to get it over with. The apathetic role is probably most likely to be engendered in participants recruited from subject pools who really want neither to participate in research nor to do the alternative assignments and who see rushing through research participation as the most convenient way to meet the course requirement. Children may also be apathetic participants if they are participating simply because they are reluctant to say no to an adult’s request for their help. Of course, both adults and children who are initially interested in participation may become apathetic if they find the research task boring. Because apathetic responses are essentially random, they too reduce the internal validity of research.
Impact of participant roles. Orne’s (1962) article launched a decade of research on the impact of participant roles on the results of research, focusing on the good role and the negative role. The results of such research have, however, been inconclusive: Some studies have found evidence for the impact of participant roles, but others have not (Greenberg & Folger, 1988). For example, Christensen (1977) found he could elicit the negative role in participants only when the researcher acted in an extremely manipulative and controlling manner. In a study where the experimental hypothesis was clearly conveyed by a confederate, Nichols and Maner (2008) found that participants’ attitudes toward the experiment and the experimenter were correlated with their likelihood of responding to experimental demand. These results suggest that the vast bulk of research, in which the researcher politely solicits the cooperation of participants but does not give strong cues about the experimental hypothesis, would be unlikely to evoke role-related behavior. This difficulty in activating participant roles might also relate to what Fillenbaum (1966) called the “faithful” role: Most research participants try to enact the role of neutral research participant, which involves following the researcher’s instructions and responding as normally as the circumstances of the research allow. This role might induce its own behavioral biases, such as trying too hard to “act naturally,” but may also be the closest to realistic responding that we can expect of participants when they know they are under observation.
There appears to be no research on the prevalence of apathy among research participants. It is, however, a phenomenon that almost everyone who has collected data has encountered. As noted earlier, it can have obvious behavioral indicators, and people who appear apathetic about participating in research should be offered the opportunity to withdraw. Many online data collection programs record the amount of time a participant spent completing the study; this information allows researchers to discard data based on unreasonably short response times.
The lack of strong research evidence to support the effects of demand characteristics on research results might lead one to decide, as did Kruglanski (1975), to ignore the issue. However, the procedures most commonly recommended as controls for demand characteristics (for example, Aronson et al., 1990; Rosenthal & Rosnow, 2008) are easy to implement and may also help to reduce reactivity in general. Let’s briefly examine a few.
Cue reduction. Because demand characteristics consist of cues to the research hypothesis that are contained in the research procedures, reducing those cues should reduce the likelihood of artifactual results. For example, avoid using very obvious manipulations such as the Velten (1968) mood induction technique described earlier. Demand characteristics are also more likely when participants are exposed to more than one experimental condition. For example, a meta-analysis found that researchers who used a within subjects design that assessed participants’ attitudes toward both older and younger targets found more evidence of ageism than did researchers who used a between subjects design that assessed attitudes toward only older or only younger targets (Kite & Johnson, 1988).
It’s a good idea to ask colleagues to look out for possible demand characteristics when they review your research proposal. Pilot studies and post-experimental interviews, described in Chapter 16, provide the opportunity to get the research participants’ viewpoint on your procedures and their perceptions of demand characteristics, if any. Asking participants to guess the research hypothesis at the end of the study can provide information about whether demand characteristics were operating. Finally, because fully informed consent could reveal the research hypothesis and induce demand, researchers sometimes deceive participants by withholding the hypothesis or by giving them a false hypothesis. However, because of the potential ethical problems involved in deception, undertake such procedures only when absolutely necessary and, if possible, obtain participants’ consent to deception. In addition, a thorough debriefing is essential (see Chapter 3).
Motivation. Because the good-participant role is a function of evaluation apprehension, the steps described earlier to reduce evaluation apprehension can also reduce the impact of demand characteristics. Current ethical requirements for reminding potential research participants of their freedom to decline participation and to withdraw from research might also reduce the likelihood of their taking the negative role. Psychological reactance—the motivation underlying the negative role—is aroused when people believe their freedom of choice is threatened. Reminding participants of the principle of voluntary participation should reduce any threat to freedom of choice and so reduce reactivity and the likelihood of negative responding. Smith and Richardson (1983) found that providing participants with information about the importance of a study increased their enthusiasm for it. If such information can be provided to participants as part of their introduction to a study without inducing other biases, it may help motivate potentially apathetic participants.
Role-play control groups. The concept of the good-participant role includes the supposition that “good” participants will tailor their responses so as to give researchers the data that participants think the researchers want. In essence, they try to “fake good,” with a good response being one that confirms the hypothesis as the participant understands it. Therefore, one way of determining if demand characteristics are affecting data is to describe the potentially demand-characteristic-laden manipulation to a group of participants and ask them to respond as if they had experienced it. Their responses would represent the effects of demand characteristics. For example, Alloy, Abramson, and Viscusi (1981) used this method in conjunction with the Velten (1968) mood induction technique: They described the Velten procedure to some participants, giving them a few mood statements as samples, and asked the participants to respond to the dependent measures in the way they thought people who had undergone the procedure would respond; that is, they were to “fake good.” Alloy et al. found that the role-playing participants responded differently from the participants who had actually undergone the Velten procedure; they were therefore able to eliminate demand characteristics as an explanation for their results. If the role-playing and real participants had responded similarly, there would have been no way for Alloy et al. to tell whether the differences between the mood induction group and a neutral mood control group were due to the induced mood or to demand characteristics.
Measurement of the dependent variable. Demand characteristics are tied to the hypothesis of a study as perceived by the participants. Thus, if people believe their participation in a study has ended, demand characteristics are unlikely to affect their behavior. Therefore, if a dependent variable is measured outside the context of a study, any demand characteristics induced by the study should have no effect. Take, for example, a classic study in social psychology conducted by Festinger and Carlsmith (1959). After the researcher told college student participants their session of the study had ended, he sent them to a secretary who gave them a questionnaire to complete that assessed the participants’ reactions to the study, such as how interesting they had found it. Responses to this variable were of great interest to the researchers, but because every participant in every psychology study conducted at the college completed the same questionnaire, it was unlikely that the participants would think the questionnaire was part of the study; consequently, their responses were unlikely to be influenced by demand characteristics. However, because this procedure involves deception—people are led to believe that their participation in the study is over and that their responses to the questionnaire are not part of the study—it should be used only when the study meets the criteria for permissible deception.
In the early 1900s, Germans were amazed by the phenomenon of a horse named Clever Hans, who could do arithmetic and other amazing feats. Hans’s owner would select members of an audience to pose simple arithmetic problems to Hans, who would then correctly answer them by stomping his hoof the proper number of times. How could a horse do arithmetic? Pfungst, (1904/1965) provided an answer by conducting an experiment in which Hans had to do arithmetic when neither Hans’s owner nor anyone in the audience knew the answer to the problem. Under these conditions, Hans’s mathematical ability disappeared. Apparently, Hans’s owner and the person posing the question (who, of course, knew the answer) would change their postures, such as by leaning forward, when Hans reached the correct number of hoof taps. Because Hans could perceive these changes and was rewarded for each correct answer, he had learned to stop tapping when people’s postures changed. In essence, the questioners’ expectation that Hans would stop tapping when he reached the correct answer affected their behavior, which in turn affected Hans’s behavior so that he appeared to give the correct answer.
Rosenthal (1976) noted that the same phenomenon could occur in the laboratory and named them experimenter expectancy effects. Experimenters’ expectancies about how participants should perform on the research task could affect the way they behaved toward research participants; their behavior could then affect the participants’ responses to the research task, biasing the data. There are two possible sources of experimenter expectancies. One is the research hypothesis: Experimenters generally expect to find data that support it. The second source of expectancies is the data collected early in a research project: If a pattern is apparent in early data, experimenters generally expect later data to be consistent with that pattern. Rosenthal proposed two mechanisms by which experimenter expectancies could affect the data they collect: biased observation and influencing participant behavior.
Biased observation. As noted in the discussion of case study research in Chapter 2, observer expectations about what they would find could affect their interpretation of what they observe. These interpretations are in the direction of the expectation. Rosenthal (1976) noted that the same phenomenon can occur in laboratory research when experimenters collect data by recording their observations of participant behavior. For example, in one study researchers observed the behavior of flatworms. Half the observers were told that the worms came from a high-response genetic strain and would show a great deal of movement; the other observers were told that their worms came from a low-response strain and would show little movement. Although all the worms came from the same genetic strain, the observers who expected a high degree of response reported more movement than those expecting a low degree of response.
Influencing participants’ responses. Rosenthal (1976) noted that experimenters’ expectancies could also influence participants’ responses. In one set of studies, experimenters were asked to elicit participants’ ratings of the physical attractiveness of the people shown in ten photographs. Half the experimenters were told to expect high ratings; the others were told to expect low ratings. In fact, the photographs had been selected because a previous group of research participants had rated the people in them as being average in physical attractiveness. The participants whose experimenters expected high ratings gave higher ratings than those whose experimenters expected low ratings.
There are three possible mechanisms by which experimenter expectancies could affect participants’ responses (Barber, 1976; Rosenthal, 1976). First, experimenters might introduce variations into the research procedures, treating experimental and control participants differently, and so inducing differences in response. Second, experimenters might give nonverbal feedback to participants about “right” and “wrong” responses. Like Clever Hans’s questioners, they might change their postures or facial expressions, perhaps rewarding “correct” responses with a smile and “incorrect” responses with a frown. Participants high in evaluation apprehension might be especially sensitive to such cues. Finally, experimenters might give verbal feedback, muttering “good” or “uh-huh” when they get the response they expect. This feedback could let participants know what responses were expected of them. It is important to note that the general presumption is that when experimenters do these things, they do them without being aware of their behavior. These are unconscious behaviors, not attempts at intentional bias. Researchers can, of course, intentionally bias their data to get the results they want (see Chapter 4).
Aronson et al. (1990) and Rosenthal and Rosnow (1991) discuss a number of steps one can take to control the effects of experimenter expectancies. Four of the most common are rehearsal and monitoring of experimenters, minimizing the experimenter’s role, condition masking, and avoidance of data snooping.
Rehearsal and monitoring. Because variations in experimenter behavior between the experimental and control conditions can affect participant response, precautions should be taken to minimize these variations. It is therefore very important to provide experimenters with a detailed script for their interactions with participants and to rehearse experimenters until they can follow the script flawlessly and consistently. If possible, also monitor experimenters’ behavior while they are collecting data to ensure that their responses don’t change over time.
Minimizing the experimenter’s role. Experimenters’ expectancies can affect data only to the extent that the experimenter is involved in data collection or interacts with participants. Therefore, the less experimenters do, the less effect their expectancies can have. For example, if the dependent variable is measured by self-report, the experimenter’s expectancies cannot bias data recording.
The effects of experimenter expectancies on participant behavior can be reduced by minimizing the experimenter’s contact with participants. As Aronson et al. (1990) note, some researchers have removed the experimenter entirely from the experiment. The experimenter brings participants to a room and leaves them alone. Instructions are provided by a digital recording or a written instruction booklet. Experimenters are increasingly using online data collection, through programs such as Survey Monkey; these programs also provide instructions remotely. However, Aronson et al. note that providing instructions remotely may result in a loss of important information. That is,
in attempting to convey a set of instructions to a subject in a face-to-face interaction, the experimenter may come to realize that these instructions are not viable: there is nothing quite like a yawn in the face to convince the experimenter that the instructions are dull and unmotivating. If the instructions are presented on a tape recording, the experimenter might never see the yawn and might run the whole experiment without realizing that the subjects are totally indifferent to the treatment. (Aronson et al., 1990, p. 238)
One solution is to pilot the instructions in a face-to-face setting and solicit feedback about their clarity and about whether they secure participants’ interest.
Condition masking. Perhaps the most widely used control for experimenter expectancy effects is condition masking: The experimenter does not know whether any particular participant is in the experimental or control condition when data are collected. Because the experimenter does not know which condition participants are in, his or her expectancies about how participants should behave in the different conditions cannot affect their responses. Carrying out research that uses this technique can be procedurally complex, often requiring two experimenters. One experimenter works with participants through the manipulation of the independent variable. The other experimenter, who does not know whether the participant is in the experimental or control condition, then takes over and measures the dependent variable. Despite this complexity, there is consensus that condition masking is the best available control for experimenter expectancy effects (Greenberg & Folger, 1988).
Avoidance of data snooping. The term data snooping refers to analyzing data collected before a study is completed “to see what’s happening.” If these analyses show a particular pattern of results, such as support for the research hypothesis, then this pattern could establish an experimenter expectancy for the data still to be collected. Researchers should therefore resist the temptation to data-snoop. However, as discussed in Chapter 16, it is a good and often necessary practice to conduct pilot studies to test experimental procedures. The results of pilot studies can also establish expectancies about the outcome of the main study, so the experimenters who collect the data for the main study should be kept unaware of pilot results until they have finished collecting their data.
Many factors can influence the internal validity of research. Internal validity represents the degree of confidence we can have that the independent variable, rather than some other factor in the research situation, affected the dependent variable. Five categories of factors can threaten the internal validity of research: confounding, time-related and selection threats, reactivity, demand characteristics, and experimenter expectancies.
A confound exists when two variables are combined so that the effect of one cannot be separated from the effect of the other. A treatment confound occurs when the operational definition of the independent variable manipulates two hypothetical constructs simultaneously. A measurement confound occurs when a measure assesses two constructs simultaneously. Some confounds are considered natural because they reflect naturally occurring combinations of variables.
Campbell and Stanley (1963) identified several potential threats to the internal validity of research. A history threat occurs when an event outside the research affects the dependent variable. The term maturation refers to natural change over time. A testing confound occurs when taking a pretest affects scores on the posttest. Instrumentation change occurs when a measuring instrument changes over time, resulting in artificial changes in what it measures. Statistical regression can occur when participants are selected for research because they have extreme scores on the dependent variable; the random error that contributed to the initial extreme score makes it likely that the score will be closer to the mean at a second assessment. The presence and magnitude of these effects can be assessed in pretest-posttest research through the use of a control group. A selection confound occurs when participants assigned to the experimental and control groups of a study have different characteristics. Selection confounds can result from nonrandom assignment of participants to conditions, from the use of preexisting groups, and from mortality.
Reactivity occurs when the act of measuring a variable affects the score on the measure. Reactivity can result from evaluation apprehension or novelty effects. The effects of reactivity can be reduced by alleviating evaluation apprehension—such as by putting participants at ease—by providing participants with an engaging task, by covert measurement of the dependent variable, and by having participants respond anonymously to questionnaires. Novelty effects can be reduced by allowing people time to adjust to the novel aspects of the situation and by covert observation.
Demand characteristics are factors in the research situation that provide participants with cues to the hypothesis being tested. Once aware of the hypothesis, a participant might take on any of three roles. The good participant tries to “help” the researcher by providing data that will confirm the hypothesis, the negative participant tries to provide data that will disconfirm the hypothesis, and the apathetic participant responds in essentially a random manner. The effects of demand characteristics can be minimized by reducing cues to the hypothesis, motivating participants to avoid enacting roles that threaten internal validity, establishing role-play control groups to estimate the effects of demand characteristics, and separating the dependent variable from the study.
Experimenters’ expectancies about the outcome of a study can threaten the internal validity of the study. Experimenter expectancies can lead to biased observations and can influence participants’ behavior. The effects of experimenter expectancies can be reduced by rehearsing experimenters and monitoring their performance, minimizing experimenter contact with participants, keeping experimenters unaware of whether a participant is a member of the experimental or control group, and resisting the temptation to data-snoop.
Despite the fairly large number of potential threats to the internal validity of research, there are a number of steps you can take to control or reduce these threats. These steps are shown in Box 7.2.
• |
Avoid treatment confounds by ensuring that all participants have exactly the same experience in exactly the same environment except for differences that are part of the independent variable. |
• |
Avoid measurement confounds by using only measures that are high in discriminant validity. |
• |
Always use a control group in pretest-posttest research. |
• |
Be alert for history effects in cross-sectional research. |
• |
Be alert for mortality effects. Always check experimental and control groups for differential mortality. |
• |
Measure variables under conditions that minimize reactivity. |
• |
Be aware that cultural factors may influences participants’ responses and may result in some groups being subject to greater evaluation apprehension. |
• |
When collecting data with questionnaires, conduct a pilot study to determine if context effects could be a problem. |
• |
Be alert for demand characteristics in your procedures. Use role-play control groups when you cannot avoid high-demand procedures. |
• |
When observers code behaviors, use low inference coding systems to minimize expectancy effects. |
• |
Thoroughly train and rehearse experimenters for their interactions with participants. Monitor their performance throughout data collection. |
• |
Whenever possible, keep experimenters unaware of the condition that participants are in when the experimenters measure the dependent variable. |
• |
Avoid data snooping, and whenever possible do not tell experimenters about the results of pilot studies. |
Cook, T. D., & Campbell, D. T. (1979). Quasi-experimentation. Chicago: Rand-McNally.
In Chapter 2 of this classic book, Cook and Campbell describe in detail the threats to internal validity that we review in this chapter and discuss when those threats can and cannot be ruled out. In Chapter 3, they review experimental designs that do and do not permit causal inferences.
Huck, S. W., & Sandler, H. M. (1979). Rival hypotheses: Alternative interpretation of data based conclusions.
New York: Harper Collins.
Using the presentation style of a puzzle book, this classic volume provides 100 examples of studies that used flawed research designs. The authors encourage the reader not to peak at the solutions and to think beyond the named threats to validity covered in our chapter. The authors include a list of exercises by topic, such as advertising, personality, and developmental psychology.
Rosenthal, R., & Rosnow, R. L. (2009). Artifacts in behavioral research: Robert Rosenthal and Ralph L. Rosnow’s classic books. New York: Oxford.
As the title suggests, this book brings together and reprints these authors’ highly influential books: Artifact in behavioral research, Experimenter effects in behavioral research, and The volunteer subject. As Alan Kazdin notes in his forward to the volume, the 50 year collaboration of these two authors has produced “a remarkable body of work that has fallen out of print” (p. v). This volume makes their contributions widely available again.
Artifact
Condition masking
Confound
Demand characteristics
Evaluation apprehension
Experimenter expectancy effects
Extraneous variables
History
Instrumentation change
Internal validity
Maturation
Mortality
Novelty effects
Participant roles
Reactivity
Selection bias
Statistical regression
Testing confound
1. |
How can you rule out alternative explanations for the effect of an independent variable? |
2. |
How are treatment and measurement confounds similar? In what ways are they different? What is a natural confound? What implications do measurement confounds and natural confounds have for the design and interpretation of research? |
Describe the time-related threats to internal validity, including the effects they have on pretest-posttest research and on cross-sectional research in which data are collected over a period of time. How does a control group control for these effects in pretest-posttest research? |
|
4. |
Describe the types of selection biases. How can these biases be controlled? What are the advantages and disadvantages of these procedures? What implications does the problem of selection biases have for interpreting longitudinal research and research that uses preexisting groups for its experimental and control conditions? |
5. |
Describe the effects of evaluation apprehension and novelty on research participants. What steps can you take to control those effects? What are advantages and disadvantages of those steps? |
6. |
Describe the sources of demand characteristics in research. What roles can participants take in research? What motivational factor is associated with each role? Describe the means for controlling demand characteristics. What are the advantages and disadvantages of those means? |
7. |
How can experimenters’ expectancies about the outcome of research affect the data collected in the research? How can experimenter expectancy effects be controlled? Describe the advantages and disadvantages of these control measures. |
8. |
Huck and Sandler (1979) present summaries of studies that illustrate the various kinds of internal validity problems. Get a copy of their book from your library, and practice your ability to identify internal validity problems by working through some of their examples. |
9. |
This chapter has focused on the problems involved in designing internally valid research. Given these problems, do you think it is possible for behavioral science to generate valid knowledge about human behavior? Why or why not? |