The Role of Single-Case Research in Psychology
Current Status of Single-Case Research
Objections to single-case research
Validity Criteria in Single-Case Research
Multiple sources of information
Search for disconfirming evidence
Designs for Single-Case Experiments
The simultaneous treatments design
The Importance of a Stable Baseline
What constitutes a stable baseline?
Data Analysis in Single-Case Research
Suggestions for Further Reading
Questions for Review and Discussion
As we discussed in Chapter 2, the single-case research strategy makes an intensive study of a single person, group, organization, or culture. Single-case research can take the form of either a case study or a single-case experiment. Both forms of research focus on a single instance of the phenomenon under study. However, case study research usually focuses on an event in an unconstrained natural context, whereas the single-case experiment is usually carried out in a more controlled environment with the researcher manipulating the independent variable. In this chapter, we review the role of single-case research in psychology, examine the factors that affect the validity of the conclusions that one can draw from single-case research, discuss some of the factors that influence the design of case studies and single-participant experiments, and conclude with a look at how data from single-case research are analyzed.
Although many areas of behavioral science, such as sociology, anthropology, educational research, and organizational research, have made considerable use of the single-case research strategy, it has long been out of favor in most areas of psychology. As a prelude to a general discussion of single-case research, in this section we provide a brief history of single-case research in psychology, present some of the objections made to its use by many experimental psychologists, and discuss the ways in which single-case research can be useful to researchers.
Psychological research today is dominated by the group comparison approach exemplified by experimental and correlational research strategies. This approach defines psychological knowledge in terms of the average behavior of groups of people (the nomothetic perspective) rather than on patterns of individual behavior (the idiographic approach). In sharp contrast, the founders of psychological research in the last half of the 19th century, such as Ebbinghaus, Hall, and Wundt, studied individual behavior (Barlow, Nock, & Hersen, 2009; Danziger, 1990). Reports of psychological research published at that time listed the data for individual research participants rather than the mean scores that one finds today, and often identified the participants by name.
In addition, the research frequently included repeated measurement of the phenomena of interest to document individual change over time. In their history of trends in psychological research, Barlow et al. (2009) note that in the early 20th century researchers began to change their focus to the average behavior of groups of people. This change came as a result of the emergence of the field of mental measurement, which required the determination of population average scores on measures so that people could be assessed relative to that average. The psychological testing movement spurred the development of descriptive statistics, including correlational methods, in the first quarter of the 20th century. The group focus became the norm with the development of modern inferential statistics in the 1920s and 1930s.
These statistical procedures allowed researchers to compare the average scores of groups of people—both naturally occurring groups such as women and men and groups formed for experimental research—and provided relatively objective tools for deciding if differences found between groups were real or due to chance: the statistical significance criterion. While these changes were taking place, some psychologists retained their focus on the individual. Many researchers who conducted experiments on sensory and perceptual processes continued to analyze data from individual research participants and some clinical psychologists conducted treatment research by means of uncontrolled case studies. However, unlike experimental research that focused on individual behavior, these case studies did not specify the operational definitions of variables and took no steps to avoid the confounding of variables. These problems, coupled with a tendency for case study researchers to make exaggerated claims on the basis of limited evidence, brought the case study methodology into disrepute.
By the 1940s and 1950s, however, clinical psychologists’ training began to include more background in research methodology, leading to greater emphasis on control in clinical research. Because the group comparison approach was the model for well-controlled psychological research, clinical research shifted to that model. However, by the 1960s, disenchantment with the approach began to set in. Three major objections developed to the use of group comparison methods in clinical research (Barlow et al., 2009). First, questions were raised about the ethics of withholding or delaying treatment for members of no-treatment control groups. Second, for some diagnoses it was often impossible to find the relatively large number of patients required for group comparison research. Finally, the individual became lost in the group average. Clinical practice focuses on the individual, so some practitioners began to ignore group-based clinical research, which they saw as irrelevant to their needs. In addition, clinicians are interested in patterns of change over time, and group comparison research rarely takes a longitudinal approach.
This disenchantment led, in the 1960s and 1970s, to a renewed interest in single-case research and in the development of criteria for well-controlled case studies and single-case experiments (Barlow et al., 2009; Kazdin, 2011); this process continues today. To a large extent, these developments have taken place in the context of the behaviorist school of psychology, especially in the fields of behavior therapy, behavior modification, and applied behavior analysis. Consequently, most single-case experiments deal with the behavioral treatment of clinical disorders and emphasize behavioral observation as a measurement modality. However, as we noted in Chapter 2, the single-case research strategy can be applied to other areas of psychology, such as cognition, human development, organizational behavior, and group processes, and it can be used with other measurement modalities, such as self-report and physiological measures (see, for example, Barlow et al., 2009; Yin, 2004, 2009).
The use of single-case research is on the rise, especially in evaluation research (Yin, 2009). Nonetheless, the validity of the strategy is still being debated, with opponents emphasizing its weaknesses and supporters emphasizing its strengths. Before discussing the conduct of single-case research, let’s review some of these points, which we discussed in more detail in Chapter 2.
Objections to single-case research. The relative unpopularity of single-case research in psychology is probably due to three problems commonly attributed to the strategy by researchers trained in the group comparison tradition (Yin, 2009). Both case study research and single-case experiments are perceived as exhibiting a lack of generalizability. The argument is that it is impossible to generalize from a single case to people in general. However, as Barlow et al. (2009) and Yin (2009) point out, and as we discussed in Chapter 8, use of the experimental or correlational strategy provides no guarantee of generalizability. Generalizability comes from replication, and the generalizability of single-case research can be tested through replication just as can the generalizability of research based on other strategies. Three other criticisms are leveled specifically at case study research. The first is that case study research lacks rigor, that it is too uncontrolled. Although many published case studies have been poorly controlled, leaving room for alternative explanations for their findings, controls can be instituted that enhance the internal validity of case study research (Kratochwill, Mott, & Dodson, 1984). A second criticism is that case studies can be used only for exploratory or hypothesis developmental purposes and cannot explain how or why an outcome occurred (Yin, 2009). However, Yin (2004) provides several examples of case studies that both describe and explain an outcome. The third criticism of case study research is that it takes too long to conduct. Although anthropological studies of whole cultures can take years, other case study research is not necessarily so time consuming. In addition, one advantage of the case study is its ability to provide a longitudinal, in-depth analysis of a phenomenon.
Uses of single-case research. Single-case research can play an important role in the development of psychological knowledge. As we have already noted, the single-case research strategy is a necessity for idiographic research and is often the only tool available for studying rare phenomena. It can also provide great depth of understanding through its longitudinal approach to data collection. Case studies are especially useful in providing in-depth information because they frequently take into account the environmental, social, and historical contexts of the behavior being studied and make use of data sources, such as records, documents, and interviews, not usually included in other types of research. Single cases can also show the limitations of theories by bringing to light cases that contradict general theoretical propositions. Finally, even relatively uncontrolled case studies can provide hypotheses for testing in more controlled research strategies and can bring to light previously undiscovered phenomena.
As we noted earlier, case study research has long been perceived to be sloppy and lacking in control, and so to be of minimal value as a source of useful information about human behavior and psychological processes. In addition, Kazdin (2011) points out that singlecase research is especially vulnerable to the internal validity threats of history and maturation because of its longitudinal nature and its usual lack of a control condition to assess these types of changes. Clinical research is also vulnerable to statistical regression because it often deals with extreme cases. However, many problems associated with single-case research can be rectified if researchers plan their studies carefully. Fifteen criteria, which can be divided into the five categories shown in Table 13.1, can be used to evaluate the internal validity of case studies and single-case experiments (Kratochwill & Levin, 1992; Kratochwill et al., 1984; Yin, 2009). As noted in the table, several of these criteria are present in all single-case experiments. The criteria emphasize the impact and breadth of the effect of an intervention as means of ruling out chance effects and confounds as explanations for changes in the dependent variables.
Validity Criteria for Single-Case Research
|
Criterion |
Lower Validity |
Higher Validity |
Measurement Criteria |
Objectivity |
Subjective |
Objective* |
|
Dependent variables |
One |
Multiple |
|
Sources of information |
One |
Multiple |
|
Assessments |
Two |
Frequent* |
Replication Criteria |
Number |
None |
Multiple |
|
Cases |
Homogenous |
Heterogeneous |
Control Criteria |
Baseline case or observation |
None |
Multiple |
|
Control for specific alternative |
None |
Multiple |
|
explanations |
|
|
Impact Criteria |
Problem type |
Acute |
Chronic |
|
Magnitude |
Small |
Large |
|
Timing |
Delayed |
Immediate |
|
Follow-ups |
None |
Multiple |
Treatment Criteria |
Degree of control |
None/observed |
Manipulated* |
|
Standardization |
Low |
High* |
|
Implementation |
No monitoring |
Frequent monitoring |
*Present in all single-case experiments.
Note: Adapted from Kratochwill, Mott, and Dodson, 1984, p. 62.
As in all forms of research, proper measurement is essential to the validity of single-case research. Four measurement criteria for validity are objectivity of measurement, use of multiple dependent variables, use of multiple sources of information for the dependent variables, and frequent assessment of the dependent variables.
Objectivity. Kratochwill et al. (1984) and Yin (2009) note that a major shortcoming of much case study research is the use of informal, subjective data, such as the researcher’s impressions of the effect of an independent variable, rather than more formal, objective measures of the dependent variable. As we noted in Chapter 5, formal measures help researchers avoid the problem of observer bias and can be tested for reliability and validity. Measurement validity can be enhanced by the use of multiple dependent variables, multiple measures of each variable, and frequent assessment of the variables.
Multiple dependent variables. One indicator of the breadth of an effect is the number of dependent variables affected by it. If the researcher measures only one outcome and finds an apparent effect, that effect could be the result of chance factors or a confound. However, if a number of dependent variables all change in the manner predicted by the theory on which the research is based, then it becomes less likely all the changes were due to chance or confounds. Most theories predict relatively broad effects for their independent variables. Hackman and Oldham’s (1980) theory of work design, for example, holds that the more skills a job requires, the extent to which a worker does a complete task rather than just part of it, the more important the task, the more independence the worker has, and the more feedback the worker has on the quality of the work, the higher will be work motivation, job satisfaction, and work effectiveness. A case study test of an implementation of the theory could therefore assess three dependent variables, two of which are psychological states and the third of which is behavioral.
Multiple sources of information. The single-case researcher should try to use as many sources of information as possible for each dependent variable (Yin, 2009). McKee et al. (2009) conducted a case study of football players whose untimely deaths appeared to be related to neurological deterioration stemming from repeated brain trauma when they were active players. The researchers’ analysis included variables such as number of years of play and age of symptom onset, as well as the presence of early indicators of brain damage, such as mood disorders and memory loss. They also verified the actual brain damage using autopsies. It is also sometimes possible to get information about an individual from several people who have opportunities to observe the person. Ollendick (1981), for example, studied the effectiveness of a treatment for reducing the occurrence of a child’s tics by having both the child’s mother and teacher keep records of occurrences. However, researchers should be careful to ensure that all informants are unbiased and are providing reliable assessments (Achenbach, 2006). Official records can also be a source of information. For example, businesses keep records of costs, productivity, and rates of employee turnover and absences; the first two provide direct indicators of work effectiveness, and the last two can be used as indirect indicators of job satisfaction and motivation. Artifacts—things that people produce either intentionally or unintentionally—can provide physical evidence of the effect of an independent variable. For example, wastage of raw materials is a negative indicator of work effectiveness in manufacturing: the more waste, the less effective the work. Finally, documents other than official records, such as letters, news reports, even graffiti, can be a source of information. Graffiti, for example, could be used as an indicator of the level of morale in a factory. Personal documents, such as letters, diaries, or blogs offer a snapshot of everyday life in a specific time period. As we noted in Chapter 6 in the discussion of multiple operationism, the more sources of evidence that are available about the effect of an independent variable and the greater the extent to which the different sources of evidence lead to the same conclusion, the more confidence we can have in the conclusions drawn from the research.
Frequent assessment. Finally, the more often the dependent variable is assessed during the research, the easier it is to rule out some alternative explanations. For example, if assessments are made only at the beginning and end of a study, then history or maturation could account for any changes observed over the course of the study. However, if the study concerns an intervention, then assessments can be made before the intervention, during the course of the intervention, and following the intervention. Such continuous data collection allows you to determine if change is associated with the onset of the intervention, thus reducing the likelihood of a history confound. The data also allow assessment of the impact criteria described below, helping to rule out maturation as an alternative explanation. The use of continuous assessment requires careful selection of sources of information. Highly intrusive measures, such as questionnaires and physiological measures, might induce reactivity that could threaten the validity of the study. Consequently, observations and records might be better suited as sources of information for more frequent assessments.
In Chapter 5, we showed that replication is an important tool in research, helping to determine the generalizability and limits of research findings. Replication cases should be as different from each other as possible (heterogeneous) rather than similar to each other (homogeneous; Kratochwill et al., 1984). Successful replication across a diverse set of cases demonstrates the robustness of a phenomenon, and failures to replicate can be compared to successful replications to determine the boundary conditions of a phenomenon. Research on the success of an educational innovation, for example, might include urban, suburban, and rural schools to determine if the innovation is effective for different populations of children. Clinical research would seek heterogeneity on both patient variables, such as sex, ethnicity, and socioeconomic status, and therapist variables, such as level of experience. To the extent that the hypothesis is supported across these variations in case characteristics, the results are more generalizable.
Replicated Case Study Research.
Cases are selected to test the generalizability of findings.
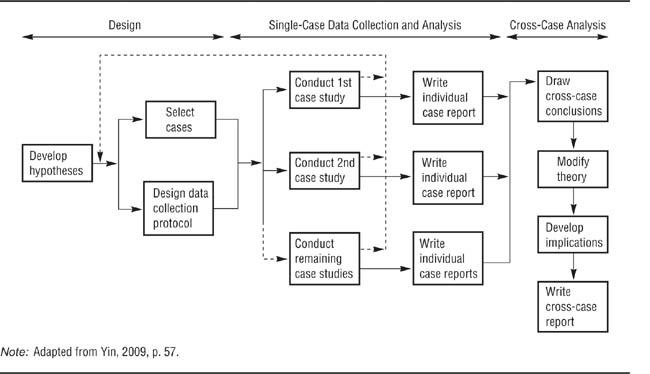
Yin (2009) has developed a model for replicated case study research, shown in Figure 13.1, that can also be applied to single-case experiments. Following the model discussed in Chapter 5, researchers use theory to develop a set of hypotheses. These hypotheses provide a basis for selecting cases that can provide data to test them and a basis for determining the dependent variables to use and the best sources of information for each dependent variable. The researchers then conduct the case studies and write up the results for each study. Finally, the researchers compare the results across the cases to draw conclusions about the hypothesis and to determine the implications of those conclusions for theory and application.
A major objection to case study research is that it is impossible to assess the impact of an independent variable because there is no control or comparison condition to use as a baseline.
However, as Yin (2009) points out, a situation analogous to the experimental and control conditions of experimental research can be achieved by including both test cases and control cases in case study research. A test case, like the experimental condition in an experiment, allows the researcher to observe what happens when the independent variable is present and so could have an effect on the dependent variable. A control case, like the control condition in an experiment, allows the researcher to observe what happens in the absence of the independent variable. A comparison of the two types of cases helps rule out many threats to internal validity, as does the comparison of the experimental to the control condition in an experiment. Just as a complete test of a hypothesis in experimental research might require more than one control group, so might case study research require more than one control case.
Yin (1994) gives the example of a case study test of the hypothesis that when computers are used in school districts for both administrative and instructional purposes, then the overall rate of computer usage will increase, but that the use of computers for either purpose alone will have no effect. As shown in Table 13.2, a complete test of this hypothesis requires that at least three cases be compared: one in which computers are used for both administrative and instructional purposes, one in which computers are used for administration only, and one in which computers are used for instruction only. Only if all three predictions shown in Table 13.2 are borne out will the hypothesis be fully supported.
TABLE 13.2
Use of Replication in Case Study Research to Test a Hypothesis
Hypothesis: Joint instructional and administrative use of computers in a school district leads to increasing use of computers over time. | ||
Case |
Role in Study |
Prediction |
Joint use of computers |
Test case |
Increase in computer use |
Administrative use only |
Control case |
No increase in computer use |
Instructional use only |
Control case |
No increase in computer use |
Note: Based on Yin, 1994.
Control cases can also help the researcher discriminate among possible explanations for a phenomenon. For example, Szanton (1981) studied attempts by university-based and non-university groups to help cities deal with urban problems. One set of studies demonstrated that university-based groups were unable to help cities solve a variety of problems. A second set of studies showed that non-university-based groups also failed to help cities, demonstrating that the failures in the first group of cases were probably not due to the academic location of the advisers. A third set of studies showed that university groups had been successful in helping private enterprise, demonstrating that university-based advisers could be successful. A final group of studies dealt with university groups that had been successful in advising cities, comparing these cases to the failure cases to identify boundary conditions that limit the success of university-based advice to city governments.
It is important to bear in mind that the use of control cases is not always desirable. For example, the use of control cases in clinical research raises the same ethical concerns as the use of no-treatment control groups that we discussed in Chapter 3. In both situations, the researcher must carefully weigh the value of the knowledge to be gained from a control condition or case against the potential harm that could arise from leaving a problem untreated.
In treatment-outcome research, the magnitude of the impact that a treatment has is an indicator of the degree to which history, maturation, and statistical regression might be threats to the validity of the research (Kazdin, 2011): The greater the impact of a treatment, the less likely the change is due to these factors. Kratochwill et al. (1984) list three indicators of impact. A treatment is more likely to be the cause of a change in a chronic problem than an acute problem. Chronicity is itself an indicator that maturation is not affecting the problem, because the problem has not ameliorated over time without intervention. A large impact is more indicative of possible causality than is a small impact because statistical regression is more likely to bring about a small apparent change than a large apparent change. A treatment that has an immediate impact is more likely to be valid than one that has a delayed impact because it is unlikely that a historical event was coincident with the treatment (a possibility that can be further checked through replication), and maturation effects tend to appear in the form of gradual change over time rather than immediate change.
The impact of a treatment can also be tested through follow-up assessments. The effects of many treatments are expected to endure after the treatment itself has been terminated. The longer the effects of the treatment remain and the greater the long-term effects of the treatment, the more effective the treatment is.
Three aspects of the treatment can affect the validity of intervention research (Kratochwill et al., 1984). The first aspect is the degree of control that the researcher has over the treatment. In the ideal case, the researcher can manipulate the treatment as the independent variable in a single-case experiment; in other cases, the researcher can only observe what happens when a treatment occurs naturally. For example, clinical researchers might be able to decide exactly when treatment will start for a patient and, in a complex treatment program, exactly when each phase of the program will begin. Controlling the onset of treatment allows researchers to establish a pretreatment baseline against which to compare changes in the dependent variable. Second, treatments should be standardized as much as possible. That is, a specific treatment plan should be developed that adheres exactly to the theory whose propositions are being tested. For example, an organizational intervention based on Hackman and Oldham’s (1980) theory of job design must be carefully planned so that all the elements the theory holds to be essential for success are included. Such detailed plans (also called protocols) also allow other researchers to replicate the research exactly.
Finally, researchers must ensure that the treatment is implemented exactly as described in the protocol. Implementation failures are special risks when the treatment is carried out by people other than the researchers. Therapists implementing a test protocol in a clinic, for example, might deviate from the protocol without realizing it if the protocol requires them to do things that they are not used to doing. In organizations, people might resist the implementation of programs that they do not agree with or perceive as threats to their positions in the organization. Researchers must therefore carefully monitor the implementation of the treatment plan to ensure that the treatments given match the treatment plan and are therefore in accordance with the theory being tested. Treatments that deviate from the protocol do not provide a valid test of the theory being investigated.
When researchers are careful to meet these measurement, control, replication, impact, and treatment criteria, high-validity single-case research is an achievable objective. Let’s now see how these criteria can be operationalized in case studies and single-case experiments.
Yin (2009) notes that the case study is, perhaps, the most difficult type of research to define. This difficulty arises because case studies can be used for a number of purposes. One purpose is descriptive, providing a narrative, detailed description of the events that take place in a situation. For example, Kidder (1981) described how a group of engineers invented and developed a new computer. A major focus of Kidder’s work was on the interpersonal dynamics of the design team and how pressures from other parts of the organization, such as the marketing department, affected the design process. Other case studies are explanatory, testing the effectiveness of theories and models as explanations of events. Janis (1972), for example, compared the group processes involved in good and bad political decisions as a means of testing a theory of decision making. Finally, evaluation case studies, perhaps the type most commonly used in psychology, assess the effectiveness of a clinical or other intervention. This section reviews factors to consider in choosing the cases to include in a case study research project and some issues to consider in collecting case study data. Yin (2009) provides a detailed outline of how to conduct case study research.
With the validity criteria just described in mind, the researcher can evaluate potential cases to include in a case study research project.
Select for validity. As we discussed in Chapter 5, it is impossible to conduct a perfect piece of research because it is impossible to meet all the criteria necessary for perfection simultaneously; one must make tradeoffs among the criteria. Let’s examine a few of the issues that can arise in trying to balance the demands of the validity criteria of case study research.
Ideally, the researcher wants to manipulate the independent variable, even in case study research. One criterion for choosing cases, then, is to look for situations in which it is possible to do so. For example, in a clinical or organizational intervention, the intervention is the manipulated independent variable. If the nature of the research makes manipulation impossible, then test cases must be chosen that represent the presence of the independent variable as you would have operationally defined it if you had been able to manipulate it. That is, you decide on your operational definition of the independent variable before choosing cases and use only those cases that match the operational definition. If no cases can be found that represent an exact match with the operational definition of the independent variable, then you must decide if any cases are reasonably close to the ideal operational definition. You can then choose the best-fitting cases from among those, but you must also take into account any effects of not having an exact operational definition of the independent variable. For example, the operational definition you end up using might not completely fit the operational definition implied by the theory that you are testing. In that case, you must take the difference in operational definitions into account when deciding what implications your results have for the theory.
As we noted earlier, heterogeneity of cases helps in determining the generalizability of the results of case study research and so should be a criterion for choosing replication cases. However, when the research includes control cases, be careful to ensure that each test case has a control case as similar to it as possible. The less well the test and control cases match on extraneous variables, the more plausible extraneous variables become as alternative explanations for any differences between cases. Therefore, seek heterogeneity among test cases, but match each test case with a similar control case.
A final consideration in selecting cases is access or the opportunity to collect data. Cases selected for research should allow the opportunity for continuous assessment, the use of multiple sources of information, and appropriate follow-ups. Regardless of how ideal a case seems to be on other characteristics, one that does not allow for proper data collection is of minimum usefulness.
Units of analysis. It is frequently possible to view behavior as being carried on at more than one level of aggregation. For example, in studying group decision making you can focus either on the decisions made by the group as a unit or on the decisions made by the individual group members who contributed to the group decision. One example of this process is a jury’s verdict, which is a single group-level decision based on 12 individual decisions. When studying behavior that can be viewed in terms of more than one level of aggregation, the researcher must decide on the level or levels at which to collect data. For example, should one study the collective decision of a jury or the individual decisions of its members? The answer to this question, which is based on the goals of the research, indicates the unit of analysis for the study: the level of aggregation at which data are to be collected (Yin, 2009).
In experimental and correlational research, the individual research participant is usually the unit of analysis. When a case study focuses on a single person, that person is the unit of analysis. However, if the research is conducted in a group or organizational context, there may be many possible units of analysis. For example, a case study of a labor union could focus on the union as a whole, on one of its locals, on the workers in a company represented by the local, on work groups within the company, or on individuals within work groups. Choice of the unit of analysis should be driven by the research question or hypothesis: What unit does the question deal with? For example, Smith and Kleinman (1989) wanted to determine the strategies that medical students used to deal with forms of stress peculiar to their studies. Some of these stresses stemmed from having to handle cadavers in their human anatomy lab, which violates the social norm that prohibits people from touching the unclothed bodies of strangers. They conducted their research with members of medical school classes. However, their unit of analysis was not the class as a group but, rather, the individual students in the class about whom and from whom they collected data. As Yin (2009) notes, if you cannot readily identify the appropriate unit of analysis for your study, your research question likely needs to be narrowed or otherwise more clearly defined.
In addition to focusing on a single unit of analysis, it is sometimes possible to conduct an embedded case study, which deals with the same question or hypothesis for different units of analysis, comparing results across units. For example, one could study the processes by which individual jurors make guilty-or-not-guilty decisions and the processes by which those individual decisions lead to a verdict by the jury as a whole. However, it might not be feasible to conduct an embedded case study even when it might be desirable. For example, Smith and Kleinman (1989) found it was not possible to study group processes that help people to deal with stress—such as social support—among the medical students they studied because a social norm existed that forbade students and faculty from discussing the students’ emotional responses to their medical school experiences.
Regardless of the research strategy you use, you must take great care in collecting your data to ensure its validity. This principle is especially true for case study research. If you have access to large numbers of research participants, as is often true of experimental and correlational research, it is fairly easy to restart data collection if a problem develops. In case study research, however, you may have only one opportunity to collect data and so must make the most of it. You must therefore plan the research carefully, actively search for data that might disconfirm your hypotheses, and maintain a chain of empirical evidence to support the conclusions you draw.
Plan carefully. To maximize the validity of your data, you must formulate a data collection plan well before data collection begins. This plan should include the dependent variables that will be used, the operational definitions for each variable, and the sources of information for each operational definition. Table 13.3 shows an excerpt from a hypothetical collection plan for a study using job satisfaction as a dependent variable.
The plan should also specify when data will be collected from each source. Although data collection as an overall process should take place throughout the course of the study, the timing of collection from each source should be designed so as to disrupt the natural course of events in the situation as little as possible. For example, if the study in Table 13.3 were scheduled to last 6 months, questionnaires might be used at the beginning, in the middle, and at the end to minimize demands on the research participants, and interviews might be conducted throughout the study, but with no source being interviewed more than three times. Observations could be made on a daily basis, and records could be checked weekly. When planning data collection, whenever possible the researcher should consult with people at the case study site to get their input on the optimal timing for each type of data collection. For example, although a researcher might want to consult absenteeism records weekly, the personnel office might collate those data only on a biweekly basis.
Excerpt From a Hypothetical Data Collection Plan
Dependent Variable: Job Satisfaction | ||
Operational Definition: |
Expressed Attitudes |
Absenteeism |
Sources of information |
Questionnaire completed by all workers |
Records kept by personnel office |
|
Observation of work behavior and workers’ on-the-job remarks |
Observation in work areas |
|
Interviews with selected workers |
Interviews with selected workers (to ensure that dissatisfaction is a cause of absenteeism in this factory) |
|
Interviews with supervisors |
Interviews with supervisors (same goal) |
|
Interviews with selected workers’ spouses |
Interviews with selected workers’ spouses (same goal) |
Although a carefully planned case study is the ideal, detailed planning is not always possible. For example, a clinician might unexpectedly encounter an unusual case or discover a novel but effective form of therapy during a course of treatment. In such situations, the information uncovered would be of great value to other psychologists, so the people involved write up their findings in the form of a case study. In such situations, even though preplanning is not possible, adhere to the validity criteria listed in Table 13.1 as closely as possible. For example, perhaps you could identify a set of objective measures during the course of treatment and make assessments at frequent intervals thereafter. You could also carefully record problem type, magnitude, and timing of effects, and carry the measurements through a follow-up period. Novel treatments may not be standardized, but careful records of what was done will let others implement the treatment and further test it. Such case studies can make important contributions to the scientific knowledge base, but the reports of such studies should clearly indicate which portions of the research were ad hoc and which were planned so that readers can judge the validity of the conclusions drawn by the researchers.
Search for disconfirming evidence. As the Lewis-Redfield debate that we described in Chapter 2 illustrates, researchers tend to interpret their data as supporting the theories they favor. Consequently, it is important in conducting case study research to search actively for data that might disconfirm hypotheses as well as for supporting data (Yin, 2009). For example, in studying the relation of job dissatisfaction to absenteeism, you could design a set of interview questions that focus only on the role of dissatisfaction in absenteeism. A better approach would be to also ask about other possible causes of absenteeism, such as the need to care for sick children, and the perceived importance of the different factors. In drawing conclusions from the data, you would weigh the supporting evidence against the disconfirming evidence to determine the validity of the hypotheses.
Maintain a chain of evidence. Recordkeeping is an important aspect of any form of research. However, it is especially important in case study research because the source of a piece of information is an essential clue to the validity of the information. For example, if your records simply state that, in an organization being studied, job dissatisfaction is a cause of absenteeism, how do you judge the validity of that conclusion? If your records show where that information came from, such as a series of interviews with employees who have records of absenteeism, then you can judge the validity of the information. Yin (2009) refers to the function of recordkeeping as “maintaining a chain of evidence” that allows a person, especially someone not connected to the research project, to trace the source of every conclusion drawn from the research and to link every conclusion to a hypothesis.
There are four essential links in this chain (Yin, 2009): First, the research report written about the study should clearly indicate the data on which each conclusion is based. For example, case studies frequently quote excerpts from interviews and documents or provide detailed descriptions of observations in support of a conclusion (see, for example, Simon, Eder, & Evans, 1992; Smith & Kleinman, 1989). Second, the case study records should include complete transcripts of interviews and copies of documents and observation records so that the quotations and examples used in the report can be read in context. Each record should also clearly indicate the circumstances under which the data were collected, such as the date and place of an interview and, to the extent that confidentiality allows, the identity of the person interviewed. Third, the record should indicate how the circumstances under which each set of data (such as an interview) was collected fit the requirements of the data collection plan. This procedure ensures that the data were collected as specified in the plan; for example, it ensures that the correct person was interviewed on the correct topic at the correct point in the research project. Finally, the data collection plan should indicate how the data collected relate to the study questions by showing which data are intended to answer which questions (see also Chapter 16).
A chain of evidence such as this supports the validity of a case study in two ways. First, it allows you to work forward, tracing the links from a study question to the data collection plan to ensure that plans were made to answer each question completely. You can then go from the data collection plan to the records to make sure that all the relevant data were collected. Finally, you can go from the records to the report to ensure that all relevant data were reported and that no information was lost due to bias or carelessness. The second way to check validity is to work backward from the conclusions drawn in the report, examining the evidence in the records supporting the conclusions, checking the validity of the data by determining if the data were collected according to plan, and seeing if the plan included adequate provisions to answer all the study questions completely.
Like case studies, single-case experiments focus on the behavior of a single person or case rather than on the average behavior of the members of a group of people or cases. However, the single-case experimenter exerts more control over the research situation than does the case study researcher. The principal differences are that the single-case experimenter manipulates the independent variable in the research, obtains baseline data against which to compare the effects of the independent variable, controls the research context to reduce the effects of extraneous variables, and assesses the dependent variable continuously over a period of time. In essence, the single-case experimenter trades off some of the case study researcher’s naturalism to gain more control while maintaining a focus on individual behavior. There is no hard and fast line dividing case studies from single-case experiments: As the researcher exerts more control over the research situation, the research becomes more like a single-case experiment than a case study. In this section we look at some of the basic designs that are used for single case experimentation and then discuss the importance of the baseline period for assessing the validity of single-case experiments.
The single-case experiment is a very flexible research strategy that can be implemented in a wide variety of ways (Barlow et al., 2009). Its essence, however, is quite straightforward: The researcher assesses the dependent variable for a case (usually a behavior) over a period of time to determine the baseline frequency of the behavior in the absence of the independent variable. This baseline period, designated “A” in descriptions of single-case experiments, is equivalent to the control condition in a within-subjects experiment. The researcher then exposes the case to the independent variable and assesses the dependent variable again. This experimental condition is designated “B,” and if additional conditions are used, they are designated with ascending letters of the alphabet: “C,” etc. The effect of the independent variable is determined by comparing the case’s rate of behavior in the experimental condition with the rate in the baseline condition. In this section, we discuss six of the most basic single-case experimental designs: A-B-A, A-B, A-B-C-B, multiple baseline, simultaneous treatment, and changing criterion.
The A-B-A design. The A-B-A design is the most basic of the single-case experimental designs: The researcher assesses the case’s behavior over a baseline period, introduces the independent variable, and then removes the independent variable. The logic of the design is that the independent variable should bring about a change in behavior from Period A to Period B. Furthermore, if the independent variable is the true cause of the change, the behavior should revert to the baseline level if the independent variable is removed. That is, there should be a reversal of behavior from Period B to the second A period; for this reason, these designs are also called reversal designs.
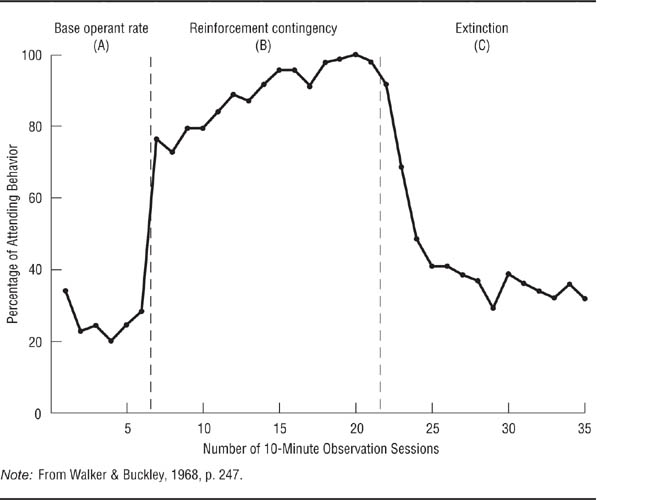
Walker and Buckley (1968) used an A-B-A design to test the effectiveness of a conditioning procedure as a way of increasing the amount of time children pay attention to a classroom task. The participant in the experiment was a 9-year-old boy who was easily distracted in class. The conditioning procedure consisted of having the boy sit at a table and work on a school task. During the time he was there, the experimenter would make slight noises; each time the boy ignored the distraction, he was rewarded with a point. After the experiment was over, he was allowed to trade his points for a prize. The results of the experiment are shown in Figure 13.2. As you can see, the reward had a dramatic effect on the boy’s “attending behavior.” He spent a much larger proportion of his time on task during the reward period than during the baseline period, and his time on task decreased markedly and rapidly when the reward was withdrawn. After completion of the experiment, the boy was enrolled in a program designed to bring about lasting improvement in his attention span through the use of reinforcement by his teachers.
The A-B design. Use of the A-B-A or another reversal design implies that the continued presence of the independent variable is necessary for maintaining the behavior change and that the removal of the treatment is ethically feasible. If the independent variable is expected to bring about a change that should continue even after exposure to the independent variable is terminated—if, for example, the independent variable was a smoking cessation program—or if removal of the treatment might result in harm, then an A-B design is used. As its name indicates, the A-B design does not include a reversal period to allow a return to baseline levels of behavior; consequently, the researcher must use criteria other than return to baseline to assess the effect of the independent variable. These criteria include the magnitude and immediacy of the effect, and the continuation of the effect during long-term follow-up assessments.
An A-B-A Design.
Walker and Buckley (1968) first collected baseline data on the amount of time a child paid attention in class (first A period), then rewarded the child for paying attention (B period), then removed the reward (second A period). Attention increased with reward and decreased when reward was removed, indicating that the reward caused the increase in attention.
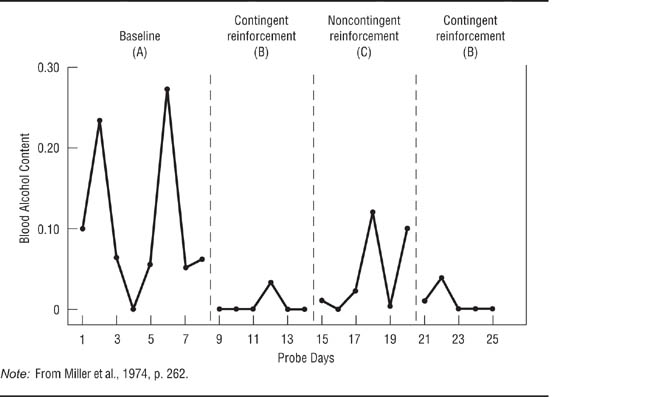
The A-B-C-B design. In Chapter 9, we noted that research hypotheses sometimes require special control groups to fully test a hypothesis or to rule out alternative explanations for the effect of the independent variable. The A-B-C-B design introduces an additional control condition—the C condition—to single-case experimentation. Miller, Hersen, Eisler, and Watts (1974) wanted to determine if reward could be used to help alcoholics reduce their drinking. The researchers hypothesized that rewarding an alcoholic each time he showed a zero blood alcohol concentration (BAC) would result in his stopping drinking to obtain the reward. Their hypothesis specified that the change in behavior would be contingent on the reward. That is, they expected the procedure to work only if the alcoholic was rewarded when he had a zero BAC; a reward when he had an elevated BAC was hypothesized to be ineffective. Miller et al. tested their hypotheses by having an alcoholic take a surprise blood-alcohol test twice a week for 3 weeks as a baseline condition. He was then told he would be given $3 every time he had a zero BAC on a test. For the next 3 weeks, he was rewarded with $3 for a zero BAC (the B experimental condition). During the following 3-week period, the alcoholic received a noncontingent reward: He was given $3 regardless of his BAC (the C experimental condition). Finally, the B condition was reinstated for 3 weeks.
Figure 13.3, shows the results of the experiment. The alcoholic’s BAC was high during the A period, with a mean of 0.11% and a high of 0.27%. The BAC dropped to zero during the first B period, increased during the C period, and returned to zero during the second B period. The increase from the first B period to the C period and the reversal in the second B period supported the researchers’ hypothesis that the reward had to be contingent on a zero BAC to maintain a low level of drinking. Note that Miller et al. could have added a second A period to the end of the experimental sequence to try to show a reversal from the B condition to the A condition. However, such an A-B-C-B-A design would not have been ethical in this case because it probably would have resulted in the alcoholic’s returning to a high level of drinking.
Multiple-baseline designs. History is a threat to the internal validity of single-case experiments because it is possible that some outside event may coincide with the institution of the independent variable and will therefore be the true cause of change in the dependent variable (Kazdin, 2011). One technique that researchers can use to reduce the likelihood of a history confound as an explanation for the results of the study is the multiple baseline design. In one type of multiple-baseline design, the researcher identifies several dependent variables. All the dependent variables are observed for a baseline period, then the independent variable is applied to one of them. After a predetermined period of time, the treatment is applied to the second dependent variable. After another predetermined period of time, the treatment is applied to the third dependent variable, and so forth. Each dependent variable has a longer baseline than the one before it; for example, the second dependent variable has a baseline period that totals the original baseline plus the predetermined wait after the treatment is applied to the first dependent variable. This process is illustrated in Figure 13.4. If the treatment has the predicted effect on each dependent variable in sequence, it becomes unlikely that history could be an explanation each time. In addition to having multiple baselines across dependent variables, they can also be used across settings and research participants. Multiple-baseline designs therefore also test the generalizability of the effect being studied. Let’s look at examples of each of these types of multiple-baseline applications.
An A-B-C-B Design.
Miller, Hersen, Eisler, and Watts (1974) first took baseline blood alcohol content (BAC) measures from an alcoholic (A period), provided reward contingent on his having a zero BAC (first B period), provided a noncontingent reward (C period), and reinstated the contingent reward (second B period). BAC decreased under contingent reward, increased under noncontingent reward, and decreased again under contingent reward, indicating that contingent reward, not just any reward, was necessary to bring the behavior change about.
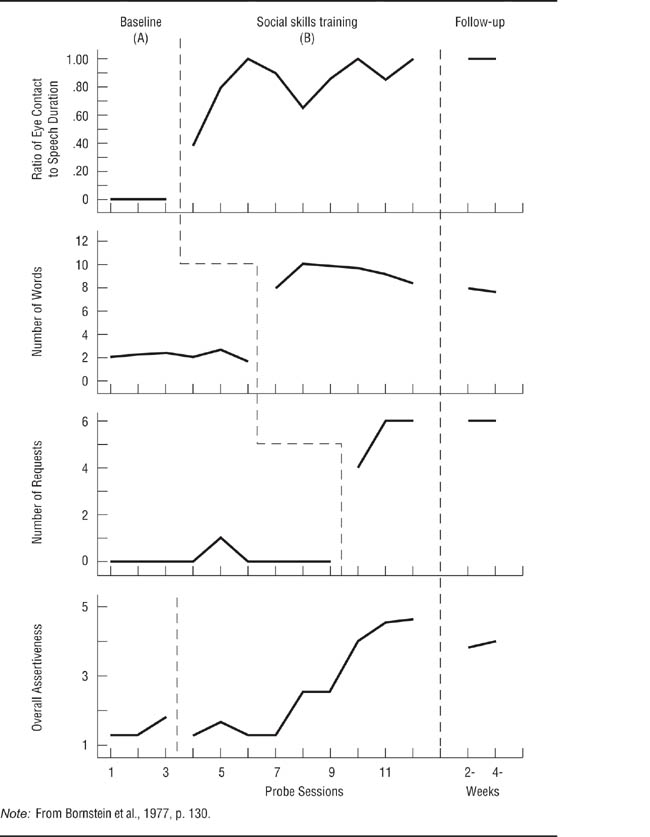
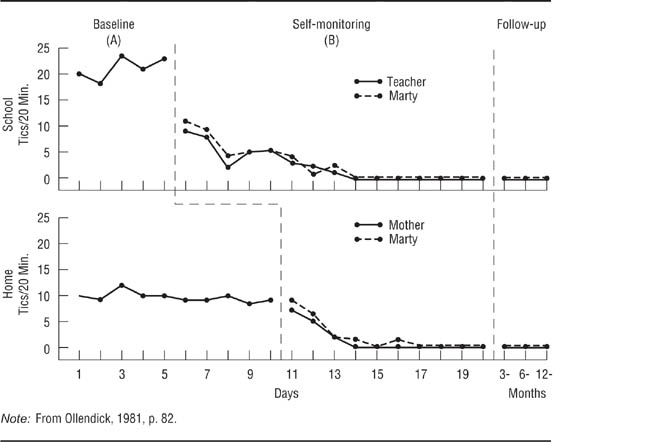
Bornstein, Bellack, and Hersen (1977) conducted an A-B multiple-baseline study across behaviors to test the effectiveness of social skills training for children. They focused on three behavioral indicators of assertiveness: the proportion of time that the child maintained eye contact while speaking, the loudness of the child’s speech, and the number of requests the child made. Reinforcement of the first behavior followed a 1-week baseline, reinforcement of the second behavior began a week later (providing a 2-week baseline for it), and reinforcement of the third behavior began a week following the beginning of treatment for the second behavior (providing a 3-week baseline for it). The results for one of the participants in the research are shown in Figure 13.5; the study was replicated across several children, including both boys and girls. The first three panels of the figure clearly show the effect of the treatment for each behavior; the bottom panel shows the cumulative effect across behaviors. Notice that each behavior shows a change only after the treatment for it is instituted. If all three behaviors had changed when the treatment for the first had been instituted, then a history confound could have occurred. Because simultaneous changes would also occur for behaviors that are naturally correlated, only uncorrelated behaviors should be used in designs in which the baseline changes across variables (Barlow et al., 2009). A difficulty in implementing this design is that it may not be possible to find several uncorrelated behaviors that will respond to the same independent variable. Ollendick (1981) conducted a study with an A-B design of a behavioral treatment for a child’s facial tics using baselines across two settings, school and home. He taught the child techniques for controlling the tics and had the child keep track of his tics as a way of reinforcing the success of the treatment: The child would have a rewarding feeling of success when he saw the frequency of tics decline. Ollendick referred to the recordkeeping procedure as “self-monitoring.” The results of the study are shown in Figure 13.6. The school and home settings had a common 5-day baseline, after which the child kept track of his tics in school; 5 days later, he began to keep track at home. Notice that the tics in school showed a more dramatic change because they started at a higher level and that the treatment at school did not affect the behavior at home. Notice also that Ollendick checked the reliability of the child’s recordkeeping by having his teacher keep track of tics at school and his mother keep track at home; they also recorded the baseline data.
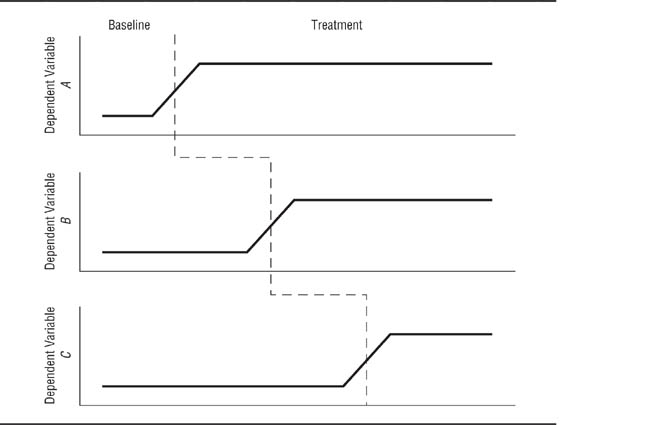
Schematic Representation of a Multiple Baseline Design.
Different behaviors are targeted for treatment at different times. If each targeted behavior changes only when its treatment is instituted, it is unlikely that a history confound occurred because it is unlikely that a history confound would be coincident with the institution of each treatment.
An A-B Multiple-Baseline Design Across Behaviors.
Bornstein, Bellack, and Hersen (1977) studied the effect of social skills training on three behaviors related to assertiveness. Each behavior changed only when it was targeted for treatment.
A Multiple-Baseline Design Across Settings.
Ollendick (1981) studied the effectiveness of self-monitoring for reducing tics in both a school and home setting.
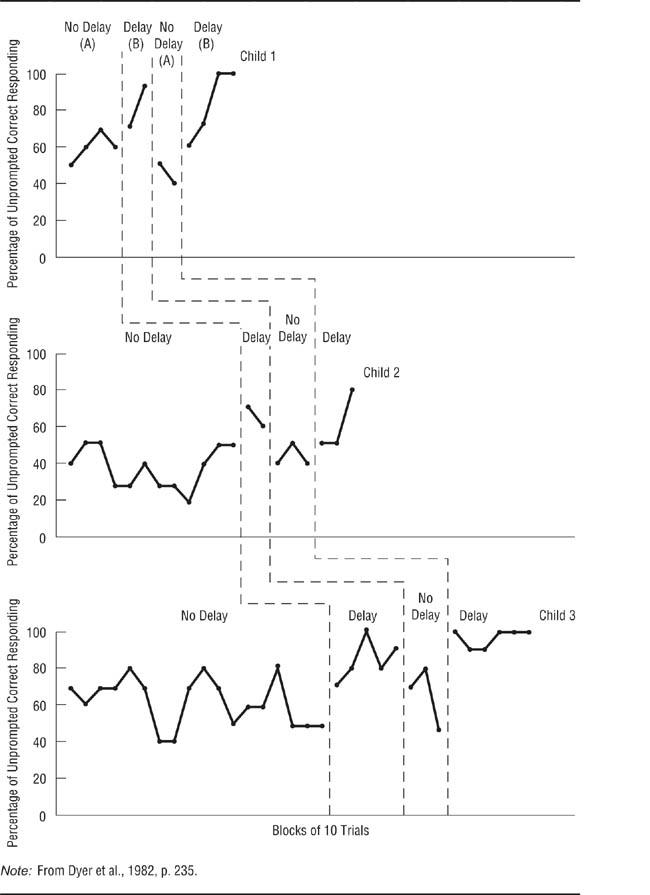
A Multiple-Baseline Design Across Participants.
Dyer, Christian, and Luce (1982) tested the effectiveness of an intervention for improving the task performance of autistic children.
Dyer, Christian, and Luce (1982) conducted a study with an A-B-A-B design in which the baseline changed across research participants to test the effectiveness of a treatment for improving the performance of autistic children on certain tasks. The treatment consisted of making the children wait briefly before responding to questions. The treatment was used because teachers of autistic children had noticed that the children seemed to start making responses to stimuli before actually paying attention to them. The study included three children—two girls and a boy—each of whom was tested on a different task; these procedures helped demonstrate the generalizability of the results. Each child had a baseline period of different length before the treatment was instituted. The results of the study are shown in Figure 13.7. The treatment was effective for each child. The A-B-A-B design showed that it was the treatment that was changing the children’s behavior, and the multiple-baseline approach helped to improve generalizability and rule out a history confound as an explanation of the effect.
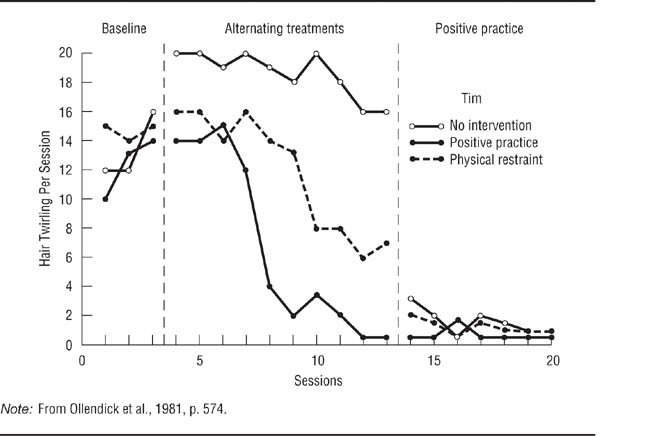
The simultaneous treatments design. The simultaneous treatments design, also called the alternating treatments design, can be used to test the relative effectiveness of several treatments in one experiment. A no-treatment condition can also be included. In a simultaneous treatments experiment, each research session is divided into several equal time periods, one for each treatment. Each treatment is used during its time period, and the order of treatments is counterbalanced across research sessions. Ollendick, Shapiro, and Barrett (1981) used a simultaneous treatments design to compare the effectiveness of two treatments for controlling stereotypic hand movements made by intellectually disabled children. Stereotypic movements are motions that follow the same pattern time after time and interfere with the proper movement required by a stimulus. The treatments were physical restraint of the stereotypic movements and “positive practice,” in which the experimenter assisted the child in making the proper movement. In addition, the researchers included a no-treatment control condition. Each 15-minute research session was divided into three 5-minute periods, one for each treatment. The results for one of the research participants are shown in Figure 13.8. Stereotypic behaviors tended to increase during the baseline period and continued at a high level when no intervention was used. However, physical restraint brought about a gradual decline in the movements, and positive practice led to a rapid and greater decline.
Unlike other single-case experimental designs, the simultaneous treatments design allows the direct comparison of two treatments. It also allows the inclusion of a control condition. As in the Ollendick et al. (1981) experiment, this control condition helps to rule out history and maturation as threats to the internal validity of the research, just as a control condition does in group comparison experimental designs. However, two factors limit the use of this design. First, the treatments must not have carryover effects; otherwise, it becomes impossible to tell just which treatment is having an effect. Second, the participants must not be aware of the changes in treatment, or else reactivity might become a problem. Awareness of change can be lessened by using treatments that differ only slightly. For example, the experimenters in Ollendick et al.‘s research held the children’s hands in both treatment conditions, but restrained the hands in one condition and guided them in another.
A Simultaneous Treatments Design.
Ollendick, Shapiro, and Barrett (1981) compared two treatments for controlling stereotypic hand movements made by an intellectually disabled child to a no-treatment control condition. Each treatment session was divided into three periods, one for each condition of the experiment. During the baseline phase of the experiment, each treatment was assigned a period within each session for data collection purposes, but no treatment took place; this procedure provided a baseline for each treatment implemented in the next phase of the study. The treatments were implemented during the alternating treatments phase; both treatments reduced the behavior relative to no treatment, but positive practice was more effective than restraint. In the positive practice phase, as in the baseline phase, each condition was allocated a period within each session, but only positive practice was given.
The changing criterion design. As noted in the discussion of the validity criteria for single-case research, an immediate large change in the dependent variable in response to treatment is an indicator of the effectiveness of the treatment. But what if the nature of the treatment or the dependent variable leads one to expect a gradual change? In a changing criterion design, the researcher sets specific criteria for the dependent variable to reach as indicators of treatment effectiveness. If the treatment leads to the expected change across an increasingly difficult criterion, then it is considered to be effective. To the extent that the dependent variable meets the changing criterion, history confounds can be eliminated because it is unlikely that an external event would affect the dependent variable coincident with every change in the criterion.
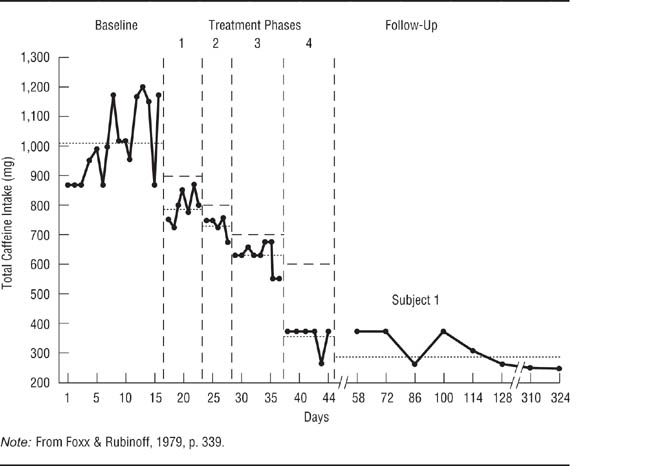
Foxx and Rubinoff (1979) used a changing criterion design to assess the effectiveness of a behavioral treatment for excessive coffee drinking. Research participants had an average daily caffeine intake exceeding 1, 000 milligrams (mg), equivalent to about 10 cups of coffee; the goal was to reduce intake below 600 mg. As shown in Figure 13.9, the treatment protocol required participants to reduce their caffeine intake in increments of 102 mg. Once the first 102-mg criterion was met (such as from 1, 000 mg to 898 mg), the treatment aimed at reducing intake by another 102 mg, continuing until the final goal was met and sustained during a follow-up evaluation. Kazdin (2011) notes that the changing criterion design is weaker than the other single-case experimental designs because it brings change gradually, making it more difficult to rule out confounds as an explanation for the change. However, it is the best design to use when change is expected to be slow.
A Changing Criterion Design. Because small changes were expected, Foxx and Rubinoff (1979) established a set of incremental criteria for evaluating the effectiveness of a treatment designed to reduce caffeine consumption.
Having looked at some single-case experiments, let’s now pause to consider one of the most essential elements of these designs—the baseline period. The baseline period serves as the control condition of a single-subject experiment and, as such, functions as the basis for deciding if the independent variable had an effect. For the researcher to draw valid conclusions, the baseline data in single-case experiments must be stable; that is, they should exhibit no upward or downward trend and should have low variability (Kazdin, 2011).
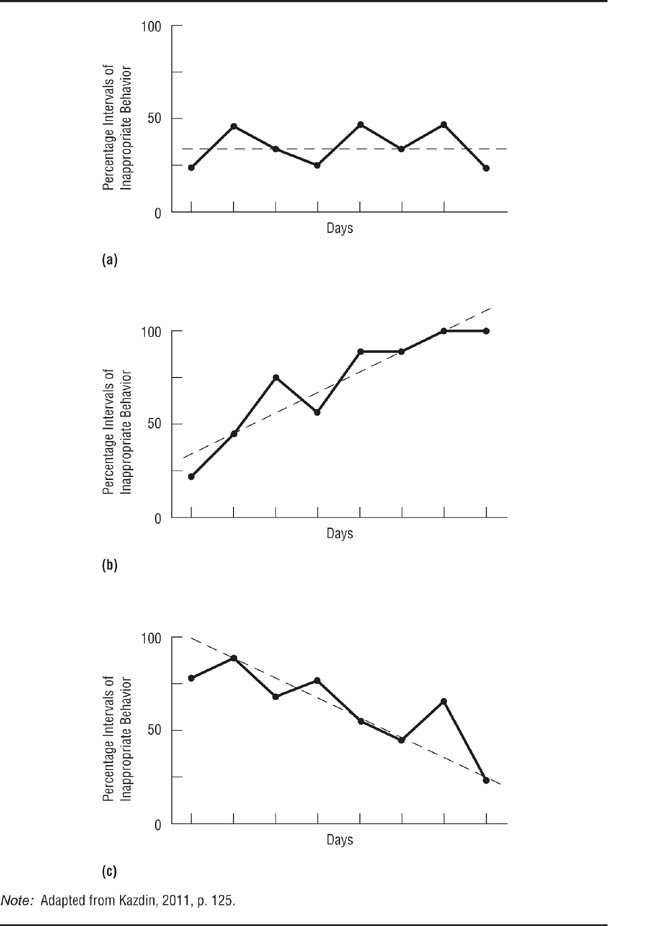
Trends. Baseline data show a trend if their values increase or decrease over time; a no-trend baseline is essentially flat, exhibiting random variations around a mean value. Consider the hypothetical baselines shown in Figure 13.10; the solid lines connect the data points for disruptive behavior of a hyperactive child, and the broken lines indicate the trend. Panel (a) shows a no-trend baseline; the data points vary randomly around a mean of 37.5. Panel (b) shows an increasing baseline, with the rate of disruptive behavior rising from 25 to 100. Panel (c) shows a decreasing baseline, with the rate of disruptive behavior falling from 75 to 25. A trend in baseline data causes the greatest problem for research when the trend is in the direction of the change that the treatment is intended to produce. For example, if an experiment were conducted to test the effectiveness of a treatment designed to reduce disruptive behavior and the rate of disruptive behavior declined after the treatment was introduced, a decreasing baseline could make it impossible to decide whether the independent variable affected the behavior or if the natural downward trend were continuing.
Hypothetical Baseline Trends for a Child’s Disruptive Behavior.
A stable baseline with no systematic trend over time; a trend with behavior becoming worse over time; a trend with behavior improving over time. The trend shown in panel (c) is most likely to make data interpretation difficult because it is in the direction of the expected effect.
If baseline data show a trend in the expected direction of the effect of the treatment, consider replacing the research participant with a person who shows a flat baseline. Or you could implement the treatment and see if the rate of behavior change is affected. For example, if both the baseline trend and the expected treatment effect are toward a decrease in the occurrence of a behavior, does the behavior decrease more quickly after implementation of the treatment? Figure 13.11 illustrates such a situation: The baseline shows a decreasing trend, but the rate of change increases during the treatment phase of the research.
If a study does not include baseline data, it becomes impossible to determine the effect of the independent variable. Consider the data in Figure 13.12, which are based on data from a single-case experiment on the effectiveness of a behavioral weight loss treatment (Martin & Sachs, 1973). Panel (a) shows the data as reported in the study. The data pertain only to the treatment period because the researchers collected no baseline data; nonetheless, they concluded that the treatment had been effective. However, consider Panel (b), which adds a hypothetical decreasing baseline. Under these conditions, one would conclude that there was no evidence for the effectiveness of the treatment: During the treatment period, the person being treated merely continued a weight loss that had already begun. Panel (c) adds a hypothetical no-trend baseline; under these conditions, the treatment appears to have had an effect.
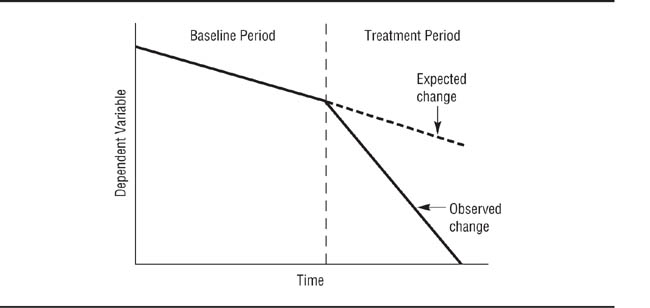
An Effective Treatment With a Decreasing Baseline.
The behavior during treatment changes faster than expected on the basis of the baseline data (broken line).
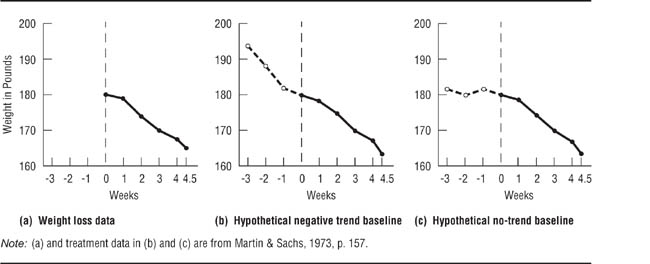
Effect of Different Baselines on Interpretation of the Results of a Single-Case Experiment.
With no baseline there is no way to evaluate the effectiveness of the treatment. A decreasing baseline suggests that the treatment has no effect. A flat baseline suggests that the treatment is effective.
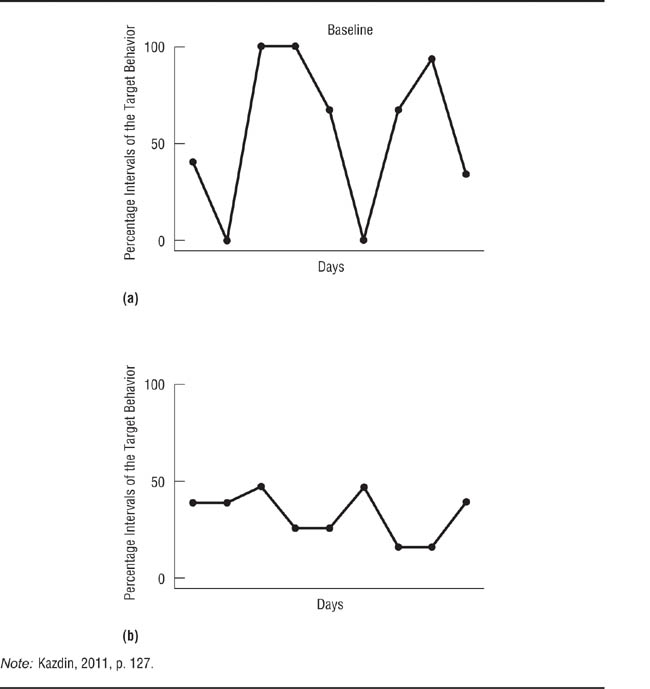
Variability. In addition to showing no trend, a stable baseline shows little variability around the mean value of the data. For example, Panel (a) of Figure 13.13 shows a high-variability baseline: Although the trend is flat, the data have a standard deviation of about 41. In contrast, the low-variability baseline shown in Panel (b) is also flat but has a standard deviation of about 12. The more variability there is in the baseline data, the harder it becomes to tell if any changes that occur after the institution of the independent variable are due to the independent variable or to natural fluctuations in the dependent variable. Turn back for a moment to Figure 13.3 and notice the high variability in Miller et al.‘s (1974) baseline data. If the alcoholic’s BACs during treatment had fallen into the range of baseline variability, it would not have been possible to say with any degree of certainty that the independent variable had had an effect. However, the near-zero BAC levels during treatment and the reversal during the C period indicate that the treatment was having the desired effect. Kazdin (2011) discusses in detail the interpretation of single-case experiments with high-variability baselines.
What constitutes a stable baseline? Unfortunately, there are no absolute criteria for determining the stability of baseline data. Because reactivity is one factor that can lead to instability (Bordens & Abbott, 2011), stability might be achieved only after a relatively lengthy period of observation during which novelty effects can wear off. In addition, different variables show different levels of natural variability, from the high variability shown by BACs in Figure 13.3 to the almost zero variability shown by the assertiveness behaviors in Figure 13.5. A behavior can also differ in variability across settings, as shown by the data for facial tics shown in Figure 13.6. Consequently, deciding whether a baseline is sufficiently stable to allow institution of the independent variable depends greatly on one’s knowledge of the dependent variable. Researchers who are relatively inexperienced with a particular variable should seek the advice of more experienced colleagues.
Hypothetical Baseline Data illustrating High (a) and Low (b) Variability.
Treatment effects are more easily evaluated with little variability in the data.
Data analysis in group comparison research is relatively straightforward: The data are numerical, and there is a well-developed set of statistical techniques designed to help the researcher draw conclusions from them. The situation is relatively more complex for single-case research. Case study data are frequently qualitative, consisting of notes made during observations, transcripts of interviews, and so forth, and so are not always amenable to statistical analysis. In addition, many researchers who use the case study method eschew statistical analysis on philosophical grounds; recall our discussion in Chapter 1 of differing approaches to scientific knowledge. Single-case experiments and some case studies do produce quantitative, or numerical, data. However, statisticians have only recently taken an interest in the analysis of single-case data, so quantitative data from single-case research are often analyzed by visual inspection—graphing the results and deciding whether the pattern of data indicates that the independent variable had an effect. This section provides a brief overview of some of the issues in the qualitative and quantitative analysis of single-case data.
Yin (2009) suggests two strategies for analyzing qualitative data. With pattern matching,the researcher starts with a theory and examines the data to see if they support predictions made by the theory. With explanation building, the researcher examines the data in order to find patterns that emerge from them; these patterns then suggest hypotheses that explain the process being studied.
Pattern matching. The pattern-matching approach starts with a theory from which the researcher derives hypotheses before collecting data. These hypotheses drive the data collection process by providing a framework for the data collection plan. The plan is devised so that it is possible to collect both data that support the hypotheses and data that could contradict the hypotheses. After the data have been collected, the researcher can list the hypotheses along with their supporting and disconfirming data. For example, Kerckhoff and Back (1968) conducted a case study of the spread of a mysterious illness through one department of a clothing factory. Because medical investigators could find no physical cause for the symptoms presented by the affected employees, Kerckhoff and Back hypothesized that the illness was psychosomatic and spread through “hysterical contagion.” They developed a set of hypotheses based on clinical theories of hysterical disorders and group hysteria, some of which are shown in the left-hand column of Table 13.4; data relevant to the hypotheses are summarized in the right-hand column. Once the hypotheses and data are displayed in this format, the researcher can judge how well the data fit the hypotheses. Based on their observations, Kerckhoff and Back concluded that their hypotheses were supported.
TABLE 13.4
Pattern Matching in Kerckhoff and Back (1968)
Theoretical Prediction |
Observation |
Hysteria results from stress |
Workers were in a new plant. There was a high degree of ambiguity about work procedures and expectations. Such ambiguity tends to be stressful. |
|
There was pressure for increased production just before the outbreak. |
|
Workers had to work long overtime shifts on short notice. |
Victims should show specific vulnerability factors |
These factors were more common among affected workers than with unaffected workers. |
Group hysteria is transmitted through the social network |
98% of workers were on the same shift. |
|
Affected workers were closer friends with other affected workers than with unaffected workers. |
Group hysteria spreads quickly |
80% of cases occurred in two days. |
Note: Adapted from Evans, 1985, pp. 219–220.
Explanation building. The explanation-building approach to qualitative data analysis requires the researcher to search for trends in the data. The goal is to devise hypotheses and theories that explain the process under study (Lofland, Snow, Anderson, & Lofland, 2005). There are four aspects to the process of explanation building (Marshall & Rossman, 1989): organizing the data; generating categories, themes, and patterns; testing emergent hypotheses; and searching for alternative explanations. These aspects are not discrete steps, but go on simultaneously and continuously throughout the data analysis process. Organization consists of examining the data for what appear to be key items of information around which the entire data set can be structured. These key items form the basis for determining patterns in the data, such as consistencies in behavior and in responses to questions. Examples of some of the types of patterns that might be found in qualitative data are in Box 13.1. The patterns form the basis for hypotheses that are used to explain the phenomenon being studied, and the validity of the hypotheses can be checked against other data. Finally, the researcher must examine data for possible alternatives to the initial hypotheses. Merriam (1998) and Patton (1990) provide detailed descriptions of methods for qualitative data analysis, including data from replicated case studies.
1. |
Types: Does a behavior take only one or more than one form? For example, aggression can be physical or verbal, direct or indirect, active or passive (recall Table 1-2). |
2. |
Frequency: How often does a behavior occur? How many people (or what proportion of a group of people) perform the behavior? |
3. |
Magnitude: How strong or weak is the behavior? For example, aggressive behaviors can vary in the degree of injury they inflict. |
4. |
Structure: How are aspects of the behavior related to one another? For example, are certain categories of people more likely to use some forms of aggression and not others? |
5. |
Processes: Is there a progression in the way things happen? For example, do events happen in sequence with one form of aggression leading to another? Is there a cycle to events, with a behavior occurring periodically or a sequence repeating itself? |
6. |
Causality: What are the apparent causes of a behavior? Does there appear to be only one cause or are there multiple causes? Do the causes appear to be cumulative, such that a certain number must be present for the behavior to occur? Does the cause appear to be a characteristic of the situation or of the people in the situation? |
7. |
Consequences: What are the apparent effects of a behavior? What functions does a behavior appear to serve? For example, does being aggressive appear to allow one person to control another? Always bear in mind, however, that the observed effect might not be the intended effect. For example, a behavior might cause an unintended injury. |
8. |
Agency: How do people go about accomplishing a task? For example, to reduce the changes that verbal aggression is followed by physical aggression, a person might try to redirect the aggressor’s attention. |
Source: Adapted from Lofland, Snow, Anderson, and Lofland (2006).
Smith and Kleinman (1989) took the explanation-building approach to the data from their study of the strategies that medical students use to cope with stress. Their observations and interviews revealed five coping strategies that the students used separately and in combination: treating the experience as intellectual rather than emotional, focusing on positive aspects of the experience, blaming the patient for the student’s discomfort, making jokes to relieve tension, and avoiding stressful situations. Similarly, Simon et al. (1992) looked for patterns in their interview and observation data of adolescent girls in order to derive the norms or rules that they had concerning how the emotion of love should be experienced. They identified five such “feeling norms”: (1) “Romantic relationships should be important, but not everything in life” (p. 33); (2) “One should have romantic feelings only for someone of the opposite sex” (p. 34); (3) “One should not have romantic feelings for a boy who is already attached” (p. 36); (4) “One should have romantic feelings for only one boy at a time” (p. 39); and (5) “One should always be in love” (p. 41).
Cautions. The analysis of qualitative data is necessarily subjective, and its practitioners consider this subjectivity to be a major strength of qualitative research (see, for example, Stake, 1995). However, even the most ardent advocates of the qualitative approach warn that data analysis must be conducted with two cautions in mind. The first is the possibility of bias, such as we saw in the Lewis-Redfield debate in Chapter 2: It’s always easier to notice and pay attention to data that fit our theories than to data that contradict them. Researchers can minimize this problem by developing a data collection plan that actively searches for contradictory data and following the plan closely. The second, related, potential problem is overlooking alternative explanations for data, especially in explanation building. This problem can be reduced by having colleagues review the research with the purpose of noticing issues you have overlooked. The process will be even more effective if some of the colleagues have different theoretical perspectives on the issues from yours. This, by the way, is a good practice for all research, not just qualitative research. We discuss qualitative analysis in detail in Chapter 14.
Single-case experiments produce quantitative data, which have traditionally been analyzed through visual inspection of graphic presentations of the data. However, statistical techniques have also recently been developed for the analysis of single-case data.
Visual analysis. In visual data analysis, the researcher plots a graph of the results of the experiment and examines the data to determine if the independent variable had an effect on the dependent variable. The researchers who conducted the experiments described in the section on single-case experiments all used visual analysis to draw conclusions from their data. Visual analysis is necessarily subjective, so not surprisingly there can be disagreements among researchers about the conclusions drawn from a study (Parsonson & Baer, 1992). However, reports of single-case experiments always present the graphs of their data, allowing everyone who reads the report to draw his or her own conclusions. This situation contrasts with the presentation of results in reports of group comparison experiments, in which means rather than raw data are presented.
In the absence of statistical analysis, impact is the primary indicator used to determine if the independent variable had an effect (Kazdin, 2011). The larger the change following the introduction of the independent variable and the faster the change, the more likely it is that the independent variable caused the change. In reversal designs, a return of the dependent variable to near-pretreatment levels during reversal phases also indicates the causality of the dependent variable. When the treatment brings about a permanent change or when a reversal would be undesirable, the effectiveness of the independent variable can be assessed by whether the dependent variable stayed below a criterion level during a long-term follow-up. For example, Figure 13.9 shows that the research participant had a long-term caffeine intake level well below the treatment goal of 600 mg per day.
Statistical analysis. Statisticians have begun to develop inferential statistics for single-case experiments. However, these techniques, reviewed by Barlow et al. (2009) and Kazdin (2011), are quite complex and so are beyond the scope of this book. Moreover, many of the available tests are relatively new and evaluation of their effectiveness is still ongoing. In general, however, they compare the level, variability, and trend of the baseline data to the same characteristics of the treatment data, and determine the probability of a change having occurred by chance after the introduction of the independent variable. The major advantage of statistical analysis of single-case data is that it is more sensitive than visual analysis. That is, researchers using visual analysis sometimes conclude that the independent variable had no effect when statistical analysis shows that it did. This problem is most severe when the independent variable has a small effect or when there is a high degree of variability in the data (Parsonson & Baer, 1992). The major drawback of statistical analysis is that the primary statistical tool, called time series analysis, requires 25 to 50 data points both before and after the introduction of the independent variable in order to provide accurate results. Few researchers employing single-case experiments collect data over that length of time.
The single-case approach was psychology’s original research strategy, but it was largely superseded by the group comparison approach during the first quarter of the 20th century. However, the inability of the group comparison approach to fully meet the needs of clinical research led to the development of modern single-case research techniques. Four issues in single-case research are validity criteria, case study research, single-case experiments, and data analysis.
High-validity single-case research uses objective measurement techniques, multiple dependent variables, multiple sources of information for each variable, and frequent assessment of the variables throughout the course of the research. High-validity research also includes multiple replications using heterogeneous participants. Case studies include control cases that test both convergent and discriminant hypotheses. The possibility of history and maturation confounds is minimized when the independent variable has an immediate large impact on a chronic problem and the impact is maintained during long-term follow-ups. Finally, validity is maximized when the independent variable is manipulated and highly standardized and its implementation is carefully monitored.
The researcher must carefully choose the cases for case study research. Ideally, you want to be able to manipulate the independent variable; if implementation is not possible, you must choose cases that exactly represent the independent variable. You must also have sufficient access to the cases to implement the validity criteria for single-case research. Further, you must carefully consider the appropriate unit of analysis for the study, such as a group as a whole versus the individual members of the group. A multilevel embedded case study could also be appropriate. Careful planning of data collection is essential. A data collection plan lists the dependent variables in the study, the operational definitions of each, the sources of information for each dependent variable, and the schedule for collecting data from each source. Throughout the data collection process, carefully maintain a chain of evidence linking the conclusions you draw from the data to the sources of those data, and linking the data sources to the data collection plan and the collection plan to the study questions.
There are five basic single-case experimental designs. In the A-B-A design, the researcher measures behavior during a baseline period, introduces an independent variable to see if it changes the behavior, and then withdraws the independent variable to see if the behavior returns to baseline. In the A-B-C-B design, the effects of two independent variables are compared by introducing them sequentially. The multiple-baseline design examines the effect of an independent variable on different behaviors, in different settings, and on different people, using an increasingly long baseline for each behavior, setting, or person. The simultaneous treatments design compares the effects of different independent variables by using each during every experimental session. Finally, the changing criterion design sets increasingly difficult targets for changes in behavior.
A stable baseline in a single-case experiment exhibits a minimal trend and low variability. A trend in the direction of the treatment effect calls the effectiveness of the independent variable into question, as does a treatment effect that falls into the range of variation of the baseline data. Unfortunately, there are no absolute criteria for baseline stability; it is a matter of professional judgment and experience.
Single-case data can be either qualitative or quantitative. When the research has a specific set of hypotheses, qualitative data can be analyzed by pattern-matching: examining the data for consistencies with and discrepancies from the predictions derived from the hypotheses. Explanation building is used with qualitative data from exploratory studies: The researcher examines the data for patterns that can explain the phenomenon being studied. When conducting qualitative data analyses, be careful to avoid theoretical biases and to be alert for alternative explanations for results. Quantitative data from single-case research are most often analyzed through visual inspection: The data are graphed and the impact of the independent variable is assessed. One drawback of visual analysis is that people often cannot detect small effects. More recently, statistical techniques have been developed for the analysis of quantitative single-case data.
Barlow, D. H., Nock, M. K., & Hersen, M. (2009). Single case experimental designs: Strategies for studying behavior change (3rd ed.). Boston: Pearson.
The authors provide a comprehensive but accessible guide to conducting single case experiments that includes both a historical perspective as well as practical advice about conducting this type of research.
Kazdin, A. E. (2011). Single-case research designs (2nd ed.). New York: Oxford University Press.
Kazdin’s excellent review addresses the methodological and practical considerations in conducting single-case research. His book focuses on single-case research designs in clinical and other applied settings, but researchers will find the discussion readily generalizes to other research areas.
Yin, R. K. (2009). Case study research: Design and methods (4th ed.). Thousand Oaks, CA: Sage.
Yin provides a step-by-step guide to conducting case study research, with a focus on when and why a case study is the appropriate methodology. He offers practical advice about all stages of the research process, from defining the question to reporting the results. The example case studies he provides are drawn from a broad range of social science research. Each chapter includes practical exercises and learning tips that help clarify major concepts.
Yin, R. K. (2004). The case study anthology. Thousand Oaks, CA: Sage.
Yin provides 19 examples of case study research on a wide range of social science topics, including urban school reform, the operation of a Fortune 100 firm, and crime reduction in New York City. Some examples illustrate the importance of theory; others the strength of having multiple-case studies. Also included is a set of case studies that use quantitative data analyses. Each selection opens with a discussion of the methodological significance of the case.
A-B-A design
A-B-C-B design
Changing criterion design
Control Cases
Embedded Case Study
Explanation building
Multiple baseline design
Pattern matching
Reversal designs
Simultaneous treatments design
Test Cases
Trend
Unit of Analysis
Visual data analysis
1. |
Describe the objections commonly raised to single-case research. How do the advocates of single-case research answer these objections? How valid do you think these objections and answers are? What are your reasons for your position on this issue? |
What criteria are used for judging the validity of single-case research? Read three case studies and single-case experiments that deal with a topic that interests you. How well does each meet the validity criteria? | |
3. |
Describe the use of control cases in case study research. What are the criteria for choosing control cases? |
4. |
Describe Yin’s model for replicated single-case research. |
5. |
How do the impact criteria for single-case research help rule out history and maturation as alternative explanations of the independent variable? |
6. |
How do characteristics of the independent variable or treatment affect the validity of single-case research? |
7. |
What criteria are used for selecting cases in case study research? Explain the importance of carefully considering the unit of analysis for a case study. |
8. |
Describe the structure of a case study data collection plan, and explain the importance of maintaining a chain of evidence during data collection. What are the links in this chain? |
9. |
Describe the basic outline of a single-case experiment. How are single-case experiments related to case studies and to within-subjects experimental designs? |
10. |
What procedures are used in each of the following single-case research designs, and what is the purpose of each design? (a) A-B-A, (b) A-B-C-B, (c) Multiple baseline, (d) Simultaneous treatments, and (e) Changing criterion |
11. |
The experiments illustrated in Figures 1-. 5 and 13-6 used A-B designs. What do you think were the researchers’ reasons for using this design rather than an A-B-A design? |
12. |
Explain the importance of a stable baseline in single-case experimentation; how do the trend and variability of the baseline data affect the interpretation of the data collected during the treatment period? What constitutes a stable baseline? |
13. |
What are the pattern-matching and explanation-building approaches to qualitative data analysis? What cautions must the researcher observe during qualitative data analysis? Is one of these forms of analysis more scientific than the other? Explain your conclusion. |
14. |
What criteria are used in visual data analysis for deciding if the independent variable had an effect? What do you see as the major shortcomings of visual data analysis? |
15. |
Choose a hypothesis that interests you and outline how you would test it using each of the three research strategies used in behavioral science. Describe the relative advantages and disadvantages of each strategy for testing the hypothesis, and show how the advantages of one strategy compensate for some of the disadvantages of one or both of the other strategies. Describe any uncompensated disadvantages. |