Check participants’ understanding
The Post-experimental Interview
Using the Internet to Collect Data
The Validity of Web-Based Data
Advantages of Internet Research
Economy and ease of data collection
Access to research participants and other data
Potential for increased internal validity
Disadvantages of Internet Research
Limits on experimental stimuli and response modes
Lack of control over the data collection environment
Passive recruitment strategies
Monitoring participants for harm
Advantages of Using Archival Data
Limitations of Archival Research
Suggestions for Further Reading
Questions for Review and Discussion
Having selected a hypothesis to test and a research strategy to use in testing it, the researcher embarks on data collection. This is the most interesting and enjoyable phase of research, and often the most challenging, for it is here that researchers meet and interact with their research participants. In this chapter, we will briefly look at three aspects of this process: research participants, research procedures, and using the Internet to collect data. We then examine how archived data, which has been collected for purposes other than research, can be used to test hypotheses.
Some of the most important questions that researchers face are those dealing with research participants. This section examines the issues to consider in answering three of those questions: What population should I use? How should I sample from that population? How many participants will I need?
When we conduct research, we want our results to apply to a certain group of people. This group might be very broad, such as the entire population of the world, or it might be very narrow, such as the students attending a particular college or university, or the group can fall somewhere between these extremes, such as all people in the United States who possess a particular characteristic, such as depression. Regardless of how broadly or narrowly we define this group, it constitutes the target population for our research. Frequently, target populations for behavioral science research are defined in terms of hypothetical constructs, such as depression. In such cases, we must operationally define the target population in terms of some manifest variable. For example, we could operationally define depression in terms of psychiatric diagnosis. The people who meet our operational definition of the target population constitute the study population. For most research, the study population is so large that it is impossible to collect data from all of its members. We therefore select a research sample from the study population from whom we collect our data. Figure 16.1 shows the relationships among the target population, study population, and research sample.
The distinctions among the target population, study population, and research sample are important because the definition of the study population and the sampling process can affect the validity of the research. To the extent that the measure used to define the study population suffers from measurement error, the members of the study population will not correctly represent the target population, reducing the extent to which the results of the research will apply to the target population as a whole. For example, not everyone who is depressed is seen by a mental health professional and receives a diagnosis of depression, some diagnoses of depression might be erroneous, and some people who are depressed might receive some other diagnosis. Therefore, researchers must be careful to use only the most valid measures available when defining the study population.
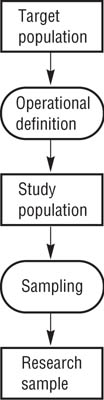
Moving From Target Population to Research Sample.
The target population is the group of people to whom we want the results of our research to apply (such as depressed people), the study population consists of those members of the target population who fit a particular operational definition of the target population (such as having a psychiatric diagnosis of depression), and the research sample consists of the members of the study population who participate in the research.
In addition, to the extent that researchers’ operational definitions of the target population differ, their findings might differ, leading to apparent contradictions among the results of studies. Widom (1988), for example, has pointed out that the operational definition of abused child can vary greatly from study to study. One consequence of this variation is that estimates of the incidence of child abuse range from 500,000 cases per year to 2,300,000 cases per year. As Widom notes, one cannot expect convergence in findings among studies unless the studies use similar study populations. A third potential problem lies in the sampling procedure: The research sample might not be representative of the study population and therefore not representative of the target population. In Chapter 6, we discussed the issues surrounding the validity of measurement; now let’s turn to the question of sampling.
There are a large number of techniques that you can use to draw a research sample from a study population (Daniel, 2011). Most of these techniques can be described in terms of two dimensions: probability versus nonprobability sampling and simple versus stratified sampling. In probability sampling every member of the study population has a known probability of being selected for the research sample; in nonprobability sampling, the probability of a person’s being chosen is unknown. Simple sampling assumes that the method used to draw the research sample will provide a reasonable cross section of the study population in terms of personal characteristics, such as gender, race/ethnicity, age, and so forth, that are important to the research; stratified sampling structures the research sample so that the sample contains the same proportion of each important characteristic as the study population. In addition to the sampling techniques defined by these dimensions, researchers can use purposive sampling, in which they select participants based on characteristics important to the research, and snowball sampling, in which current participants recommend people they know as future participants. Let’s examine these techniques.
Probability sampling. The basic forms of probability sampling begin with a list of all the people in the study population, such as a roster of all the students attending a particular college or university. This list is called a sampling frame. The researchers then decide how many people they want to participate in the research (N) and select N names from the list. With simple random sampling, the researchers use a table of random numbers to do the selecting. Each name on the list is given a unique identification number, ranging, for example, from 001 to 999. Starting randomly in a table of random numbers, the researchers look at the last three digits of the first random number and select for the sample the person whose identification number matches those digits. They then go on to the next random number, selecting for the sample the person whose identification number matches its last three digits. Random number digits that are outside the range of identification numbers are skipped, as are those that match identification numbers already selected. The process continues until the desired number of participants is sampled. Each person in the sampling frame therefore has an equal probability—1/N—of being selected for the sample.
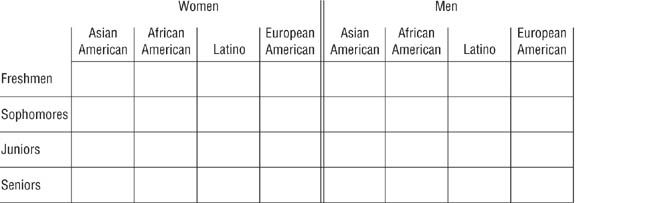
Quota Matrix for Sampling by Sex, Ethnicity, and Class.
Each person in the sampling frame is categorized by sex, ethnicity, and class and is assigned to the appropriate cell; researchers then sample randomly from each cell in proportion to its representation in the population.
For stratified random sampling, the sampling frame is arranged in terms of the variables to be used to structure the sample. Let’s say that the researchers want to ensure that the makeup of the research sample exactly reflects the makeup of the student body in terms of year in school (freshman, sophomore, and so on), gender, and ethnic group. The researchers draw up a quota matrix reflecting all possible combinations of these variables, such as the matrix shown in Figure 16.2. Each person in the sampling frame is categorized by these variables and assigned to the appropriate cell in the quota matrix; for example, all first-year Asian American women would be assigned to the upper left-hand cell in Figure 16.2. The researchers then sample randomly from each cell of the matrix, with each cell being sampled in proportion to its representation in the population. For example, if first-year Asian women constitute 1% of the study population and the desired sample size is 1,000, then 10 first-year Asian American women would be randomly selected for the sample.
Simple and stratified random sampling can be very difficult and time consuming to carry out, especially if the assignment of identification numbers and the selection of participants are done by hand rather than with the assistance of a computer. Even computerassisted random sampling can be laborious if the list comprising the sampling frame is not already available in a database and must be entered manually. A simple alternative to random sampling is systematic sampling. With systematic sampling, you start with a sampling frame and select every nth name, where n equals the proportion of the frame that you want to sample. For example, for a 10% sample, you would go down the list selecting every 10th name. Systematic sampling can also be stratified; by selecting every nth man and every nth woman results in a sample that is stratified by gender, for example. A danger in systematic sampling is a problem known as periodicity: The sampling frame is arranged so that some characteristic appears with the same pattern as the sampling interval, resulting in a biased sample. For example,
in a housing development or apartment house every eighth dwelling unit may be a corner unit. If it is somewhat larger than the others its occupants can be expected to differ as well. If the sampling [interval] also happens to be [eight], one could obtain a sample with either all corner units or no corner units depending on the [starting point]. (Blalock, 1979, p. 559)
Fortunately, periodicity is rarely found in practice, but you should still carefully examine lists to be used for systematic sampling to guard against the problem.
A major problem inherent in random and systematic sampling is that you must have a list of the entire study population to use as a sampling frame. Therefore, these sampling approaches can normally be used only with relatively small study populations, such as the students enrolled in a particular college or university. But what if you define your study population as all the college and university students in the United States? There is no comprehensive listing of this population. The answer to this problem is cluster sampling. With cluster sampling, you first identify groups or clusters of people who meet the definition of the study population; in our example, the clusters would be colleges and universities. You then take a random sample of the clusters and use all members of the sampled clusters as research participants. When the clusters themselves are large, sampling can also be conducted within clusters. When membership lists are available, random or systematic sampling can be used. Otherwise, you would use multistage cluster sampling, in which clusters are sampled within clusters. For example, for a face-to-face survey in a geographic area, census tracts can form the initial clusters; census blocks are sampled within tracts, houses or apartment buildings within blocks, apartments within apartment buildings, and people within apartments or houses. Cluster samples can also be stratified; in the college and university example, you could stratify by public versus private institution and by size. Census tracts or blocks could be stratified by their ethnic composition as reflected in census data.
Probability sampling is the ideal form of sampling because if done carefully it will provide a pool of potential research participants whose characteristics are near-perfect reflections of those of the study population. Probability sampling can therefore provide a sample that is highly representative of the population. This high degree of representativeness is only potential, however, because it may be impossible to contact some members of the potential participant pool and others may refuse to participate when contacted. To the extent that refusals and other causes of “lost” potential participants are related to participant characteristics, the people who actually participate in the research will not be representative of the population. For example, Doob and Macdonald (1979) identified highand low-crime city and suburban areas in and around Toronto. A door-to-door survey was conducted of randomly selected adults from randomly selected households in each area. Despite these stringently random sample-construction procedures, 70% of the respondents to the survey were women. It is therefore important to compare the characteristics of the people who take part in the research to the characteristics of the population that was sampled using whatever data are available—usually demographic information—to assess the degree to which the people who took part in the research represent the population.
Even when you can be fairly confident of obtaining a representative group of participants, probability sampling can be very difficult to carry out unless the study population is relatively small, such as the membership of an organization. Data collection based on probability sampling can also be very expensive if a geographically diverse population, such as that of a nation, is being sampled. In addition, if members of the sample do not live near the researcher, the research must be carried to them, rather than having them come to the researcher. Consequently, the research must often be based on questionnaires, limiting the forms that experimental manipulations can take and limiting measurement to self-reports.
Nonprobability Sampling. Probability sampling is used infrequently in behavioral science research, partly because of the costs involved and partly because of the limitations it places on experimental manipulations and the types of measures that can be used. Consequently, researchers are more likely to use nonprobability or convenience samples. As the latter term implies, nonprobability samples consist of people from whom the researcher finds it convenient to collect data. For example, researchers might select depressed people as their target population for a study and define the study population as people who score above a certain point on a self-report depression inventory. However, rather than trying to draw a probability sample from that population, the researchers administer the depression inventory to students at the university where they teach and use those who score above the cutoff as the research sample. University students are selected as research participants not because they are necessarily representative of the target population, but because the researchers find it easy to collect data from them. When researchers use essentially anyone who happens to be convenient as research participants, they are said to have conducted haphazard sampling. Haphazard samples can also be stratified using a quota matrix such as that shown in Figure 16.2, in which case they are known as quota samples.
Convenience samples are not restricted to college students. Marketing researchers often use “mall intercept interviews,” recruiting as participants people walking in shopping malls. Researchers also sometimes ask people in shopping malls, parks, and other public places to answer questionnaires, or they recruit participants through interest groups found on the World Wide Web.
Convenience samples are generally easy to acquire and inexpensive for data collection. As noted in Chapter 3, college and university students are frequently drafted as research participants to form convenience samples. Members of convenience samples can usually come to the researcher’s laboratory, enabling the researcher to use complex experimental manipulations and behavioral and physiological measures. However, the researcher has no way of knowing the degree to which the members of a convenience sample are representative of the target population. The more the characteristics of the members of the sample differ from those of the members of the target population, the less likely the results of the research are to apply to the target population. As you will recall from Chapter 8, there are very important validity issues related to convenience sampling, and this method of selecting research participants is highly controversial.
Purposive Sampling. In purposive sampling researchers use their judgment to select the membership of the sample based on the research goals. Purposive sampling is frequently used in case study research, in which researchers often want to study typical or critical cases (see Chapter 13). A typical case, as the term implies, is one that the researcher believes is representative of the average case. For example, a researcher might choose a school for a case study because the demographic characteristics of its students and faculty appear to be representative of most of the schools in the district. A critical case is one that has one or more characteristics of special interest to the researcher. For example, a researcher might choose a school as the test case in a comparative case study because it represents a particular level of an independent variable, such as funding; other schools with different funding levels could be chosen as control or comparison cases. Purposive sampling can be further used to select individuals within the school as sources of data by targeting for interview “key informants” who have special knowledge that is of interest to the researcher.
Snowball Sampling. The final form of sampling is known as snowball sampling. In this procedure, people who are initially selected for a sample using convenience or purposive sampling nominate acquaintances whom they think might be willing to participate in the research. The nominees who agree to participate are then asked to nominate other potential participants. The sample size therefore grows like a rolling snowball, hence its name. This procedure is frequently used in developmental research: Once a group of parents whose children are at the age required for the research has been identified, those parents can recommend other people who have children of the same age as research participants and might even encourage friends and relatives to participate. Snowball sampling is also used to construct samples of hard-to-reach populations whose members might otherwise be unidentifiable, such as illegal drug users.
In addition to deciding on how to sample research participants, the researcher must also decide how many people to sample. The question of sample size is closely related to the question of statistical power, so we must begin there.
Statistical Power. You will recall that the p value associated with the outcome of a statistical test, such as the t test, represents the probability of concluding that the independent variable had an effect on the dependent when, in fact, it did not. Statistical testing has traditionally focused on the probability of deciding that the independent variable had a real effect on the dependent variable when, in fact, the effect found in the sample was due to chance. As shown in the top part of Table 16.1, the Type I error rate, or alpha level, usually set at 05, represents the probability of making this kind of error. If the statistical test indicates no effect of the independent variable—that is, is p greater than .05—there is also a probability that the independent variable would have had an effect in the population, but, due to error, that effect was not found in the research sample. As shown in the bottom part of Table 16.1, the error caused by incorrectly concluding that the independent variable had no effect is called a Type II error; the probability of a Type II error is represented by beta, which, like alpha, can range from 0 to 1. Statistical power, represented by 1 – beta, is the probability of not making a Type II error. That is, if a statistical test has insufficient power, it increases the chances of erroneously concluding that the independent variable had no effect on the dependent variable. You therefore must have high statistical power to avoid false negative results.
The power of a statistical test depends on several factors, including the alpha level chosen for the test, the size of the effect that the independent variable has on the dependent variable, and the size of the research sample. This discussion will assume that alpha equals .05 and that an independent variable can have a small, or medium, or large effect. The operational definition of effect size depends on the statistical test, but we will consider a small effect to be equivalent to a correlation of .10 between the independent and dependent variables, a medium effect to be equivalent to a correlation of .30, and a large effect to be equivalent to a correlation of .50 (Cohen, 1988). Unfortunately, much behavioral science research has inadequate statistical power. For example, Rossi (1990) found that research published in four major psychology journals in 1982 had an average statistical power of only .17 for small effects, .57 for medium effects, and .83 for large effects. This means that if an independent variable has only a small effect on a dependent variable, researchers are not detecting that effect 83% of the time, and when an independent variable has a medium effect, researchers are not detecting it 43% of the time.
Type I and Type II Errors
A Type I error is erroneously concluding that an independent variable had an effect; a Type 11 error is erroneously concluding that an independent variable did not have an effect. |
||
Real Effect of the Independent Variable |
||
|
Relationship |
No Relationship |
Conclusion Drawn from Data |
|
|
Relationship |
Correct decision |
Type I Error (probability = alpha) |
No Relationship |
Type II Error (probability = beta) |
Correct decision |
Determining sample size. One way for researchers to improve the likelihood of detecting the effect of an independent variable is by conducting high-power research; one way of increasing power is to ensure an adequate sample size. To determine the appropriate sample size, you need the answers to four questions. First, what effect size are you trying to detect with your research? This target effect size is the critical effect size (Kraemer & Thiemann, 1987). There are several approaches to answering this question. One approach is to decide on the smallest effect you consider important to the theory or application your research is testing. For example, if you set your critical effect size at r = .25 using this approach, you are saying that any correlation smaller than .25 is equivalent to a correlation of zero for the purpose of answering your research question. Minimum critical effect sizes can be important in applied research because an intervention (that is, an independent variable) that doesn’t have a certain minimum impact might not be cost effective to implement. A second approach to deciding on the critical effect size is to use the average effect size found in previous research using your independent and dependent variables. Researchers who use a form of literature reviewing discussed in Chapter 19, called a meta-analysis, calculate mean effect sizes for bodies of research. For example, Richard, Bond, and Stokes-Zoota (2003) examined results of 322 meta-analyses on social psychological topics; results showed that effect sizes in social psychological research vary by topic, but that 3% had an r = .10 or less, 41% had an r between .11 and .29, 24% had an r between .30 and .49, and 5% had an r = .50 or greater. In Appendix B of their paper, Richard et al. provide effects sizes for a large number of social psychological topics that can be used to estimate the statistical power needed to conduct research in those areas. If no meta-analysis has been published, you could conduct one yourself. Finally, lacking any theoretical, applied, or empirical basis for setting a critical effect size, you could simply use a medium effect size and probably be all right. Lipsey (1989) found that the average effect size found across 186 meta-analyses of research on mental health and educational interventions fell right in the middle of the medium range.
The second question to ask is, What alpha level will I use? The smaller the alpha (for example, .01 versus .05), the lower the statistical power will be and the larger the sample you will need to achieve a given level of statistical power. By convention, most researchers set alpha at .05. The third question is, Will I use a one-tailed or two-tailed statistical test? A one-tailed test looks for either a positive relationship between the independent and dependent variables or a negative relationship, but not for both simultaneously. A two-tailed test looks for both. Use of a one-or two-tailed test depends on whether you have a directional or nondirectional hypothesis (see Chapter 5). A two-tailed test has less power than a one-tailed test, and so requires a larger sample size to achieve a given level of power. The final question is, What level of power do I want? Generally speaking, the higher the power, the better. One would certainly want power to exceed .50, giving a better than 50% chance of detecting an effect; Cohen (1992) suggests a level of .80.
Sample Sizes for Three Levels of Statistical Power for Detecting Small, Medium, and Large Effects of an Independent Variable for Alpha = .05
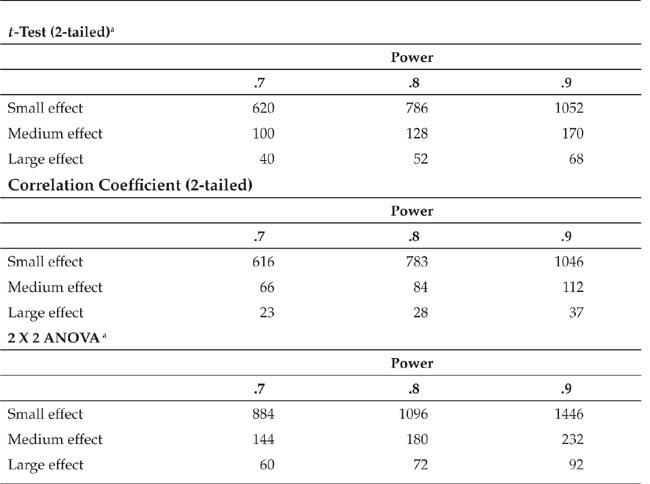
Note: Small effect is equivalent to a correlation of .10, medium effect to a correlation of .30, and large effect to a correlation of .50. Adapted from J. Cohen, 1988.
aNumbers indicate total sample size (not number per group) and assume equal-size groups.
To give you an idea about the relationship between sample size and statistical power, Table 16.2 gives the minimum total sample sizes needed to detect small, medium, and large effects at three levels of power. The table assumes that alpha equals .05, that two-tailed tests are used for t and r (ANOVA uses only a one-tailed test), and that there are equal group sizes for the t-test and ANOVA. Notice that a reasonable level of statistical power for a small effect requires an extremely large sample. Therefore, if only a small number of potential participants are available, it might not be very useful to test independent variables that are likely to have small effects. The sample sizes in Table 16.2 are taken from a book by Cohen (1988) that contains sample size tables for a variety of statistical tests, a wide range of critical effect sizes, and a wide range of power levels (see also Cohen, 1992).
A sample of a particular size represents a tradeoff between ease of data collection (smaller samples are easier to deal with in terms of time and money than are larger samples) and protection against making a Type II error (larger samples provide more protection than do smaller samples). Kraemer and Thiemann (1987) summarized these tradeoffs in terms of what they called six “facts of life”:
• |
The more stringent the significance level, the greater the necessary sample size. More subjects are needed for a 1 percent level test than for a 5 percent level test. |
Two-tailed tests require larger sample sizes than one-tailed tests. Assessing two directions at the same time requires a greater investment. | |
• |
The smaller the critical effect size, the larger the necessary sample size. Subtle effects require greater efforts. |
• |
The larger the power required, the larger the necessary sample size. Greater protection from failure requires greater effort. |
• |
The smaller the sample size, the smaller the power, i.e., the greater the chance of failure.… |
• |
If one proposes to [use] a sample size of 20 or fewer subjects, one must be willing to take a high risk of failure, or be operating in an area in which the critical effect size is large indeed. (p. 27) |
In previous chapters, we discussed several aspects of the mechanics of research: measuring variables (Chapter 6), controlling threats to internal validity (Chapter 7) and external validity (Chapter 8), manipulating variables (Chapter 9), and issues in conducting research in natural settings (Chapter 10). In this section, we look at some additional aspects of carrying out a study: the characteristics of effective research settings, effective instructions for participants, “debugging” the research procedures, running a data collection session, the post-experimental interview, and supervising research assistants.
An effective research setting is one that contributes to the validity of the data collected in it. In Chapter 10, we discussed some characteristics of an effective setting for field research; let us look now at four factors that contribute to the effectiveness of any research setting, be it a laboratory or field setting: coherence, simplicity, psychological involvement, and consistency (Aronson, Ellsworth, Carlsmith, & Gonzales, 1990).
Coherence. A coherent research setting is one that participants experience as a smooth, logical flow of events, all of which are focused on the purpose of the research. Participants must understand how each event they experience, such as performing a task or filling out a questionnaire, is related to the purpose of the research as it has been explained to them. We say, “as it has been explained to them,” because if the research procedures involve deception, the events must appear to be related to the cover story used to explain the research to the participants. A lack of understanding or feelings of ambiguity about their experience will raise participants’ levels of anxiety and start them wondering about what is happening to them. These feelings and thoughts will distract participants from what the researcher wants them to think, feel, or do, and so threaten the validity of their responses. For the same reason, the researcher should keep participants’ attention focused on the task at hand, such as by giving a well-focused explanation of the research task, and not bring up side issues such as by saying something along the lines of “Oh, by the way, we’re also interested in how this relates to X.” If X is important, it should be fully integrated into the explanation; if unimportant, it should not be mentioned to the participants.
The exception to maintaining a smooth flow of events throughout a data collection session is when a planned disruption is part of the research. Darley and Latané (1968), for example, investigated the variables related to people’s responses to emergencies by arranging for a simulated emergency to interrupt what participants thought was an experiment on some other topic. In this case, the disruption was intended to ensure the participants’ complete psychological involvement in the research, a characteristic of effective research settings that will be discussed shortly.
Simplicity. The apocryphal philosopher Murphy is credited with formulating one of life’s most basic laws: “Anything that can possibly go wrong, will go wrong.” A corollary to that law is that the more complex something is, the more there is that can, and so will, go wrong. Consequently, it is wise to keep research settings and the events that take place in them as simple as possible. For example, don’t use complicated electronic or mechanical apparatus for data collection when more simple means are available—it might make research participants nervous, and equipment failure means loss of data.
Don’t use complex social manipulations involving several confederates when simple alternatives are possible—if one confederate blows his or her lines or fails to show up for a research session, those data are lost. In addition, a complex set of events or a complex explanation of the study is likely to be confusing, and therefore distracting, to research participants. Aronson et al. (1990) propose a rule for testing the simplicity of a research setting: “Pretest the experimental rationale and procedure on one’s friends; if they react with blank stares, it is unlikely that a subject will be able to follow it, and some revision is in order” (p. 186).
Psychological Involvement. An effective research setting arouses and engages participants’ interest in what is happening to them and what they are doing; it gets them fully involved psychologically. Lack of involvement leads participants into distraction and boredom, resulting in low motivation and lack of validity in response to the independent variable. One way to make research involving is to make it realistic; this is one reason for using field settings even for experimental research. However, Aronson and Carlsmith (1968) distinguished between two forms of realism in research. A research setting has experimental realism if it leads participants to become psychologically involved in what is happening, if it forces them to take things seriously, and if it has an impact on them. A research setting has mundane realism if the events occurring in the setting are likely to occur in some natural setting. As we discussed in Chapter 8, many researchers consider mundane realism important to the generalizability of research results. However, Aronson and Carlsmith do not consider mundane realism sufficient for the creation of an effective research setting. As they see it, “The mere fact that an event is similar to events that occur in the real world does not endow it with importance. Many events that occur in the real world are boring and unimportant. Thus it is possible to put a subject to sleep if an event is high on mundane realism but remains low on experimental realism” (p. 22).
Mundane and experimental realism are independent concepts: A research situation might be high on both, low on both, or high on one but low on the other. For example, Milgram’s (1974) obedience experiments, described in Chapter 3, were low on mundane realism (people are almost never asked to give severe electrical shocks to other people) but high on experimental realism (participants’ psychological involvement in the research setting was shown by their stressful reactions to giving the shocks). Conversely, MacQuarrie, Tucker, Burns, and Hartman (2002) manipulated the ratio of known to unknown words presented on flashcards and assessed whether children’s retention for new vocabulary improved when a higher ratio of known words was included in the flashcard set. This is undoubtedly a realistic and mundane task, but one not likely to capture the children’s interest to a great degree. In contrast, consider Murray’s (1963) research in which college students took part in a discussion with a confederate posing as another student who challenged the participants to defend their cherished values and personal philosophies of life. Such an experience is both highly involving and likely to happen either in class or in discussions with other students, and it is therefore high on both experimental and mundane realism.
You have probably noticed that achieving a high degree of experimental realism can be at odds with the principle of simplicity. Milgram’s (1974) research, for example, used both a complex scenario involving a researcher, the participant, one or more confederates, and a fair amount of complex apparatus—a phony shock generator, a signaling system, tape recorders, hidden data recorders, and, in some experiments, an intercom system. Here, as in other aspects of research design, the researcher must decide on the appropriate tradeoff between two at least somewhat incompatible but desirable characteristics: Is the degree of experimental realism gained by an increase in complexity worth the increased likelihood of things going wrong and the attendant loss of data? One way to assess the tradeoff is by conducting detailed rehearsals and pilot studies, discussed later in this section.
Although experimental realism and participant involvement are important, Aronson et al. (1990) point out that participants should not be so involved in the situation that they overlook the independent variable: “For example, if the experimenter wants to arouse aggression in a [participant] by having an obnoxious confederate deliver an inordinate amount of distracting stimulation while the [participant] is working on a task, the task [should not be] so exciting and absorbing that the [participant] will … disregard the noxious stimuli” (p. 187).
Consistency. Finally, a good research setting provides a consistent experience for each participant. Everyone has the same experience up to the point at which the independent variable is manipulated so that everyone is in the same psychological state before being introduced to their condition of the independent variable. This consistency of pre-manipulation experience minimizes situational variables as possible sources of extraneous variance in the dependent variable, making the effect of the independent variable easier to detect. Each participant must also have the same experience within their condition of the independent variable, thereby ensuring the reliability of the manipulation, which contributes to its construct validity. Unreliable manipulations, like unreliable measures, contain a high degree of random error and so are less likely to be valid representations of the hypothetical construct that the experimenter is trying to manipulate. Consistency can be achieved by developing detailed scripts for the procedures in each condition of the independent variable, carefully rehearsing experimenters and confederates, and by monitoring their performance during data collection (see Chapter 9). As noted in Chapter 10, field research trades off some of this consistency for an increase in naturalism.
Instructions to research participants are an essential component of research. Instructions orient participants to what will happen during the data collection session, tell them how to perform research tasks and how to complete self-report measures, and can be used to manipulate the independent variable. To meet these goals effectively, instructions must be clear, must get and hold participants’ attention, and must be accompanied by procedures that check participants’ understanding of the instructions.
Be Clear. When writing instructions, whether they are to be delivered orally or in writing, strive to be as clear, complete, and simple as possible. One way to increase participants’ understanding of instructions is through repetition. Butler (1986; Butler & Jones, 1986) found that repetition of instructions dramatically improved research participants’ ability to correctly perform a variety of research tasks. A single presentation of instructions resulted in an average error rate of 55%, two presentations reduced the error rate to 26%, and three reduced it to 10%; further repetition resulted in no increase in performance accuracy. Examples also help. Butler and Jones (1986), using a difficult task, found that one presentation of instructions without an example resulted in an 80% error rate, whereas the error rate was 40% when an example was included. The clarity of instructions can be validated with Aronson et al.’s (1990) “blank stare” test: Read them to friends; if you get blank stares in return, you need to revise the instructions.
Get Participants’ Attention. Getting and holding participants’ attention involves the same behaviors as getting and holding attention in any conversation: maintaining eye contact, speaking clearly, emphatically, and fluently, and speaking with an appropriate degree of animation. In other words, talk to the participants, don’t merely read to them from a script in a monotone, and don’t mumble or stumble over unfamiliar words and phrases. The more familiar you are with the instructions, the easier it is to deliver them in a natural, conversational manner. Therefore, always rehearse instructions until you are thoroughly familiar with them and can deliver them clearly.
Check Participants’ Understanding. Don’t assume that participants understand even the best-designed and best-presented instructions; always check to ensure their understanding. At a minimum, solicit questions. However, do not say, “Do you have any questions?” or worse, “You don’t have any questions, do you?” Such inquiries invite a “No” response. It’s better to ask, “What questions do you have?” which implies that it is reasonable to have questions and that you expect them. When the instructions are complex, it is useful for the experimenter to ask questions that check the participants’ understanding or to demonstrate their understanding by performing the research task. Probes of this nature should focus on aspects of the instructions that are likely to be particularly troublesome to participants. These problem areas can be identified during pilot testing, to be discussed shortly.
“Debugging” is a term coined by computer programmers for the process of finding errors or “bugs” in programs. The term has been borrowed by researchers to refer to the process of finding problems in research procedures. Debugging is accomplished in three steps: the research proposal, rehearsal, and pilot studies.
The research Proposal. The research proposal is a detailed discussion of the background and hypotheses for a piece of research and a detailed description of the procedures to be used in testing the hypotheses (see Chapter 5). The debugging process starts by having colleagues read the proposal with an eye to finding any problems that the researcher overlooked. Colleagues might note problems in the derivation of hypotheses, they might be able to suggest important extraneous variables the researcher overlooked, they might know of better operational definitions, or they might be aware of problems with the materials or apparatus that the researcher intends to use. Colleagues’ suggestions on these and other potential problem areas can be used to fix the problems before time and effort are expended in setting up the research.
Rehearsal. Once the research procedure looks good on paper, it’s time to try it out in practice, using rehearsals or “dry runs” that do not include research participants. It can be useful to think of data collection as a stage play with the research procedure as the script. As with a theatrical rehearsal, the research rehearsal should proceed as if it were the real thing, with the researcher giving instructions out loud, walking around the room distributing questionnaires, operating equipment, and so forth, and with confederates playing their roles, all as specified in the research procedures. Rehearsals provide the researcher with practice so that data collection sessions proceed smoothly and with the opportunity to find procedural problems not apparent in the research proposal. For example, as a graduate student, one of us once worked as an experimenter on a project that required the operation of two pieces of equipment simultaneously. This was not a problem in itself, because it was easy to operate each device with one hand. However, when rehearsing the procedure, it turned out that the laboratory was arranged (from a previous research project) so that the two pieces of equipment were 10 feet apart! Needless to say, the experiment was put on hold until the lab was rearranged. Rehearsals should continue until the entire procedure runs smoothly without any “blown lines,” forgotten “stage business,” overlooked “props,” or other disruptions.
Pilot Studies. A pilot study is a preliminary piece of research conducted with a sample of research participants drawn from the study population. Pilot studies can be used for several purposes. First, they can consist of observational or correlational research conducted to determine if it would be worth the time and effort to conduct an experiment. For example, recall Middlemist, Knowles, and Matter’s (1976) study of the effect of invasions of personal space in men’s rooms on anxiety, described in Chapter 3. Before they designed their rather complex experiment involving both a confederate and a hidden observer, they conducted an observational study to determine if naturally occurring invasions of personal space were correlated with latency of urination. Because the correlational data were consistent with their hypothesis, they went ahead with an experimental test of the causal role of personal space invasion. The pilot study also gave the researchers the opportunity to interview participants to determine the participants’ feelings about being observed under such circumstances.
Second, pilot studies can be conducted to test the validity of experimental manipulations. The dependent variable in such pilot studies is a measure of the hypothetical construct that the researchers want their manipulation to affect. Recall, for example, Seligman, Finegan, Hazlewood, and Wilkinson’s (1985) pizza delivery study described in Chapter 10. They intended their explanations of why the delivery driver was early or late to manipulate customers’ perceptions of whether the early or late delivery was due to the actions of the driver or due to situational factors. They tested the effectiveness of the manipulation by approaching people in their university’s library and asking them to rate the explanations as to whether they appeared to reflect characteristics of the delivery driver or of the situation. Because this pilot manipulation check supported the validity of their procedure, they used it in their study.
Finally, pilot studies are conducted as a final test of research procedures prior to beginning data collection. Such pilot studies are useful because the researcher can solicit the participants’ cooperation in the process by telling them at the outset that they are assisting in a test of the research procedures and asking them to note any aspects of the procedures they find difficult to understand and any tasks they find difficult to perform. The researcher can also interrupt the course of events at various points to collect information from participants. For example, the researcher can give pilot participants the instructions to be used in the study and then ask whether they understand what they are to do or if they expect to have any difficulty in carrying out the instructions. Pilot studies can also help to detect any demand characteristics present in the research setting or procedures—aspects of the setting or procedures that “push” participants to respond, or to avoid responding, in certain ways. For example, Aronson et al. (1990) describe a pilot study for an experiment in which college students were asked to look at photographs of three men and pick out the one who was Jewish:
[Participants] became upset, arguing that it was impossible to recognize Jews on the basis of appearance.… On the basis of the information gained from these pilot [participants], the experimenters changed the test so that [the participants] were asked to pick out schizophrenics rather than Jews, and from then on the experiment ran smoothly. (p. 234)
When such problems arise in a pilot study, ask the participants for suggestions on how to improve the clarity of the instructions or the nature of a problematic task. You can also develop probes to test participants’ understanding of instructions for problem areas that cannot be changed.
Pilot studies also give the researcher an opportunity to determine whether the participants are interpreting things as intended. For example, does a questionnaire item have the same meaning to them as to the researcher? Ross and Allgeier (1996), for example, found that male college students interpreted some items on a frequently used sexual experiences questionnaire to have as many as six possible meanings each, some of which were contradictory. For instance, 37% of the participants interpreted the question “Have you ever had a women misinterpret the level of sexual intimacy you desired?” to mean the woman overestimated the man’s desired level of sexual contact whereas 25% interpreted it to mean the woman underestimated the desired level of contact.
Participants might also interpret the procedures used to manipulate the independent variable in a different way from that intended by the researcher, resulting in an invalid manipulation. For example, Dane (1990) tells of a study he was conducting in which he wanted to see if physiological arousal affected men’s perceptions of women’s attractiveness. He manipulated arousal by sitting either 3 inches from the participants in the high-arousal condition or across the room from participants in the low-arousal condition. He got what seemed to be very strange results that made it appear that participants in the high-arousal condition were not paying attention to the photographs they were supposed to be rating. Therefore, as Dane (1990) tells the story,
I called some of [the participants], interviewed them, and discovered that indeed many of them were not concentrating on the women in the photograph. It seems that my results were caused by the participants’ beliefs about what was being studied. Most of the participants in the high arousal condition [were uncomfortable] because I was sitting very close to them.… They admitted to completing the ratings as quickly as they could so that they could get out of the room. (p. 210)
Pilot studies also let researchers know how much time is required for the research tasks and the data collection session as a whole. Researchers might find, for example, that a task takes participants more time to complete than was anticipated, so the research session must be lengthened. To fit a research session into their schedules, participants must be informed well in advance of the total time they will be asked to donate. Total time is also important when participants come from subject pools. In such circumstances, students are often given credit for research participation in terms of the amount of time they contribute; researchers have an obligation to these students to provide the correct amount of credit.
The last few sessions of the final pilot study conducted should function as “dress rehearsals” for the data collection sessions. As in a theatrical dress rehearsal, these sessions should be conducted without interruption except to answer participants’ questions. These complete run-throughs allow a final smoothing of the rough edges of the procedures. Dress rehearsals should continue until the experimenter and any confederates can play their roles with minimal error.
A common question that arises concerning pilot studies is that of the number of research participants to include. There is no absolute answer to this question; it depends on the goal of a particular study. If you are doing preliminary observational work, as Middlemist et al. (1976) did, or checking the validity of a manipulation, as Seligman et al. (1985) did, you want to have enough data to provide enough statistical power to be able to have confidence in your results. The number of participants therefore depends on the minimum effect size that you consider important for your goal. When collecting information from participants to improve procedures, you should probably keep collecting data and modifying procedures until participant comments indicate that no additional substantial improvements can be made.
In planning a research project, be sure to budget sufficient time for pilot studies. Note the use of the plural—studies, not just one study. Piloting is an iterative process: A problem is identified, a fix is implemented, and then the new procedure must be tested. A number of iterations of the process might be required before the entire procedure runs smoothly.
In this section, we want to remind you about some aspects of conducting a data collection session. First, be sure to dress neatly. A suit or dress is not required, but at the other extreme—a dirty sweatshirt and tattered jeans hardly presents a professional appearance. People do judge you by the clothes you wear, and if your attire does not convey to participants the impression that you consider the research to be serious business, they will not take it seriously either. Next, be sure to arrive at the research site well ahead of time. Remember many participants will be early and may be confused if the experimenter is not there to greet them. Also, arrive completely prepared to conduct the research. If you are using questionnaires, check the number on hand sufficiently far in advance (several days, if necessary) to ensure that you have enough available. Don’t forget to bring enough pencils and, if they are used, answer sheets. If you are collecting data on computers, have all machines up and running before the participants arrive. If you are using any apparatus, such as an EEG, get to the research site early enough to thoroughly test the equipment and to calibrate it, and take care of any other routine maintenance before the participants arrive.
Finally, be sure to treat your research participants politely, unless the experimental manipulation calls for something else. Remember, these people are donating their time to help you with your research. Greet all your participants, answer their questions completely and courteously (even questions about things you’ve already covered several times), and thank them when their participation ends. Never let a data collection session run over the allotted time; your participants probably have other obligations. If you can’t make a scheduled session, notify your participants as far in advance as possible if you have their phone numbers or electronic mail addresses. Otherwise, arrange to have someone meet them at the research site and explain the problem. At a minimum, have someone leave a polite note. If participants were to receive some form of credit, be sure to inform them how to obtain it and promptly submit any paperwork you need to ensure they receive that credit. In short, treat your research participants as you would like to be treated in the same circumstances.
The purpose of a post-experimental interview is to uncover any ethical or methodological problems with the research and to educate the participant about the purpose of the study. If your study has the potential for methodological or ethical problems, at the close of a data collection session, you should conduct a post-experimental interview with the participants. This interview is also appropriate for those studies that have complex procedures or involve deception. This interview has four functions: ethical, educational, methodological, and discovery. This section will examine each of these functions and then outline a procedure for the interview.
The ethical Function. As discussed in Chapter 3, the researcher has a number of ethical obligations to research participants after data collection. Two of these obligations are fulfilled as part of the post-experimental interview. First, the researcher must alleviate any adverse effects of the research, such as by reassuring participants whose self-esteem may have been threatened by the research procedures. Second, if deception was used, the researcher must debrief the participants, explaining the nature of the deception and the reasons for it. You might want to go back and review the section in Chapter 3 on debriefing to refresh your memory on these topics.
The educational Function. As noted in Chapter 3, the researchers’ post-research ethical obligations include educating research participants about the nature of research in general and of the research in which they participated in particular. Because this educational benefit is frequently the only direct benefit received by participants drafted from subject pools, researchers have a special obligation to those participants. Sieber (1992) suggests that the educational function of the post-experimental interview include
a brief, nontechnical presentation on (a) the purpose of the study, (b) the relation of the purpose to the condition(s) in which [they] participated, (c) what is known about the problem and what hypotheses are being tested, (d) the dependent and independent variables, and (e) why the study is of theoretical or practical importance. At this time, [participants] also might be given a one-or two-page description of the topic and the research, expanding on what they had already been told. (pp. 40–41)
The researchers should also solicit questions about the explanation, make themselves available to participants who want to discuss the research further, and provide the name and phone number of someone to call if they have questions later. Not all research participants, especially those who take part in studies using group-administered questionnaires, will be motivated to stay and listen to an oral presentation about the research. In this and other cases of minimal-risk research, a handout might be sufficient to meet the educational obligation.
Although researchers generally believe that they present good debriefings, participants frequently complain that debriefings are inadequate. They say that the debriefings they have experienced were too brief, difficult to understand, used terms that were unfamiliar to them, and did not put the research into a context understandable to them, such as the potential applications of the research results (Brody, Gluck, & Aragon, 2000). Brody et al. also found that participants reported that the researchers treated the debriefing process as a burdensome obligation rather than as an opportunity to educate participants and that the researchers appeared to be uninterested in answering questions. Therefore, regardless of whether the debriefing is oral or written, pretest it with colleagues and pilot study participants to ensure that it is clear and complete, present it in a professional manner, and be sure to encourage participants to ask questions.
The methodological Function. The post-experimental interview can be used to administer manipulation checks and to assess the degree to which participants were affected by demand characteristics or misperceptions of the research situation or were suspicious about any deception that was used. Although pilot studies can provide researchers with information about the effectiveness of their manipulations in general, manipulation checks conducted after a research session can assess whether the manipulation was effective for individual participants. In Chapter 7, we discussed demand characteristics and noted that they can reduce the validity of participants’ responses. Misperceptions of the purpose of the research can also reduce response validity. To the extent that participants are suspicious of deception or otherwise believe that something is “not right” about the research situation, the manipulation of the independent variable is invalid.
The post-experimental interview can therefore help the researcher sort out effective research sessions—in which everything went as intended—from ineffective sessions in which something went wrong. What should you do about data from “spoiled” sessions? If the post-experimental interview suggests that the manipulation of the independent variable did not work as intended, then you should probably discard the data from that session. However, if data from a substantial number of participants must be discarded on this basis—say, more than 20%—there may be something wrong with the design of the research, and you should try to find alternative designs that are less susceptible to demand characteristics, misperceptions, or suspiciousness. Wilson, Aronson, and Carlsmith (2010) recommend that researchers set specific criteria for excluding participants’ responses before data collection begins to ensure objectivity in the process. For example, decide in advance the factors that indicate if research participants are unduly suspicious of a deception.
The discovery function. Post-experimental discussions with research participants can sometimes suggest new hypotheses to researchers or lead them to look at old hypotheses in new ways. At the conclusion of a study about the role of spatial context of visual search, for example, Lleras and Von Mühlenen (2004, Study One) interviewed participants about the strategies they used to search for the target stimulus, a rotated black letter T, among a group of rotated black letter Ls. Some participants reported using an active strategy of searching for the letter, others reported using a passive strategy of waiting for the letter to “pop out” to them. In a follow-up study, Lleras and Von Mühlenen (2004, Study Three) tested the effectiveness of these two strategies by instructing participants to use either an active or passive search strategy. It is always useful to find out what your participants think about your research and the hypotheses you are testing; unencumbered by the blinders of accepted theory and methodology, they can provide new and useful insights.
Conducting the interview. Four functions are integrated into three steps that make up the post-experimental interview (Wilson et al., 2010). We will just outline the steps here; see Wilson et al. (2010) and Mills (1976) for detailed guidance. The first step is probing for effects of demand characteristics, suspiciousness, and misperception. Wilson et al. (2010) suggest that this step proceed by using three increasingly specific questions. First, ask participants what questions they have about the study or the procedures used. Participants’ questions can give hints about problems that the researcher can pursue with his or her own questions. The answers to the participants’ questions should be complete and truthful, thereby contributing to the educational function. Next, the researcher should specifically ask if the participant “found any aspect of the procedure odd, confusing, or disturbing” (Wilson et al., 2010, p. 76). If this probe does not bring out any problems, then the researcher can ask, “Do you think that there may have been more to this experiment than meets the eye?” (p. 76). Wilson et al. point out that almost everyone will answer yes to this kind of question (it is obviously high on demand characteristics). Therefore, you must be careful to sort out problems that are plausible, given the nature of the research, from responses that are likely given for social desirability reasons.
Participants’ responses to these probes can be used as a lead-in to the second step, explaining the research. If deception is used, the explanation will combine the ethical function of debriefing with the educational function of providing participants with information about the research (Mills, 1976). For example, Smeets, Stelgen, Ost, Jelicic, and Merckelbach (2009) studied what residents of the Netherlands recalled about the assassination of a well-known Dutch politician, Pim Fortuyn. This event was covered extensively in both national and international news, but none of the video footage showed the actual moment Fortuyn was shot. Smeets et al. asked participants if they had seen such footage; if they reported doing so, it was a false memory. During the debriefing, Smeets et al. provided detailed information about research on false memories. Those participants who reported seeing the footage were then given the opportunity to explain why they had reported seeing the nonexistent images; most reported that they misunderstood the question and thought it referred to images that did exist. Finally, Smeets et al. offered examples of plausible reasons for the false memory and probed whether participants were still convinced they had seen images of the actual assassination. Such extensive debriefing is important for this type of research as inaccurate memories can persist. However, as already noted, in nondeceptive research, the oral explanation can be brief and supplemented with a handout.
The third step is soliciting participants’ help in improving the research. Ask them for their comments on and criticisms of the research; as already mentioned, these comments can suggest topics for future research and may reveal methodological problems that have not yet come out in the interview. Wilson et al. (2010) note that this procedure can allow participants to voice qualms about the procedure or any deception that was used; you can then take further steps to address any adverse effects as Smeet et al. (2009) did. Finally, ask the participants not to discuss the research with anyone who might take part in it. As discussed in Chapter 7, knowledge of hypotheses or procedures can lead to reactivity and invalidate participants’ responses. Explain the reasons for confidentiality clearly and completely; such candor both educates participants about the problems of research and motivates them to comply with the request. The effectiveness of such requests is a matter of some debate, but Wilson et al. (2010) suggest that some of the noncompliance problem can be alleviated by telling participants what they can say if friends ask them about their research experience. For example, the experimenter could tell participants that it’s okay to describe general or superficial aspects of the procedure. Giving participants something explicit to say, such as “I watched a videotape and filled out a questionnaire about what I saw,” spares them the embarrassment of having to give friends an evasive response, such as “I’d prefer not to discuss it.” It also relieves them of the problem of having to invent an uninformative description of the experiment.
If two or more participants take part in the same research session, Aronson et al. (1990) recommend that they be interviewed separately. They note that it is difficult to assess two people’s reactions simultaneously, thus leaving the door open to the researcher’s missing a crucial word, gesture, or tone of voice. Also, someone might feel inhibited about asking a question or voicing a concern that the other people being interviewed don’t mention. In addition, in deception experiments participants might be embarrassed by being dehoaxed, and perhaps in their minds being made to look foolish, in front of a peer. Finally, although we have been discussing the post-experimental interview in terms of a face-to-face interaction, written questionnaires can also play a role, especially as a starting point for further discussion. Participants also might be more willing to make comments on questionnaires, especially anonymous questionnaires, than in a face-to-face conversation. For example, politeness might inhibit someone from saying something along the lines of “That was the stupidest cover story imaginable” in an interview, but the person might feel free to express critical comments in writing. Candor can be enhanced by having someone not associated with the experiment, such as a departmental secretary or office assistant, administer and collect the questionnaire.
So far, our discussion of research procedures has assumed that you, the person who designed the study, will be the person who collects the data. Sometimes, however, you might have research assistants who collect data for you. If so, you will be responsible for your assistants’ training in preparation for data collection and for how they treat research participants. In training your assistants, you must ensure that they are completely familiar with the research equipment and procedures and are able to answer participants’ questions. It can be useful for you to take the role of research participant and have your assistants collect data from you. This procedure lets you both assess your assistants’ levels of training and, by looking at the study from a participant’s point of view, catch any unforeseen problems with the procedures and materials. Also, ask your assistants any questions that participants might bring up so that you can see how well your assistants can answer them. You might also want to create problems for your assistants, such as by hiding an electronic timer left on a table, to see how well they can deal with unanticipated “glitches.”
When your assistants interact with research participants in pilot studies and during data collection, you should monitor their performance, both to ensure that they are following the correct research procedures and to ensure that they are treating participants courteously. It is best to do this directly, such as by sitting in the corner of the room when a group-administered questionnaire is being administered or by observing through a one-way mirror. If direct observation is not possible, you could interview research participants about your assistants’ behavior after explaining your supervisory role or by using a questionnaire. Make these assessments fairly frequently at the outset of data collection and periodically thereafter.
When discussing your observations with your assistants, be sure that your feedback is constructive. Be polite, point out what they did well in addition to any problems you noted, and give them specific guidelines for improving their performance. Always bear in mind that in this situation you are a teacher as well as a researcher, so you have an obligation to provide your assistants with an effective learning experience. Box 16.1 provides some guidelines for supervising research assistants.
• |
Set clear goals and objectives, such as the number of data collection sessions each assistant will conduct during a semester. |
• |
Set clear expectations for behavior, such as dress, punctuality, and interactions with research participants. |
• |
Clearly define each person’s role in the research process, such as who collects data, who enters data, who analyzes data, who supervises whom, and so forth. |
• |
Compile a laboratory manual that explains policies and procedures, give one to each assistant, and hold a meeting to check their understanding of its contents and to answer questions. Malfese et al. (1996) provide a sample outline for a lab manual. |
• |
Have a system for communicating with and among assistants. A periodic meeting can be very useful. |
• |
Being a researcher will be a new (and perhaps stressful) role for most assistants, so monitor them carefully for signs of uncertainty or stress and provide appropriate guidance. |
• |
Be alert for signs of conflicts between assistants, and take immediate action to resolve them. |
• |
Provide assistants with periodic performance feedback so that they know what they are doing correctly and incorrectly. Provide corrective feedback tactfully. |
Source: Adapted from Malfese et al. (1996).
Researchers are constantly looking for ways to collect data from a wide range of participants at minimal cost and the Internet (or World Wide Web) offers many possibilities for doing so. As Birnbaum (2001) notes, researchers can collect online data from participants who come to their laboratory or from people all over the world. Researchers are using online data collection procedures to answer an increasingly wide range of research questions. One common approach is to adapt materials developed for offline research into an online study; for example, researchers use this translational approach to convert paper and pencil personality measures to online surveys (Skitka & Sargis, 2005, 2006). For this type of Web-based research, potential participants are directed to a site where they see a page that describes the research. Interested respondents then click to go to a new page and give their informed consent to participate. Next, they are directed to the pages where the data are collected in the form of either a survey or an experiment. Once data are submitted, the debriefing page is available. Because most Web-based research takes this form (Skitka & Sargis, 2005, 2006), the data collection issues discussed in this section focus primarily on this type of research.
However, researchers also use novel approaches to testing research hypotheses using the Web that do not simply mirror procedures used in non-Internet-based research. For example, Rentfrow and Gosling (2003) downloaded the online music libraries of 10 individuals from each of the 50 United States. Seven judges then categorized the songs in these libraries by music genre; these ratings were found to be consistent with people’s self-reported music preferences. Researchers also study questions such as how changes in technology and our increasing use of Web-based social interaction affect people’s thoughts, feelings and behaviors; this phenomenological approach to Web-based research addresses a unique set of questions that did not arise before the advent of Internet-based communication (Skitka & Sargis, 2005, 2006). For example, Bacigalupe (2011) discussed how communication technologies, such as Facebook and Twitter, are changing the ways health care professionals interact with their patients in an environment that is asynchronous and not limited by geography. The methodologies used to conduct this type of research are similar to those used for other types of observational research, discussed in Chapters 2 and 10. Similarly, the procedures used in for coding qualitative research data, discussed in Chapter 14, can be applied to content analysis of information posted on the Web. Therefore, these topics are not discussed in detail in this chapter.
In this section, we present some of the issues involved in using the Internet for data collection: the validity of data collected over the Internet, the advantages and disadvantages of Web-based research, participant recruitment over the Web, and ethical issues in Internet research. This section will not deal with programming and other technical issues; those are well-covered in a number of sources (for example, Birnbaum, 2010; Fraley, 2007). Moreover, there are a number of commercial data collection programs, such as SurveyMonkey and MySurveyLab, available to assist researchers with online data collection. The quality of these applications continues to improve, as does their ease of use, so relatively few programming skills are needed to conduct most online research.
A question that concerns Internet researchers is that of the validity of their data. Not only are those data being collected by a novel means that could affect results, but the demographic characteristics of participants often differ from those of college students, the most commonly used research population (Krantz & Dalal, 2000). In some situations, people behave differently on the Internet than in in-person interactions, primarily by being less inhibited and more self-disclosing (Joinson, 1999).
Several studies have addressed the question of data validity by examining the extent to which the results of Web-based studies match those of laboratory studies. The available research suggests that data from Web-based surveys are similar to that obtained from high quality paper-and-pencil studies and may be superior in some ways (Skitka & Sargis, 2006), an issue we return to later. Similarly, McGraw, Tew, and Williams (2000) found that the quality of data collected using Web-based experiments was similar to that collected in traditional lab experiments. This equivalence was found even for studies requiring precise measurements, such as response time, that might be affected by characteristics of the users’ computers. Krantz and Dalal (2000) concluded that the results of all forms of research conducted over the Internet—surveys, correlational studies, and experiments—converge very well with the results of their laboratory counterparts. It would therefore seem that data collected in well-designed Internet research is as valid as data collected by traditional means.
Researchers who use the Internet to collect data have noted a number of advantages that the medium provides. These include economy and ease of data collection, access to nonstudent and special populations, the potential for increasing some aspects of the internal validity of research, and the public nature of the research process.
Economy and ease of data collection. Just as the introduction of the desktop computer was supposed to create the paperless office, data collection using the Internet (and data collection via computers generally) allows for paperless surveys and other forms of research. When researchers use computers to collect data there is no need for physical copies of surveys or data record forms: Participants enter their responses directly into a computer file, eliminating printing costs. Furthermore, the data files can be transferred directly to the computer program used to analyze the data, thereby eliminating the errors that can creep in when data are transcribed from paper records to computer files. Informed consent can be recorded online, eliminating the need for paper copies, and instructions can be presented on the computer screen. The postage costs incurred by mailing surveys are also eliminated with Internet research. Researchers who collect interview data on the Web rather than though telephone surveys also realize significant cost savings (Kraut et al., 2004).
The Internet can also make data collection easier for participants (Reips & Krantz, 2010). Because Web pages are usually available 24 hours a day, 7 days a week, participants can take part in the research when and where it is convenient for them to do so; for example, McGraw et al.’s (2000) participants completed their study at all times of day and night. Researchers benefit from online research because they do not need to schedule specific blocks of time for data collection, and they do not waste time waiting for late or no-show participants. Many studies require collecting data from one participant at a time, so inperson data collection may have to be carried out over a long period of time, reducing the timeliness of the research results. In contrast, the Internet can provide a large number of participants very quickly (Anderson & Kanuka, 2003). As Birnbaum (2000) reported, “Compared to my usual research, which typically takes 6 months to collect data for 100 college students, it was quite pleasant to collect 1224 sets of data in 4 months and 737 in the next 6 weeks” (p. 25). Internet research may be especially beneficial to researchers at small colleges and universities, where the potential number of research participants is small, and to researchers at institutions that do not have subject pool systems.
The Web offers possibilities for ensuring quality data collection that are not available with traditional methods. For example, Web servers can track the time participants take to complete a questionnaire or even individual questions on a survey. Researchers can then determine whether respondents could have reasonably read and answered the question within that time frame. Researchers can also control the amount of time participants have to complete a study or a section of a study; this procedure prevents participants from suspending their participation and returning to the study later (Nosek, Banaji, & Greenwald, 2002). Finally, some data collection applications prompt users to answer survey questions they had skipped or to which they provided out-of-range responses (such as when someone accidently types their age as 0 rather than 20); this feature can improve the overall quality of the data. In addition, if desired, surveys on which important information is excluded can be rejected (Schmidt, 1997).
Access to research participants and other data. The most common population of research participants for behavioral science research continues to be college students (Arnett, 2008) and this is also true for Internet-based studies. Even so, the Internet allows researchers to extend their research populations beyond college students; as a result, compared with traditional research, a lower percentage of Internet studies uses college students (Skitka & Sargis, 2006). Internet research participants tend, on the average, to be older than college students, to have more diverse educational backgrounds, and to exhibit more geographic diversity (Gosling, Vazire, Srivastava, & John, 2004). In addition, purposive sampling of listservers and newsgroups can provide access to populations that are often hard to reach, such as lesbians and gay men, people with disabilities or chronic diseases, and so forth. As Skitka and Sargis (2006) note, a vast range of special interest groups are accessible on the Web, providing researchers with access to populations that are otherwise difficult to reach.
In addition to using the Web as way to collect new data from participants, researchers are continuously finding new and creative ways to use information already available online. This information includes written narratives, such as those posted on blogs, and people’s responses to those narratives; photographs, music, and videos posted to the Web; and the processes people use during Internet communication (Mazur, 2010). For example, Fullwood, Sheehna, and Nicholls (2009) conducted a content analysis of MySpace blogs, including people’s stated motivations for blogging, the level of formality the blogger used, and the emotional tone of the postings. As Miskevich (1996) notes about sources such as blogs and chat rooms, “These discussions are like a golden egg laid in the lap of the social scientist—open and candid discussions of alternative religious beliefs and behavior, discussions of different sexual proclivities, explorations of political beliefs and their expression in certain contexts” (p. 241). Researchers also can use participant observation techniques to study any number of online social processes. For example, by observing participants in massively multiplayer online role-playing games, such as World of Warcraft, researchers can determine the extent to which virtual social interaction mirrors that found in face-to-face settings (Utz, 2010). However, such observational research can raise ethical questions concerning invasion of privacy and voluntary participation in the research, an issue we return to shortly. Moreover, as with other types of research, the procedures used to sample Internet content can affect the generalizability of the obtained results (see Mazur, 2010, for a discussion).
Potential for increased internal validity. As we discussed in Chapter 7, demand characteristics and experimenter effects can be a problem for the internal validity of research. However, when data are collected over the Internet, research participants do not interact with an experimenter, removing the problems that arise when experimenters treat participants differently or inadvertently emit cues that could affect participants’ responses (Reips, 2000). For example, Maronick (2011) recruited participants at a shopping mall and showed them advertisements. He found that the researcher was more likely to influence participants’ ratings when those ratings were assessed in face-to-face interviews rather than online. Similarly, data collected in the absence of an experimenter and other participants may be less vulnerable to the social desirability response bias, especially when the participants are confident of the anonymity or confidentiality of their responses (Binik, Mah, & Kiesler, 1999). For example, Joinson (1999) found a substantial reduction in scores on a standard measure of social desirability response bias when college students completed the scale over the Internet compared to paper-and-pencil administration, and Bailey, Foote, and Throckmorton (2000) found that college student respondents to an Internet survey were more likely to report sensitive behaviors, such as same-sex sexual contact, than were college student respondents to a paper-and-pencil survey. Finally, as we discussed earlier, studies that are highly involving generally produce better data than less involving studies. Web-based research that incorporates rich multimedia components can hold participants’ attention and increase their interest compared to paper-based materials. Stimuli that are life-like are also more ecologically valid than stimuli presented thorough traditional paper-and-pencil formats (Gosling & Johnson, 2010).
Public research methods. In Chapter 1, we noted that one of the key values of science is that research methods are made public so that everyone can examine them and draw their own conclusions about the validity of those methods. Reips (2000) points out that Web research is the ultimate in public research: Anyone can visit a research site and experience for themselves exactly how data were collected and see the exact nature of experimental stimuli and the exact wording of survey questions. This situation stands in sharp contrast to other forms of research, in which the reader of a research report is (of necessity) given only a brief description of the methodology employed. Even after data collection has been completed, a site can be maintained for a certain length of time after the results of the research have been published so that interested persons can visit it. Similarly, when the research study is based on Web content, such as Gosling et al.’s (2004) study of downloaded music libraries, interested people can surf the Web and review the types of information used as data for the research.
Although using the Internet for research provides a number of advantages for researchers, it also has its disadvantages. These include biased participant sampling, limits on the types of experimental stimuli and response modes that can be used, lack of control over the data collection environment, participant attrition, and the potential for sabotage of the research project.
Participant sampling. As noted earlier, the Internet offers the opportunity to broaden the psychological research base beyond college students samples. However, it is important to recognize that most online studies are typically based on convenience samples and, as such, do not constitute a representative sample of the population. As Skitka and Sargis (2006) note,
[a]lthough Internet samples would seem to represent a leap forward over the heavy reliance of psychologists on college student samples, psychologists may be simply replacing one flawed sampling procedure with another when they turn to convenience samples of Web users. People who use the Internet are not representative of the general population, nor are online special interest groups representative of their specific groups. (pp. 545–546)
For example, respondents in U.S. Internet samples over-represent Whites, young people, and parents, compared to the general population (Kraut et al., 2004). Moreover, perhaps because of the cost of computers and Internet access, the poor and working class are likely to be underrepresented in Web-based samples, but probably no more so than in other convenience samples (Fraley, 2007). These findings suggest that the sampling biases in Internet research are no different than those deriving from traditional research methods. Researchers can, of course, apply the sampling procedures, described earlier in this chapter, to an identified Internet population. However, because certain groups are consistently underrepresented in Internet surveys, they will also be underrepresented even in random samples of Internet users (see Couper, 2000, for a discussion).
Limits on experimental stimuli and response modes. In the laboratory, researchers can manipulate the stimuli that participants respond to in a variety of ways, including the use of visual materials, sounds, the presence and actions of others, odors, touch, and pain. Of these, only visual and auditory stimuli can currently be presented by computers (Skitka & Sargis, 2006). Similarly, in the laboratory, researchers can observe and measure a variety of participant responses to stimuli, including vocal and written responses, facial expressions, eye and other body movements, brain activity, and behavior toward confederates. Many of these variables cannot be measured using Internet research, although researchers’ ability to do so keeps improving. For example, interactive online sites, such as massively multiplayer online role-playing games, can be a vehicle for studying behavior, and vocal and non-verbal behaviors can be captured through video conferencing or Webcams. Technological advances will likely continue to improve the quality and quantity of the available responses.
Lack of control over the data collection environment In laboratory study, researchers have complete control over the situations in which they collect their data. Field researchers can choose their research settings and sometimes can control the specific circumstances under which they collect their data. Internet researchers, however, have very little control over the data collection environment (Reips, 2000). Internet participants may be at home, at work, at school, or in a public library; they may be alone or with others; they may be in a tranquil setting or one replete with distractions. From a technological perspective, variations in the computer hardware and software used by research participants can cause variations in the fidelity of graphics, color, and sound reproduction. Users may need plugins to view animated graphics or sound and, even if these can be downloaded for free, users may be unwilling or unable to do so (Fraley, 2007; Plous, 2000). All these factors can affect the accuracy of the data collected; however, as discussed earlier, there are ways to address many of these potential problems.
Another control issue in Internet research derives from the lack of interaction between the researcher and the participant. Although, as we noted, this lack of interaction can reduce demand characteristics and experimenter effects, it also prevents participants from asking questions concerning their roles in the research. Similarly, researchers cannot query participants to determine if they understand the instructions for the study, nor can they observe participants’ behavior to see if they are following the instructions (Birnbaum, 2000; Reips, 2000). Moreover, if participants find the experimental instructions confusing, they are likely to discontinue participation or, if they continue, are more likely to make errors (Nosek et al., 2002). Consequently, instructions for Internet studies must be extremely clear and carefully pretested to identify and remove any sources of ambiguity and misunderstanding; the procedures described earlier in this chapter can easily be adapted for this purpose.
A final potential problem is that participants can, either intentionally or inadvertently, participate in a study more than once. For example, Pasveer and Ellard (1998) had one participant who submitted a questionnaire 10 times. There are several technological solutions to this problem, each of which has its advantages and disadvantages (Reips, 2000; Smith & Leigh, 1997). Some data collection applications, such as SurveyMonkey and MySurveyLab, offer ways to prevent duplicate responding. In addition, careful design of the data collection site might prevent some such problems. Pasveer and Ellard (1998) noted that participants might expect some form of feedback after submitting their data and, if no feedback occurs, resubmit the data thinking that a network error prevented the researchers’ computer from receiving the data. Pasveer and Ellard therefore recommend that researchers send some type of feedback, even if only a “thank you” note, when participants submit data.
Participant attrition. The traditional research situation, in which the researcher and participant interact face-to-face, contains a number of what might be called binding factors that commit the participant to completing the study. Most of these factors—such as having agreed to participate in the research, being in a setting (the laboratory) that reduces distractions, the psychological if not physical presence of the researcher, and the need for course credit—are absent in much Internet research (Reips, 2000). Consequently, Internet participants may be more likely to fail to complete a study than traditional research participants: In a survey of online researchers, Musch and Reips (2000) found attrition rates that ranged from 1% to 87%, with an average of 34%. Hoerger (2010) estimated that 10% of college students drop out of survey research almost immediately and that the dropout rate increases by about 2% for every 100 items added to the survey.
Participant attrition is also higher for online longitudinal research than for traditional longitudinal research. One reason is that, because people more frequently change email addresses than phone numbers or postal addresses, it is difficult to track participants over time on the Internet (Kraut et al., 2004). It is therefore very important for Internet researchers to design studies that capture participants’ interest; they also should find ways to that screen out uncommitted participants (Reips, 2000). Researchers conducting longitudinal research also should consider collecting additional types of contact information, such as a phone number or secondary email address, from participants.
Sabotage. As we noted above, individuals may unintentionally provide multiple responses to a Web-based study. Sometimes, however, respondents purposefully respond multiple times, resulting in tainted data. Hackers—people who break into and modify Web sites—can cause two types of damage in a research Web site. They can alter experimental stimuli or survey questionnaires, weakening the validity of the independent variable, or they can modify data either as it is collected or after it is stored, limiting the validity of the dependent variables. Saboteurs may be motivated by malice or by a deviant sense of humor but, regardless of their motive, Internet researchers must take care to ensure that all possible safeguards are in place to ensure quality data and check the Web site periodically to ensure that no vandalism has occurred (Hewson, Laurent, & Vogel, 1996). Researchers also should take steps to prevent unauthorized access to data while it is being transmitted to the research site and to the data after it has been stored on Web servers. Thiele and Kaczmirek (2010) provide useful advice on ensuring Web site and data security. For example, to ensure security, researchers could encrypt transmitted data by using an https configured Web server, use the security tools of their server to password protect the folder containing the data, and create files that are themselves password protected.
Researchers who use active recruitment strategies directly or indirectly contact potential respondents and ask them to participate in their study; researchers who use a passive recruitment strategy make their study available online and wait for participants to discover it (Johnson, 2010). Active approaches are more effective when researchers can identify people who have particular traits and interests or when a large amount of data needs to be collected in a short period of time. Passive approaches are appropriate if privacy is a concern or if it is difficult to identify individuals who have the characteristics of interest. A mixed approach, involving a combination of both active and passive strategies, can also be used to cast a wider net for potential respondents. This section describes two active methods for participant recruitment, email and posting announcements to electronic mailing lists and bulletin boards, and three passive methods for participant recruitment, advertising, listing the research on directories, and designing the research site so that it can be easily located by search engines. We also discuss four related issues: using incentives to increase participation rates, problems of control over participant recruitment, project expiration dates, and effective Web site design.
Active recruitment strategies. Because it is relatively easy to obtain email addresses for many identified populations, using methods described shortly, email has become a commonly used method of active participant recruitment. However, response rates to email surveys are generally lower than the rates for other survey media because recipients often see surveys as a form of electronic junk mail (Couper, 2000). A more effective technique for recruiting participants is to first send an email message explaining the research and requesting participation; if the person agrees, a survey can then be sent (Vazire, 2010). Mail merge programs now make it fairly easy to develop and send personalized emails. These emails should address the informant by name in the subject line and/or the first line of the email. Solicitations also will be more effective if they come from the principal investigator and use a university address rather than, for example, a Hotmail or Yahoo! address. Finally, the email should be brief and should clearly explain the purpose of the research (see Vazire, 2010, for an example). Follow-up emails can be sent to nonresponders; these should be shorter than the original email (but that email should be included at the bottom of the letter). All emails should include a signature line with contact information. Be sure to proof read your email carefully to ensure it is free of spelling and grammatical errors.
How can one locate email addresses for recruiting participants? Cho and LaRose (1999) discuss several methods. A technique that should be avoided is called trolling: using a computer program to gather addresses from electronic mailing lists, chat rooms, newsgroups, and personal home pages. Although this method is effective in gathering addresses, most Internet users consider it to be an unethical practice that invades their privacy. In fact, trolling is considered to be such a severe violation of Internet etiquette that some Internet service providers prohibit it under penalty of terminating the offender’s Internet account. Another source of addresses is public email directories that operate like telephone directories of Internet users. However, people solicited through these directories may also react negatively to research solicitations because the directories advertise themselves in ways that imply that the information they contain will be used only for personal, not commercial or research, purposes. A final source of addresses is organizational email lists. In contrast to surveys based on other sources of email addresses, surveys of organization members can result in very respectable return rates when the topic of the survey is relevant to the mission or functioning of the organization. It is a good idea to request permission before using an organization’s email list, even if you have access to it as a member.
Another way to actively recruit participants is by posting an announcement about the research on electronic mailing lists (listservers) and bulletin boards (newsgroups). This technique is especially useful if one is trying to recruit members of specific populations because mailing lists and newsgroups are organized around specific topics (Cho & LaRose, 1999). However, because mailing list and newsgroup subscribers tend to be suspicious of what appears to be advertising, it is a good idea to get the approval of the mailing list or newsgroup moderator before posting an announcement and to mention that approval in the announcement (Michalak & Szabo, 1998; Smith & Leigh, 1997). Smith and Leigh also recommend posting notices of one’s intent to recruit participants and to ask for subscribers’ feedback on the appropriateness of using their mailing lists or social networking sites as sources of research participants. For announcements to be effective, they should be clearly relevant to the purpose of the group and the results should provide some potential benefit to the group. Because the membership of mailing lists and newsgroups is somewhat fluid, the announcement should be reposted periodically, but not so frequently as to appear intrusive. The list or group moderator can provide advice on the most appropriate posting interval (Michalak & Szabo, 1998).
Passive recruitment strategies. Researchers using passive recruiting strategies adopt a Field of Dreams approach: “If you build it [the Web site] he will come.” However, there are ways to increase the chances that participants will find your study online. One strategy is to advertise the study by purchasing a banner on popular Web sites or on those likely to be frequented by the respondents they hope to recruit (Nosek et al., 2002). For example, Ramo, Hall, and Prochaska (2011) recruited young adult smokers by posting Internet-based advertisements that included a hyperlink to their study; their ad received over 4,500 hits, resulting in 940 people who gave consent to be screened for study eligibility. Another strategy is to list the study on directories of research projects such as those maintained by the Association for Psychological Science (see Reips & Krantz, 2010, for a list). For example, at the time of this writing, 229 online social psychology studies were listed on the Social Psychology Network Web site (2011). The directories contain the titles and sometimes also brief descriptions of the studies listed and links to the research Web sites.
In addition, you can use a search engine to increase the likelihood of potential respondents finding your study. A search engine is a computer program that scans the Internet for Web pages that contain key words supplied by the person conducting the search and returns links to those pages. To ensure that a study is captured by a search engine, you should have a clearly descriptive title for the Web page and you should include key words in a <META> tag, which lists terms that can be read by search engines but are not visible on the page itself (see Anderson & Kanuka, 2003).
Use of incentives. Respondents recruited through subject pools are likely to receive some type of course credit or extra credit for their participation, and so are motivated to take part in your research. Incentives, or “material and nonmaterial inducements and rewards that are offered to respondents in exchange for their participation in studies” (Görwitz, 2010, p. 219), can be used to motivate participants recruited using other methods. Incentives can range from free access to electronic information, such as games or e-books, to gift certificates, to loyalty points that can be exchanged for goods and services. One commonly used incentive is entry into a lottery that gives respondents a chance to win cash or prizes.
Incentives increase both the number of people who view the first page of the study’s Web site and the percentage of people who complete the study, although effectiveness depends on the type of incentive offered (Görwitz, 2006). Loyalty points, for example, are more effective than lotteries whereas offers to donate to charities on the respondents’ behalf or giving respondents access to the study’s results appear to be ineffective (Görwitz, 2010). Of course, budget constraints affect a researchers’ ability to offer incentives and costs increase if the incentives themselves cannot be made electronically available to research participants and so, for example, must be mailed. Finally, most methods of paying incentives require that at least some identifying information be collected from respondents. When doing so, researchers must ensure the data are transmitted over a secure network (Buchanan & Williams, 2010). Moreover, even if this information is stored separately from participants’ responses, having to provide identifying information may reduce people’s willingness to participate in research on sensitive issues. Finally, researchers should be aware of potential legal issues related to offering incentives, particularly when collecting data from international participants (Görwitz, 2010).
Control over recruitment. In a traditional research project, researchers can exert some control over their research participants’ characteristics by controlling recruitment procedures. Web researchers have somewhat less control, especially when data are collected via a Web site, because anyone can find the site through a search engine; this is true even if the researchers try to limit recruitment to specific categories of people through announcements on carefully selected mailing lists and newsgroups. In addition, as noted earlier, people other than the researchers can post the site’s URL (Uniform Resource Locator, or Web page address) on other Web sites, mailing lists, and newsgroups, with the result that people other than members of targeted groups participate in the research (Birnbaum, 2000). In some cases, a study’s URL can “go viral”—people forward the site to friends who then forward it to other friends—resulting in exponential growth in site traffic. Although this attention can result in a large and diverse sample, it also increases the likelihood of sampling bias or even sabotage (Nosek et al., 2002). Therefore, if a specific population is needed for the research, it is advisable to screen responses, such as by asking for relevant demographic data, to ensure that participants are members of the target population and then use only the responses of those participants.
Expiration dates. Michalak and Szabo (1998) advise Web researchers to include an expiration date—the last date on which data will be collected—in announcements of studies. The expiration date will prevent the frustration potential participants might experience when they try to access a research site and find that it is no longer in operation. Similarly, if a site is listed on a research directory, the researchers should notify the directory administrator when data collection is complete so that the listing can be removed. At that time, it is also a good idea to replace data collection pages with one that explains that data collection has ended and provides a summary of the research results when they are available.
Web site design. Participant recruitment and motivation can be greatly affected by a Web site’s attractiveness and ease of use (Plous, 2000; Reips, 2000). Box 16.2 provides some tips for designing an effective data collection site.
Keep download time to a minimum. Remember that a page that loads instantaneously from your hard drive might take much longer over a slower connection. Many people will not wait for a page to download. Therefore,
• |
keep pages as short as practical; |
• |
keep graphics file sizes as small as possible; and |
• |
avoid using unnecessary animation. |
Do not put advertising banners on the page. Advertising not only distracts users from the content of the page, it also gives the page a commercial rather than a scientific appearance. Emphasize the professional nature of your site. For example,
• |
prominently display the name of your college or university; |
• |
provide an email address (preferably from a university) for users to contact you; |
• |
explain the procedures used to keep data anonymous or confidential; |
• |
offer feedback to research participants; |
• |
solicit feedback from visitors to the site; and |
• |
post the date on which the site was last modified. |
Make the site easy to use. For example,
• |
avoid the use of browser plug-ins that are not distributed with most browsers (if they are necessary, provide a link to a download site); |
• |
if JavaScript is required, remind users to enable it (some people disable JavaScript because of security concerns); |
• |
use HTML tags that can be read even by older versions of browsers; |
• |
do not put important information in banners (people associate banners with advertising and so ignore them); |
• |
do not use pop-up windows that open automatically (people also associate these with advertising and close them without reading the contents); and |
• |
create pages that can be read by persons with disabilities |
Make the pages easy to read. For example,
• |
use short text lines (long lines can be difficult to read); |
• |
use font styles, font sizes, and text and background colors that promote readability; |
• |
use both upper-and lowercase letters (text that is all uppercase is difficult to read); |
• |
keep images and tables small enough to accommodate small screens; and |
• |
use only the basic 216-shade color palette (some browsers or computers may not render other colors accurately). |
Check to ensure that the site works regardless of the hardware or software used to view it. For example, how does it look
• |
on both Windows and Apple OS computers; |
• |
with different browsers, such as Chrome, Firefox, Safari, and Internet Explorer; |
• |
on a tablet or smartphone? |
Have some members of the target participant population review the Web site for usability (such as words that need defining) and acceptability (such as disliked images), and use their feedback to improve the site.
Source: Adapted from Jakob Nielson’s Alert Box (http://www.useit.com/alertbox), Plous (2000), and Reips (2000).
A number of Web 2.0 survey applications can be used to create customized Web surveys and experiments. The flexibility of these applications continues to improve; for example, some allow random assignment of participants to experimental condition, and some allow branching, which directs users to certain questions depending on their response to earlier questions. Some data collection packages also allow researchers to use the methods to improve data quality, discussed earlier, such as controlling the amount of time participants have to complete the survey. Before creating your experimental materials using one of these programs, take the time to consider the strengths of weaknesses of the available application; you will want to ensure that the application has the features you need. Box 16.3 contains a list of questions to consider when reviewing applications. Keep in mind, however, that even though these applications are becoming increasing sophisticated, they may be unable to handle complex experiments; see Birnbaum (2001) and Fraley (2007) for information about programming these studies.
• |
How much does the application cost? Some applications are free, others charge a monthly fee; some charge different rates depending on how many people complete the study or how many questions you include. Some universities have a site license for a particular application, which means the researcher does not her or himself incur costs for using it. You should be sure you understand the cost structure before collecting any online data; some programs allow you to design a survey and collect data for free, but charge a fee to download the data. |
• |
How easy is the interface to learn and use? |
• |
How much control do you have over the appearance of the survey? Are there only a few set templates or are their several? Do the available templates meet your needs? |
• |
Can you present questions in the desired format (e.g., Likert scales, graphic scales; see Chapter 6) and can these formats be mixed? Can users easily navigate through the application or it is confusing? |
• |
Can you edit the survey once it is up and running (for example, if you find an error)? |
• |
How can the study be accessed? For example, is the study available only through a URL or can you embed the study in email? |
• |
Can you upload email contact information and send customized invitations to potential participants? |
• |
Is there a way to prevent duplicate responses? |
• |
What information does the application record about respondents and is there a way to ensure responses are truly anonymous if desired? Note that applications that collect and record IP addresses are not anonymous for participants who completed the study from private computers (and even IP addresses from public computers contain information such as location that might make it possible to identify respondents). |
• |
Can you include an informed consent form and is identifying information from the form stored separately from the data to ensure confidentiality? |
• |
Can participants be randomly assigned to experimental condition? Do you have control over the method of randomization? |
Can you cap the number of participants? That is, if your target is 500 respondents, will the application close the survey once that many are obtained? | |
• |
How can the data be accessed? Can it be readily exported in a format, such as comma separated values (csv), that can be read by Excel, SPSS, or other software programs? Can reports or graphs be generated through the application? |
• |
Does the company or organization who hosts the application retain the rights to your questions and/or data? If so, for what purposes can they use your data and under what conditions? Always carefully read the company’s terms of service. |
Internet researchers are bound by the same principles, rules, and guidelines as other researchers (see Chapter 3), including Institutional Review Board (IRB) approval. However, some ethical principles, such as informed consent and monitoring participants for harm, are more difficult to implement in Internet research. Others, such as voluntary participation and privacy, may be more salient to participants in Internet research than to participants in traditional research.
Voluntary participation. For most Internet studies, voluntary participation is not an issue. For example, recipients of email surveys are free to choose whether to return them and visitors to research Web sites are free to choose whether to take part in the study or can terminate their participation at any time simply by closing the browser window. However, studies that observe and record discussions in chat rooms and on mailing lists and social networking sites raise the same question of voluntary participation as do other forms of observational research (see Chapter 10). That is, online discussions technically constitute public behavior because, in most cases, anyone can log into a chat room or subscribe to a mailing list or social networking sites. However, as Kraut et al. (2004) note,
Whether a person conversing online can reasonably expect the communication to be private depends on legal regulation, social norms, and specific details of implementation, all of which are changing. Implementation details include such features of online settings as the number of people who subscribe, whether membership is restricted or open, whether membership is static or rapidly changing, whether conversations are ephemeral or archived, whether the presence of lurkers is visible, and whether the forum has posted explicit recording policies. (p. 110)
Therefore, researchers must consider both the technology used and the cultural context of that technology to determine whether the behavior they wish to observe can fairly be considered public (Anderson & Kanuka, 2003). For example, the online discussion boards for your local newspaper and for students enrolled in a class use similar technology, but the expectations for privacy are quite different across the two settings. In addition to federal regulations, researchers should consider how the participants in these discussions likely view their postings. Many may take exception to the idea that the online postings are public information (Buchanan & Williams, 2010), an issue we return to in the next section.
As we discussed in Chapter 3, researchers do not need IRB approval to conduct research using preexisting public data, documents, and records. However, as Kraut et al. (2004) note, by definition preexisting means all the data existed prior to the beginning of the study. This principle might not apply to online data. That is, any data generated during the ongoing course of the research, such as postings to a discussion board, are not preexisting. In such cases, IRB approval must be obtained before conducting the research.
Privacy. In Chapter 3, we discussed the researcher’s obligation to protect the confidentiality of the data provided by research participants. Internet users are likely to see confidentiality as part of the broader issue of privacy. Privacy is of special interest to Internet users because Web servers can be programmed to collect data about visitors to a Web site, such as the Internet identification number (IP address) of the visitor’s computer and the visitor’s email address (Cho & LaRose, 1999). It is therefore extremely important to inform potential research participants about the procedures used to protect the anonymity or confidentiality of the information they provide. Michalak and Szabo (1998) also recommend informing potential participants how the data will be reported: Knowing that no individual responses will be published and that only average group scores and summaries of free-response data will be made public, will help people unfamiliar with the research process better understand how their privacy will be protected. Also, as we noted earlier, whenever possible, data should be collected, downloaded, and stored using secure procedures (see Thiele & Kaczmirek, 2010).
Many people might view researchers’ lurking (observe without participating) in chat rooms or on social networking sites or newsgroups as an invasion of the participants’ privacy (Cho & LaRose, 1999; Sharf, 1999). Because of these concerns, recommendations for researchers conducting observations of online behavior include obtaining the consent of group or list moderators, identifying themselves as researchers, explaining the purpose of their research and how the results will be used, and terminating the research if a substantial number of discussion participants object to it. Researchers should also periodically repeat the notification of research in progress because the membership of online groups changes frequently (Cho & LaRose, 1999; Michalak & Szabo, 1998; Sharf, 1999). Finally, any manipulation to the online environment, such as posting a controversial response to a discussion board for the purpose of observing participants’ responses, could be considered a form of deception and researchers should carefully consider the ethics of doing so (Buchanan & Williams, 2010).
An important privacy concern arises in observational research when researchers record quotations from online discussions (a practice called harvesting) and use them in their research reports without the permission of the person being quoted. Members of online discussion groups consider harvesting to be an extremely severe invasion of privacy (Michalak & Szabo, 1998; Sharf, 1999). Researchers also must be careful about quoting people’s postings without their permission, even using pseudonyms. As Buchanan and Williams (2010) point out, it is very simple to find the source of online quotes; all one need do is type the text into a search engine. This can be prevented to some extent by altering quotes or creating composite quotes from multiple sources (Kraut et al., 2004).
Informed consent. The principle of informed consent requires that potential research participants have all the information that is relevant to deciding whether to take part in research. Online consent forms should contain all of the elements described in Chapter 3, including whether responses are confidential or anonymous. If participants provide their name or other identifying information on the consent form, they should understand whether or not this information is stored with their data (Anderson & Kanuka, 2003). It is also important to pretest informed consent statements to ensure they are clear. This is particularly important because, in online studies, the researcher is not present to answer participants’ questions or to determine how well the information was understood. However,regardless of whether the informed consent form is on paper or online, respondents do not attend closely to it and, perhaps because of this, they recall only about 10% of the information presented on the form (Varnhagen et al., 2005). To ensure that participants have read and understood the form, researchers can ask participants to “click to accept” separate elements of the informed consent statement and include a short quiz over the content of the form (Kraut et al., 2004).
When informed consent is needed, researchers must decide how to document consent without using a physical consent form. It is, of course, very easy to provide potential participants with the necessary information, but they cannot sign a form. Michalak and Szabo (1998) suggest putting the consent form on a Web page and having participants indicate their consent by clicking on an “agree” button that would then take them to the data collection page. Michalak and Szabo point out that this procedure is similar to that used by software companies: End-user licensing agreements inform people who purchase their software that breaking the seal on the package indicates their commitment to abide by the terms and conditions of use for the software. As with other research, IRBs can waive the requirement for written informed consent when participation poses minimal risk. However, Kraut et al. (2004) recommend that researchers still require participants to indicate that they have read and understood the purpose of the study, that they are freely participating, and that they understand the risks and benefits of participating. Anderson and Kanuka (2003) provide a detailed sample consent form.
Perhaps the thorniest issue in informed consent for Internet research is verifying that participants are legally able to give consent to participate (Binik et al., 1999; Keller & Lee, 2003). In the United States, persons under the age of 18 cannot legally give their consent to participate in research; however, large numbers of Internet users are minors. There is no absolute solution to this problem. Smith and Leigh (1997) recruited participants by posting notices on newsgroups, but only after contacting the newsgroup moderators and verifying that the vast majority of subscribers were adults. Alternative procedures would be to include an age restriction in the description of the study and to ask participants to report their ages, recording only the data from those who report being at least 18 years of age.
One piece of information that gets taken for granted in traditional research is that the people collecting the data are bona fide researchers. This information is typically conveyed by the context of the research: Data are collected at a college or university, or in field research an official of the organization in which the research is conducted vouches for the researchers. However, the use of false identities is common on the Internet, so potential research participants must be able to verify the researchers’ credentials (Binik et al., 1999; Cho & LaRose, 1999). Cho and LaRose suggest that a simple way to provide such verification is host the study’s Web page on a college or university Web site. They point out that most people trust the integrity of educational institutions, so an “.edu” on the end of the domain name of the site where research is being conducted will enhance the researchers’ credibility to potential participants. Michalak and Szabo (1998) also recommend that researchers describe any support they receive from sources outside their institutions, such as grant agencies and corporations. Some people might not want to participate in research sponsored by organizations whose policies or practices they object to.
Monitoring participants for harm. One of a researcher’s obligations is to monitor participants during a study for signs of unanticipated negative effects. Such monitoring is impossible in Internet research, so alternative procedures must be used (Kraut et al., 2004). One course of action would be to refrain from using deception, from using potentially upsetting research materials (such as pictures of victims of violence), and from asking ask questions on potentially upsetting topics (such as being the victim of abuse). This approach limits the research topics that can be studied but maximizes participant protection. If such materials or questions are essential to the research, then potential participants should be clearly warned about the potentially upsetting material. Binik et al. (1999) also suggest including contact information for an appropriate crisis line, which could be included as part of both the informed consent and debriefing procedures.
Debriefing. Debriefing is quite easy in Web site-based research: After participants submit their data, they can be sent to a page that thanks them for their participation and explains the purpose of the research. Kraut et al. (2004) suggest creating a link that ensures that participants who leave the study early still have access to the debriefing. However, because the researcher is not present, she or he cannot ensure that the participant reads the debriefing. This is particularly problematic for research on sensitive topics or deception research. As noted earlier, researchers should carefully consider whether an online study is the appropriate format for this type of research (Buchanan & Williams, 2010). Of course, a well-written debriefing is more likely to be read than a poorly written one. Fraley (2007) notes that thoughtful debriefings can educate people about the importance of psychological science; one way to do so is to provide links to additional online resources. Doing so is particularly important for research on sensitive topics which might be upsetting to some participants.
Michalak and Szabo (1998) suggest that the debriefing page should also solicit comments on the research and provide the researchers’ email address and perhaps an email link. Smith and Leigh (1997) further suggest that the page include information on the IRB’s role in protecting research participants and information on how to contact the researchers’ IRB so that participants can direct any complaints or reservations they have about the research to the IRB.
So far, our discussion has focused primarily of new data collected by researchers to address a specific research question. However, researchers also use archived information to test hypotheses. Archives are records or documents that describe the characteristics of individuals, groups, or organizations. The data in these records are usually collected and maintained for purposes other than research. The original purpose of the U.S. census, for example, was to determine the population of the states so that representatives could be apportioned among them, and the data are now also used for administrative purposes, such as the distribution of federal monetary subsidies to the states. However, census data can also be used for research on the variables included in the census survey, such as the relationship between educational level and income. This section describes the types of archives from which one can draw data and briefly discusses some of the advantages and disadvantages of archival research. Lee and Peterson (1997) and Kellehear (1993) provide more detailed descriptions of the ways in which researchers can use archival data.
Hoyle, Harris, and Judd (2002) identify three types of archives. Statistical archives commonly store data in summary form, such as means, proportions, and rates. In the public domain, statistical archives include those of the census; FBI crime statistics; Department of Labor statistics on wages, hours worked, and productivity; local government birth, death, and public health records; and so forth. In the private domain, organizations keep records of variables such as the sex and ethnic composition of their membership, and businesses also keep records on variables such as absenteeism, tardiness, and turnover. The Berkowitz (1970) study on the effect of President Kennedy’s assassination on societal violence described in Chapter 10 is an example of research conducted using data from statistical archives, in this case crime statistics compiled by the FBI. Another example is Levin and McDevitt’s (2002) analysis of police reports of 169 hate crimes reported to the Boston police in 1991 and 1992 which they used to develop a taxonomy of motivations for such crimes.
Another type of archival data consists of written and electronic records. As noted earlier, some types of archival data are now available on the Internet, but many sources have not been digitalized. The speeches and writings of public figures are usually preserved, and diaries and letters can reflect the writers’ beliefs, attitudes, and motivations. Tetlock (1979), for example, analyzed government officials’ public speeches concerning what turned out to be good and poor policy decisions. He found that speeches concerning poor decisions were more simplistic and biased than those about good decisions. Communications media can also provide data, both in the form of news reports and entertainment. For example, Lau and Russell (1980) and Peterson (1980) studied newspaper reports of professional athletes’ and coaches’ expressed reasons for winning and losing to test a theory about how people react to success and failure. They found that the players and coaches almost always took credit for winning and blamed circumstantial factors for losing, which supported both the theory and the results of laboratory research.
The third type of archived data discussed by Hoyle et al. (2002) is survey data archives; these archives contain people’s responses to survey questions and demographic data about the respondents, such as age, sex, ethnicity, and income. Survey data archives commonly used by social science researchers include the records of surveys conducted by U.S. government agencies, such as the Census Bureau, and by survey research organizations, such as the University of Chicago’s National Opinion Research Center (NORC), which maintains a computerized archive of the records of the General Social Survey (GSS). This survey has been conducted on at least a biennial basis since 1973 (NORC, 2011). The Pew Global Attitudes Project (2011) has archived data sets based on public opinion surveys from more than 270,000 interviewees in 57 countries. Topics range from people’s assessments of their own lives to their views about current political issues. The European Values Survey (EVS; 2011) and the European Social Survey (ESS) each archive survey data from respondents in over 30 European countries; the questionnaires address attitudes and behaviors around a variety of social and political topics that can be used for subsequent research. For example, Štulhofer, and Rimac (2009) used EVS data to examine cross-national attitudes toward homosexuality in Europe; results showed people from Scandinavian countries, such as Denmark and Sweden, were the most accepting of homosexuality and that people from Eastern European countries, such as Russia and Belarus were the least accepting.
Survey archives also provide an inexpensive source of data for answering research questions and the archives may contain longitudinal data and periodic surveys. For example, the GSS and the ESS often include questions that remain consistent from year to year, allowing cross-sectional comparisons across time. Another advantage is that many surveys, such as the GSS and ESS, use a representative sample of the population of interest. Finally, many available data bases can be downloaded to a personal computer. Cornell University’s Institute for Social Economic Research (2011) maintains a list of Internet data bases for social scientists, including both U.S. and international data bases. Some archival data is only available from research centers, however, and some online data bases can be accessed only by permission. Stewart and Kamins (1993) and Zaitzow and Fields (1996) describe a number of other survey archives that researchers can use.
Archival data have a number of advantages for researchers (Kellehear, 1993; Lee & Peterson, 1997). In addition to being naturalistic, most archival data are nonreactive. Because most records from which the data come are not made for research purposes, there are no reactivity problems associated with people knowing that they are participating in research. (The exception, or course, is the archived survey data described in the previous section.) As we saw in our discussion of Internet research, the use of archival data also allows the researcher to expand the research population to include participants not usually available to the researcher such as people from other cultures, people whose social roles and positions isolate them from researchers, and historical figures. For example, Lee, Hallahan, and Herzog (1996) investigated cultural differences in how people explain significant life events by examining newspaper articles from different countries, Gruenfeld and Preston (2000) investigated the relationship between the complexity of U.S. Supreme Court justices’ reasoning about cases involving legal precedents and whether they voted to overturn those precedents, and Simonton (1994) studied the nature of genius by examining the lives of writers, artists, and scientists. Archival data also permit researchers to conduct what might be termed retrospective longitudinal research, in which data collected from records made by people at one point are used to predict later life outcomes. For example, Peterson, Seligman, and Valliant (1988) examined the relationship between the ways people interpret significant life events and long-term health outcomes by using data from essays written by World War II veterans soon after their return to the United States to predict their health status 35 years later.
In addition to providing researchers access to various kinds of data, the use of archival data confers some practical advantages on the research. First, archival research is usually less expensive than the collection of original data, especially for longitudinal and cross-cultural research. Second, most archival research raises few ethical issues unless deception is used to gain access to records or individuals’ privacy is invaded by revealing the names of people included in the records. Finally, archival research can easily be restarted if mistakes are made. For example, if researchers realize in the midst of a study that they have overlooked an important variable, they can modify the records to include the variable. Researchers collecting data from participants would have to start data collection from scratch with a new participant sample.
Although archival data provide some advantages, they also present some problems that researchers must take into consideration when using them as data sources. Let’s examine some of these problems.
Access. The first problem is that of access. Individuals might not want to release private documents, such as diaries and letters, to archival researchers, and organizations are often wary about opening their records to outsiders. Even government records that are supposed to be open to the public might be restricted in practice. Maris (1969), for example, wanted to study the relationship between suicide and sex, age, and marital status, using death certificates from Cook County, Illinois. The county clerk refused to allow him to see the records even though state law said that they were supposed to be open to the public. Access is less of a problem for printed media, which are stored in public libraries. Researchers can record radio and television programs as they are broadcast or access them online, but might have trouble gaining access to recordings in company archives. Moreover, which media are available online rapidly changes and may be affected by copyright or other legal issues.
Validity. The second problem is that of the validity of archival records as operational definitions. The information available in statistical archives might not provide good operational definitions of hypothetical constructs; after all, they were intended only to assess manifest variables.
The survey data available in an archive also might not provide high quality operational definitions of hypothetical constructs. To cover as many topics as possible, archived surveys often assess constructs with single item measures of unknown reliability and validity, although there are some exceptions. Because of this limitation and others, you must carefully evaluate the data from a survey archive before using them for your research. Box 16.4 lists some criteria for evaluating archived survey data.
• |
What was the purpose of the original study? |
• |
How valid was the data collection process? |
• |
Examine the documentation of the archived data to determine the quality of the data collection process. Consider how respondents were sampled and the validity of measures. If this information is not available, you should not use the data. |
• |
What information was collected? |
• |
Unless the data set includes all the variables you need to test your hypothesis, including demographic data to provide information about the generalizability of results, and unless the operational definitions used in the survey adequately represent the hypothetical constructs you are studying (see Chapter 6), the data may be of limited usefulness. |
• |
When were the data collected? Because social attitudes and social processes can change over time, the relationships between variables found using old data sets might not represent the ways in which the variables are currently related (see Chapter 8). |
• |
Were the data collected for the purpose of influencing legislation or litigation? If so, the goals of the survey may intentionally or unintentionally influence the data collected, such as through the use of biased questions. |
Archived data can also suffer from what Webb, Campbell, Schwartz, Sechrist, and Grove (1999) called selective deposit and selective survival. In selective deposit, the people who control the data limit what the archive includes. For example, even though the Congressional Record is supposed to be a verbatim record of what is said on the floors of the U.S. Senate and House of Representatives, legislators can edit their remarks before the Record goes to press. In selective survival, the people who control the archive limit the data stored there. For example, Schoeneman and Rubanowitz (1985) analyzed the contents of newspaper advice columns but noted that the columnists chose the letters printed from the thousands of letters they received. Finally, when archives include data on hypothetical constructs, the operational definitions might change over time. For example, significant changes have occurred in how race and ethnicity are classified in the U.S. Census (2011). Prior to 1997, for example, four racial categories (American Indian or Alaskan Native, Asian or Pacific Islander, Black, and White) and two ethnicity categories (Hispanic origin and Not of Hispanic origin) were used. In 1997, the category Black was expanded to include African American and Asian became a separate category no longer paired with Pacific Islander; this latter category was changed to Native Hawaiian or Other Pacific Islander. Some Other Race was added as a category. The ethnicity categories were changed to be Hispanic or Latino or Not Hispanic or Latino. Another significant change was that beginning with Census 2000, respondents could self-identify as a member of one or more races. Hence, researchers using U.S. Census data to describe changes in the nation’s racial and ethnic composition must be cautious as what appear to be population changes may instead be due to changes in the response options.
Alternative explanations. The third problem derives from the correlational nature of archival research. As with all correlational studies, those using archival data might uncover spurious correlations caused by unmeasured third variables. For example, a large number of studies have found a relationship between outdoor air temperature and the incidence of a variety of violent crimes (Anderson, 1989), suggesting that heat causes aggression. However, it is also possible that people drink more alcoholic beverages during hot periods and that alcohol, not the heat, causes the aggression; other explanations are also possible (Bell, 1992).
The ecological fallacy. The fourth problem can arise from the use of aggregate data from statistical archives. Data are said to be aggregated when each data point represents many people rather than one. For example, Robinson (1950) examined the relationship between race and illiteracy by using U.S. Census data for 1930 to correlate the proportion of Black Americans living in each state with the states’ illiteracy rates. He found that states with a higher proportion of Black residents had higher illiteracy rates, r = .77. From these data, one might conclude that there was a strong relationship between race and literacy in 1930. However, Robinson then showed that when data collected on the race and literacy status of individuals were correlated, the relationship was actually quite small, r = .20. The term ecological fallacy is used to describe the errors that can result from drawing individual level conclusions from aggregate level data. Robinson suggested that a confounded third variable—region of the country—accounted for the difference between his aggregate level and individual level results. Illiteracy was higher overall in southern states than in northern states, and the illiteracy rate was higher among Blacks in the South than among those in the North. When Firebaugh (1978) controlled these regional differences statistically, the aggregate level correlation was similar to the individual level correlation. The lesson from these studies is that one should never apply the results of aggregate level research to individuals unless one is certain that all the relevant variables have been taken into consideration. See Dooley (1995) for a more detailed discussion of the ecological fallacy problem.
Two major aspects of data collection are the selection of research participants and research procedures. Researchers want to be able to apply the results of research to a target population—a particular group of people. When this group is operationally defined, it constitutes the study population from which researchers draw the research sample. The sample can be drawn using either a probability sampling technique, in which the likelihood of any member of the study population’s being selected for the sample is known, or a nonprobability sample, in which the likelihood of selection is unknown. Probability samples are highly representative of the population, but nonprobability samples are less expensive and easier to acquire, and so are used much more frequently in psychological research.
Researchers must also determine the appropriate sample size. Sample size is important because of its relationship to statistical power: The larger the sample, the more likely the research will show a significant effect of the independent variable if that variable has an effect in the study population. If sample size is too small, the research might fail to detect the effect of the independent variable. Determination of sample size is based on the magnitude of the expected effect of the independent variable, the alpha level used, use of a one-or two-tailed significance test, and the desired level of statistical power.
Proper research procedures include an effective research setting, effective instructions, debugging the procedures, running the data collection session, and the post-experimental interview. Effective research settings are coherent—providing a smooth, logical flow of events—simple, psychologically involving for participants, and consistent across participants. Effective instructions are clear, get and hold participants’ attention, and include checks on participants’ understanding. The process of debugging the research procedures begins with the research proposal, which colleagues can review for problems. Rehearsals allow the researcher and any confederates to familiarize themselves with the mechanics of the procedures and to identify and work out any kinks. As a last step, pilot studies are used to collect preliminary data, to test the validity of experimental manipulations, and to conduct a final test of the research procedures. Pilot studies also give the researcher an opportunity to determine whether participants perceive the research situation as intended and to determine the time needed for a data collection session.
During data collection, researchers should present a professional appearance and act in a professional manner, treating participants politely. The post-experimental interview has four functions: an ethical function of debriefing and removing adverse effects, an educational function of informing participants about the research, a methodological function that assesses the validity of the session, and a discovery function that uses participants’ comments to shed new light on the research. These four functions can be integrated into a three-step process: probing for problems, explaining the research, and asking participants’ help in improving the research. Finally, researchers must carefully train and supervise their research assistants.
Internet research offers a potentially rich source of data. Internet research can take the form of experiments, observational studies, and surveys. Researchers are continually finding novel ways to collect new data online and to make use of data that is already available on the Web. Online research offers the advantages of economy and ease of data collection, access to research participants who might not otherwise be sampled, the potential for increased internal validity, and the use of public research methods. However, it has the disadvantages of biased participant sampling, limits on the kinds of experimental stimuliand response modes that can be used, lack of control over the data collection environment, participant attrition, and the risk of sabotage. Despite these limitations, research indicates that Web-based data are as valid as data collected in laboratory research. Participants for Internet research can be recruited in a number of ways, including email solicitation, announcements, and listings on research directories. Internet researchers must be sensitive to a number of ethical issues including voluntary participation, informed consent, participant welfare, participant privacy, and debriefing.
Archives are records or documents that describe the characteristics or behaviors of individuals, groups, or organizations, and consist of statistical archives, survey archives, and written and electronic records. Archival data allow researchers to study populations not usually available to them with relative ease and few ethical problems. However, archival research can be limited by difficulty of access to the data sources, validity of the data, and the inability to rule out alternative explanations for findings. In addition, one must be wary of the ecological fallacy in aggregate data; inferring individual level processes from group level data.
Wilson, T. D., Aronson, E., & Carlsmith, K. (2010). The art of laboratory experimentation. In S. T. Fiske, D. T. Gilbert & G. Lindzey (Eds.), Handbook of social psychology (5th ed., Vol. 1, pp. 51–81). Hoboken, NJ: Wiley.
This chapter updates previous work by Aronson and Carlsmith (1968) on effective data collection, including creating clear instructions, involving participants, and conducting pilot studies, and creating manipulation checks.
Cohen, J. (1992). A power primer. Psychological Bulletin, 112, 155–159.
Cohen’s work remains the gold standard on how to conduct a power analysis and determine optimal sample size.
Daniel, J. (2011). Sampling essentials: Practical guidelines for making sampling choices. Thousand Oaks, CA: Sage.
As the title suggests, the author takes a practical approach to sampling, offering step-by-step advice about both the probability and nonprobability sampling techniques discussed in this chapter. The strengths and weaknesses of these techniques are considered and examples from the research literature are provided.
Anderson, T., & Kanuka, H. (2003). e-Research: Methods, strategies, and issues. Boston: Pearson Education.
Gosling, S. D. & Johnson, J. A. (Eds.). (2010). Advanced methods for conducting online behavioral research (pp. 255–271). Washington, DC: American Psychological Association.
Both books provide excellent and practical advice about online data collection procedures and about conducting content analyses of available online data, such as from blogs and chat rooms.
Kraut, R., Olson, J., Banaji, M., Bruckman, A., Cohen, J., & Couper, M. (2004). Psychological research online: Report of Board of Scientific Affairs’ Advisory Group on the conduct of research on the Internet. American Psychologist, 59(2), 105–117.
This report covers the challenges online researchers face compared with traditional research and offers good advice about how to address those challenges. The final section of the report considers how both researchers and Institutional Review Boards can ensure that online research follows established ethical practices.
Aggregate data
Archives
Cluster sampling
Convenience sample
Critical effect size
Ecological fallacy
Experimental realism
Incentives
Mundane realism
Nonprobability sampling
Pilot study
Post-experimental interview
Probability sampling
Purposive sampling
Quota sampling
Research sample
Sampling frame
Simple random assignment
Simple random sampling
Snowball sampling
Statistical power
Stratified random sampling
Study population
Systematic sampling
Target population