1 Introduction
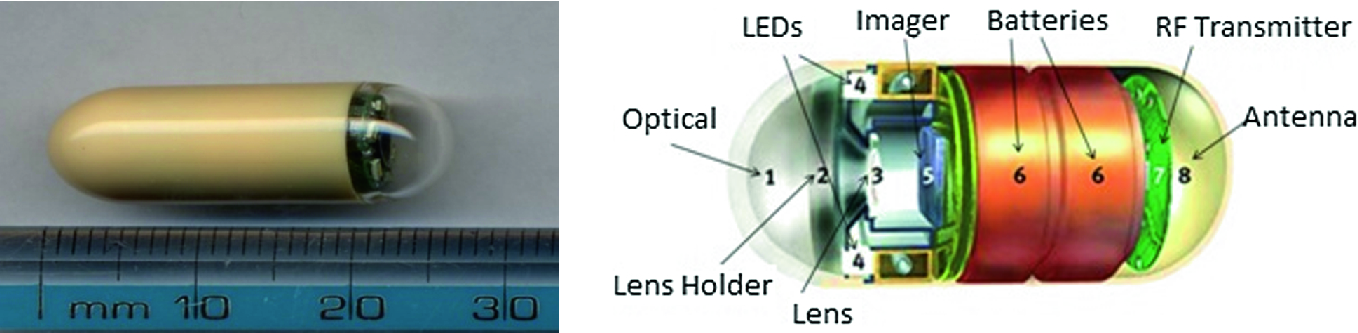
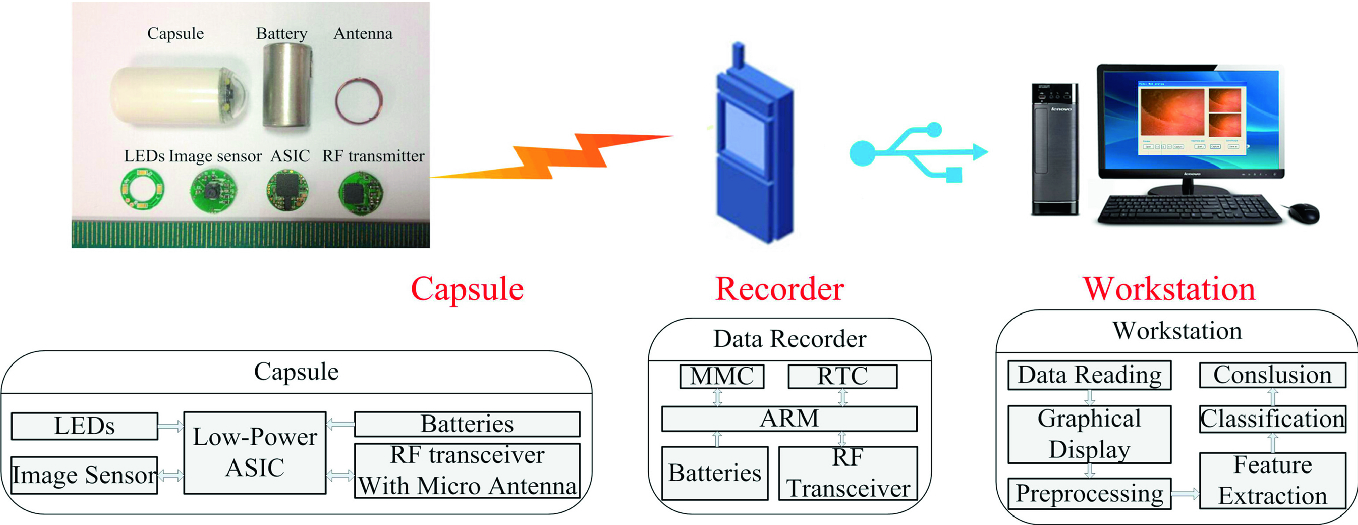
Capsule endoscopy system [7]
By year 2015 since its approval by the U.S. food and drug administration (FDA), more than 10 lac capsules have been used [8]. However, CE videos length ranges from 6 to 8 h generating 55000–60000 frames which make the analysis time-consuming. Depending on the expertise of the examiner, the examination would take 45 min to 2 h. In addition to a huge number of frames, GI tract appearance, and intestinal dynamics, the need for constant concentration further complicates the diagnostic and analysis procedure. With advancements in technology, the volume of data is likely to grow by many folds [9]. Thus, using computer vision and machine learning together build as a computer-aided diagnosis (CAD) system and artificial intelligence in health care can be a great help for experts and physicians in diagnosing the abnormalities [10, 11]. A CAD system capable of analyzing and understanding the visual scene will certainly assist the doctor with a precise, fast and accurate diagnosis. After manual analysis of CE video, CAD can also provide a second opinion to a gastroenterologist. In medical imaging, CAD is a prominent research area capable of providing a precise diagnosis. The ultimate goal of a CAD is to limit the errors in interpretation and search. It also aims to limit the variation among the experts. In particular, a computer-aided medical diagnostic system for CE can consist of following units: (1) a data capturing and transmitting unit—the capsule (2) a data receiver and storage unit—the waist belt (3) a data processing unit for pre-processing and feature extraction (4) a machine learning based classification unit or decision support system (5) a user interaction unit for final diagnostic report. In general, a complete automated abnormality detection system comprises of a pre-processing unit, segmentation unit, feature extraction unit, and classification unit. CE images also contain un-informative images such as noise, dark regions, duplicate frames, bubbles, intestinal fluids and, food remains. By pre-processing it is important that such un-informative regions or images be isolated. Poisson maximum likelihood estimation method may be used to remove Poisson noise [12]. Pre-processing noticeable improves computational efficiency and overall detection rate. The task of pre-processing and feature extraction unit is to supply a CAD system friendly data [13]. Few methods adopted for pre-processing in CE are contrast stretching, histogram equalization and, adaptive contrast diffusion [14].
Segmentation is the process of extracting only a useful or informative part from the whole image. This process will help us concentrated only on the required portion instead of whole image. Segmentation is performed using edge based or region based or a combination of both approaches. Both methods have their advantages and disadvantages. Many techniques have been used in CE images for segmentation such as Hidden Markov Model(HMM) [15], total variation(TV) model [16] and, the Probabilistic Latent Semantic Analysis(pLSA) [17]. TV is a hybrid active contour model based on region and edge information; HMM is a statistical Markov model and, pLSA is an unsupervised machine learning technique.
Features in image analysis refer to a derived set of values providing discriminative and non-redundant information of the image. For visual patterns, extracting discriminative and robust features from the image is the most critical yet the most difficult step [18]. Researchers have explored texture, color, and shape based features in spatial as well as frequency domain to discriminate between normal and abnormal images of CE.
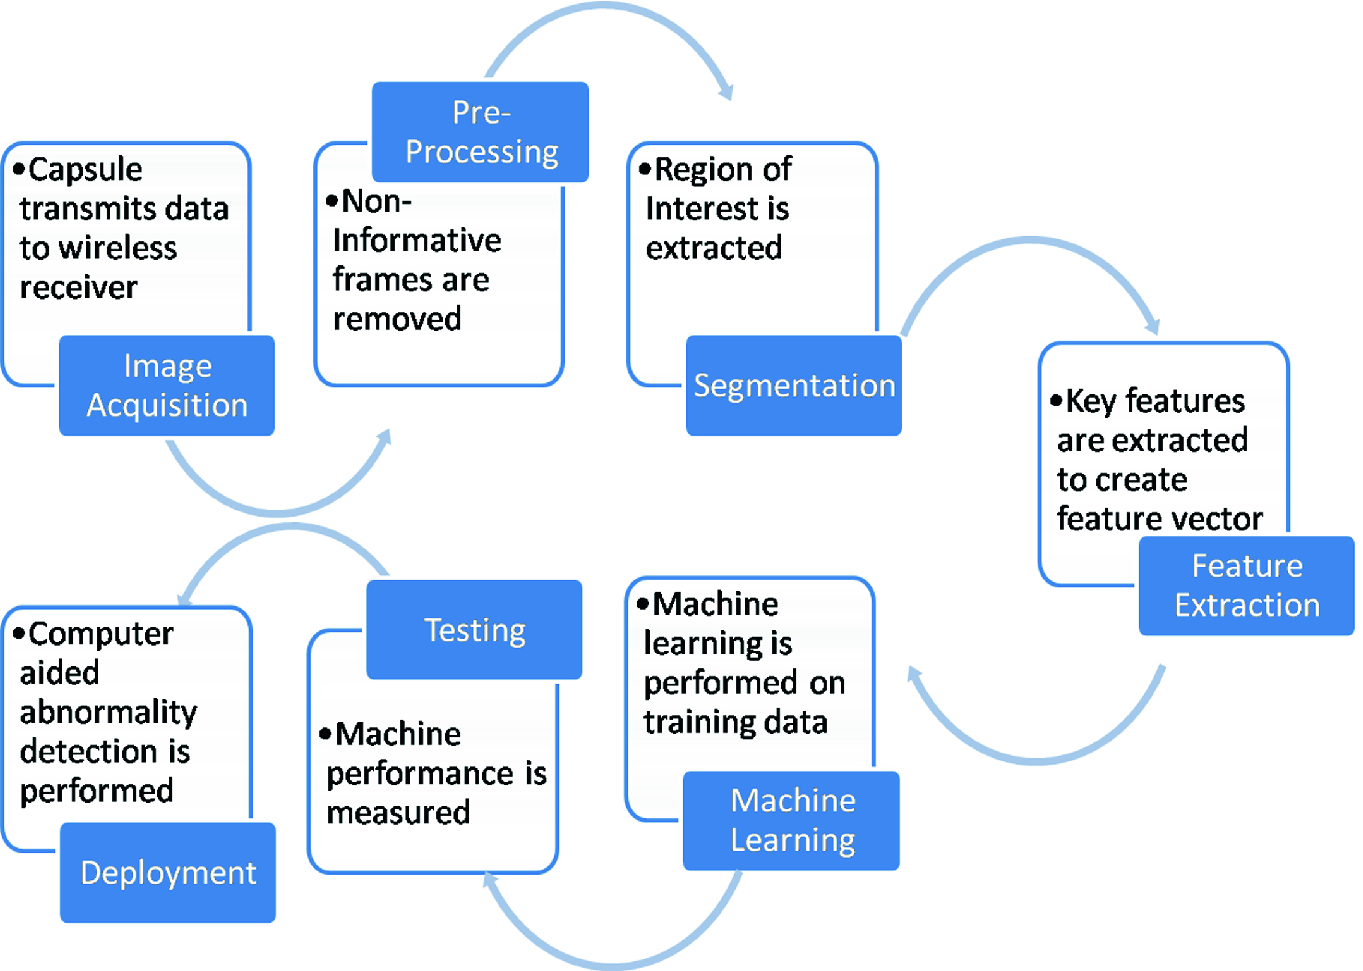
Diagrammatic representation of entire process
Summary of prior art on ulcer detection
Work | Features used | Method/classifier used | Limitations | Performance | Dataset size |
|---|---|---|---|---|---|
[20] | Texture and color | SVM | Very less number of data samples | Accuracy = 92.65% Sensitivity = 94.12% | Total images 340 |
[21] | The chromatic moment | Neural network | Texture feature is neglected. Too few samples | Specificity = 84.68 ± 1.80 Sensitivity = 92.97 ± 1.05 | 100 images |
[22] | LBP histogram | Multi-layer perceptron (MLP) and SVM | Too few samples for training | Accuracy = 92.37%, Specificity = 91.46%, Sensitivity = 93.28% | 100 images |
[23] | Dif lac analysis | De-noising using Bi-dimensional ensemble empirical mode decomposition (BEEMD) | Too few samples for training | Mean accuracy >95% | 176 images |
[24] | Texture and colour | Vector supported convex hull method | Specificity is less. Skewed data | Recall = 0.932 Precision = 0.696 Jaccard index = 0.235 | 36 images |
[25] | Leung and Malik (LM) and LBP | k-nearest neighbor (k-NN) | Computationally intense. Skewed data | Recall = 92% Specificity = 91.8% | 1750 images |
Data reduction technique
Automated ulcer detection using an optimized feature set
A thorough comparative analysis of the our designed feature selection technique with other techniques
A thorough analysis of the performance of designed system with other systems.
2 Materials and Models
2.1 Proposed System
- (a)
Load CE images
- (b)
Perform noise removal
- (c)
Perform image enhancement
- (d)
Extract features
- (e)
Reduce feature vector proposed data reduction technique
- (f)
Partition data into training and testing set
- (g)
Train the classifier model
- (h)
Classify test data using the trained classifier model
Brief idea of the system for automatic detection of ulcer
2.2 Pre-processing
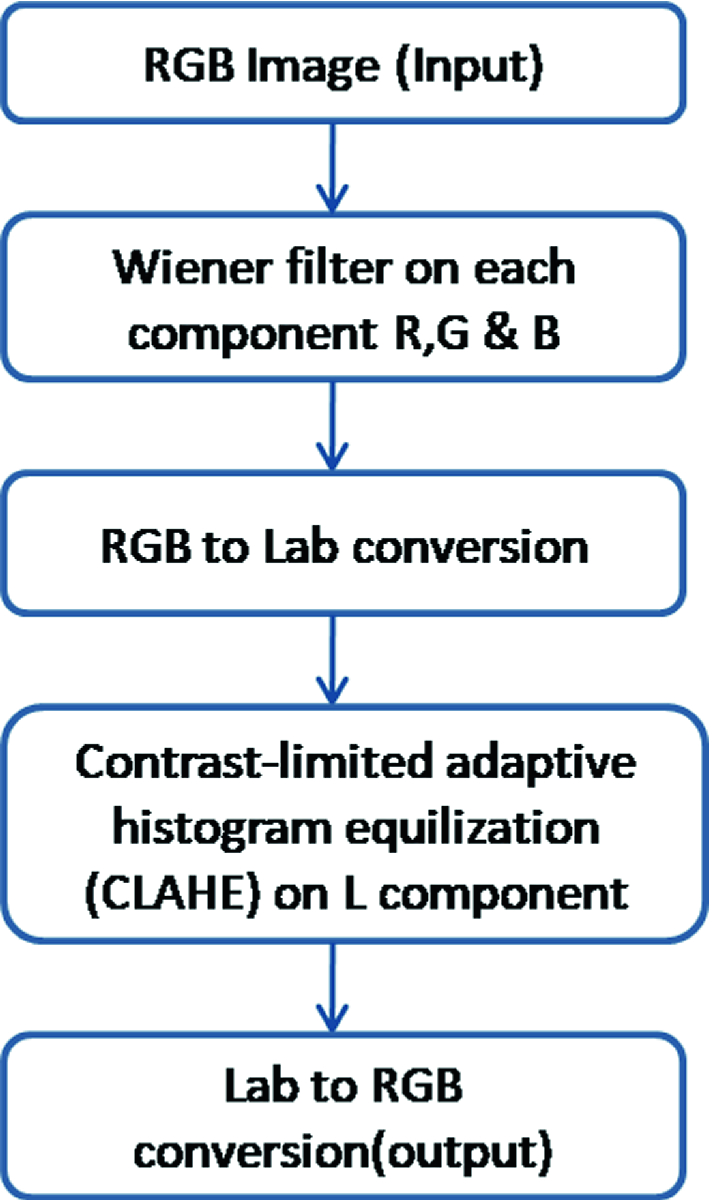
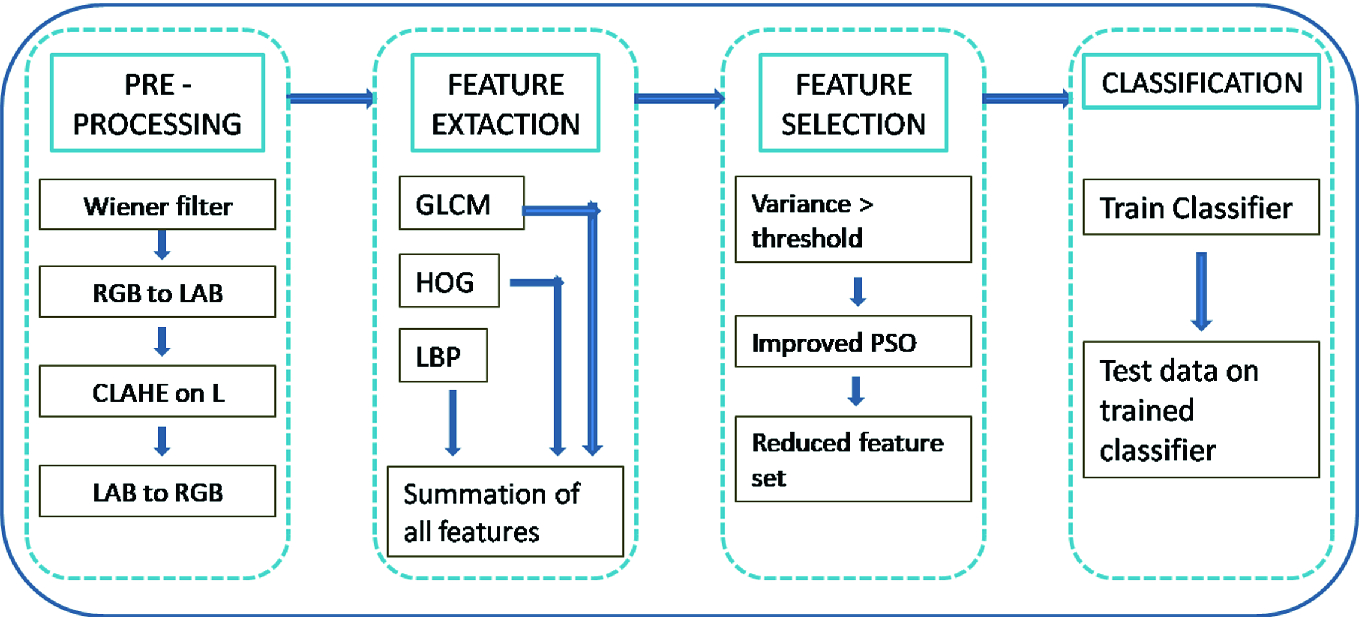
Pre-processing methodology
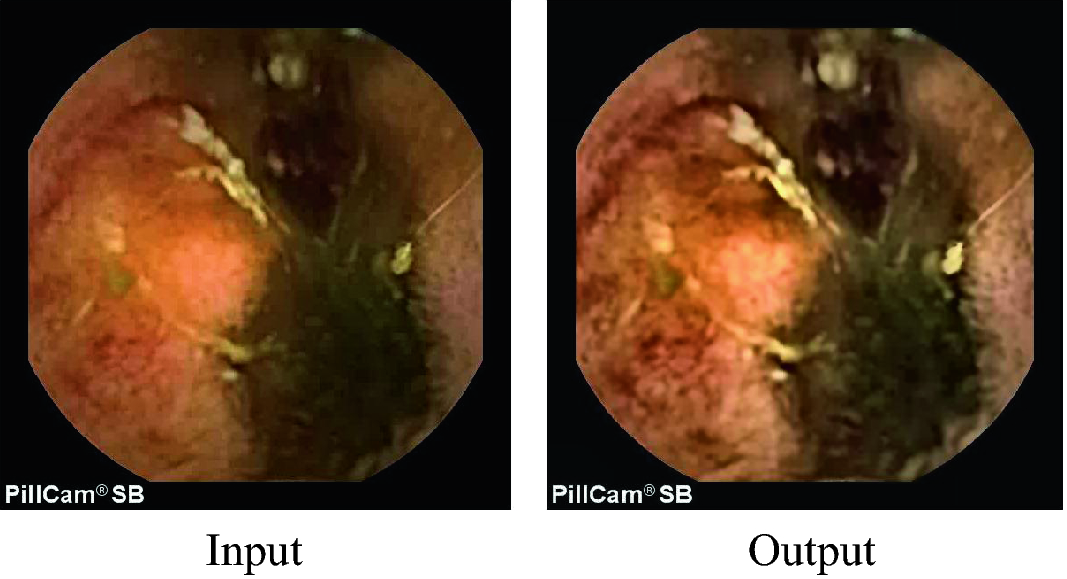
Sample output of pre-processing
2.3 Extraction of Features
Three different features are included in this study. Local binary pattern (LBP), gray-level co-occurrence matrix (GLCM) and the Histogram of oriented gradients (HOG) together forms the feature set. Ulcer in CE images exhibits very discriminative texture and color properties. GLCM is a statistical method. It is helpful for analyzing textures. This study utilizes 13 texture features computed from GLCM namely homogeneity, contrast, mean, correlation, energy, standard deviation, skewness, root mean square (RMS), variance, entropy, smoothness, kurtosis and inverse difference moment(IDM). Energy measures uniformity. Entropy is a measure of complexity and it is large for non-uniform images. Energy and Entropy are inversely and strongly correlated. Variance is a measure of non-uniformity. Standard deviation and variance are strongly correlated. IDM is a measure of similarity. When all the elements in the image are same, IDM reaches its maximum value.

Sample CE image and HOG descriptor visualization
LBP is a very discriminative textural feature [30]. CE images exhibits high variations related to illumination due to limited illumination capacity, limited range of vision inside GIT and motion of the camera. It is learned that LBP performs robustly to illumination variations. A total of 256 patters are obtained from a 3 × 3 neighborhood. Texture feature descriptor is the LBP histogram of 256 bin occurrence calculated over the region. A novel rotation invariant LBP is proposed in [30]. Patterns are uniform if they contain at most two transitions on a circular ring from 0 to 1 or 1 to 0. Examples of uniform patterns are 11111111 (nil transitions), 01000000 (2 transitions).
2.4 Feature Selection

![$$ \begin{aligned} {\text{V}}_{\text{i}} \left( {\text{t + 1}} \right) & = {\text{wV}}_{\text{i}} \left( {\text{t}} \right) + {\text{c1}} * {\text{rand}}\left( {\left[ {0,1} \right]} \right) * \left( {{\text{pbest}} - {\text{P}}_{\text{i}} \left( {\text{t}} \right)} \right) \\ & \quad + {\text{c}}2 * {\text{rand}}\left( {\left[ {0,1} \right]} \right) * \left( {{\text{gbest}} - {\text{P}}_{\text{i}} \left( {\text{t}} \right)} \right) \\ \end{aligned} $$](../images/471310_1_En_10_Chapter/471310_1_En_10_Chapter_TeX_Equ2.png)
Data reduction algorithm
Initial feature-set S = [1,2,…,n] Set threshold T
Final feature set
Choose features with variance > T
Surviving feature set
Set k
=
size of
Set values of PSO control parameters: w = 0.2, c1 = c2 = 2 Create and initialize particles with values of P and V; initialize gbest of the population as infinity Repeat: For itr = 1 to population Compute correlation C as a ranking criteria f = argmin(C) EndFor Update pbest = min(f) Update gbest = min (gbest,pbest) Update P using (1) Update V using (2) Until the termination criterion is satisfied Return improved-PSO selected values
Final reduced futures
|


The variance threshold is experimentally chosen to fit the application. These features are then fed to SVM classifier to classify between ulcer and normal images.
2.5 Classification
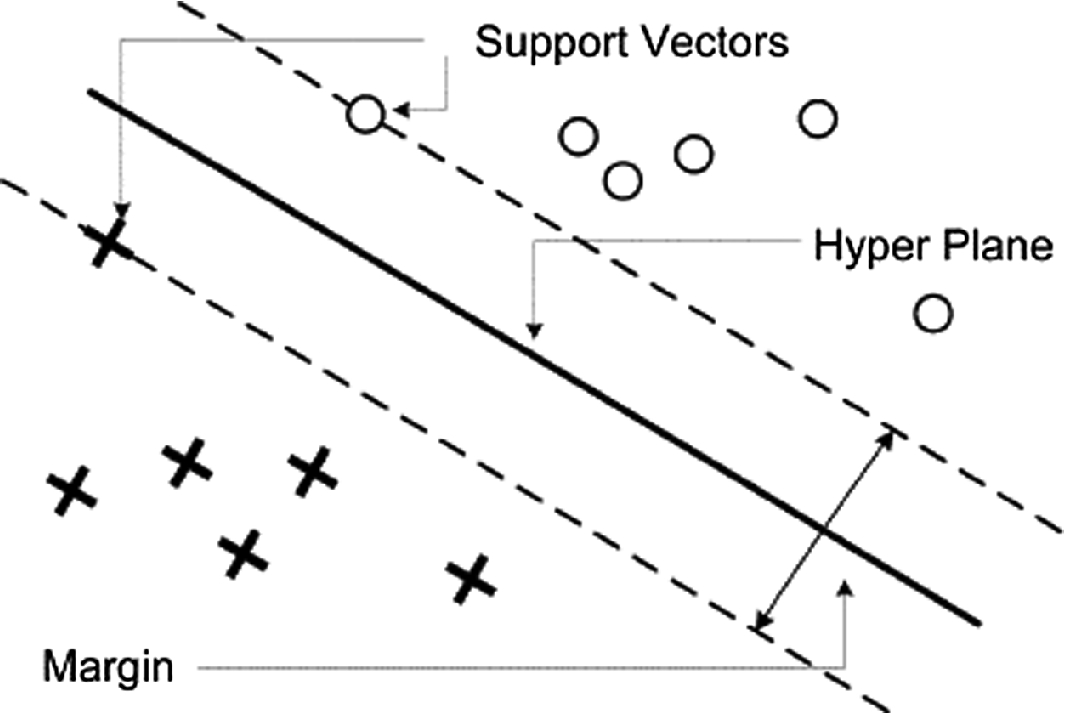
The concept of SVM [32]
The subsequent section presents detailed result analysis of the performance of the proposed system.
3 Results Analysis and Discussion
3.1 Dataset
Total of 1200 images from CE videos [33] is extracted out of which 201 images are of ulcers, and 999 images are normal. The dimension of each image is 576 × 576 pixels. All the images were manually diagnosed and annotated by physicians providing the ground truth. To avoid imbalanced data and overfitting 100 ulcer images and 100 normal images are carefully chosen from the annotated dataset.
3.2 Performance Metrics
Structure of the confusion matrix
Observer versus classifier | Prediction of classifier | ||
|---|---|---|---|
+ | − | ||
Actual observation | + | True-Positive [TP] | False-Negative [FN] |
− | False-Positive [FP] | True-Negative [TN] | |

![$$ {\text{Precision}} = \left[ {{\text{TP/}}\left( {\text{FP + TP}} \right)} \right] $$](../images/471310_1_En_10_Chapter/471310_1_En_10_Chapter_TeX_Equ4.png)


![$$ {\text{MCC = }}\left[ {\left( {{\text{TN}} * {\text{TP}}} \right) - \left( {{\text{FN}} * {\text{FP}}} \right)} \right]/{\text{SQRT}}\left[ {\left( {\text{FP + TP}} \right)\left( {\text{FN + TP}} \right)\left( {\text{FP + TN}} \right)\left( {\text{FN + TN}} \right)} \right] $$](../images/471310_1_En_10_Chapter/471310_1_En_10_Chapter_TeX_Equ8.png)
The system is implemented on Dell Optiplex 9010 desktop computer with processor—intel core i7 and RAM—6 GB using MATLAB R2017a.
3.3 Analysis of Results
A comparison of proposed feature selection
Method | Accuracy | Sensitivity | Specificity | Precision | F measure | MCC |
|---|---|---|---|---|---|---|
Relief F | 93.7 | 87.5 | 100 | 100 | 93.3 | 88.19 |
Fisher score | 91.66 | 90 | 93.3 | 93.10 | 91.5 | 83.37 |
Laplacian score | 91.66 | 83.33 | 100 | 100 | 90.9 | 84.51 |
Proposed (HVLC) | 95 | 95 | 95 | 95 | 95 | 90 |
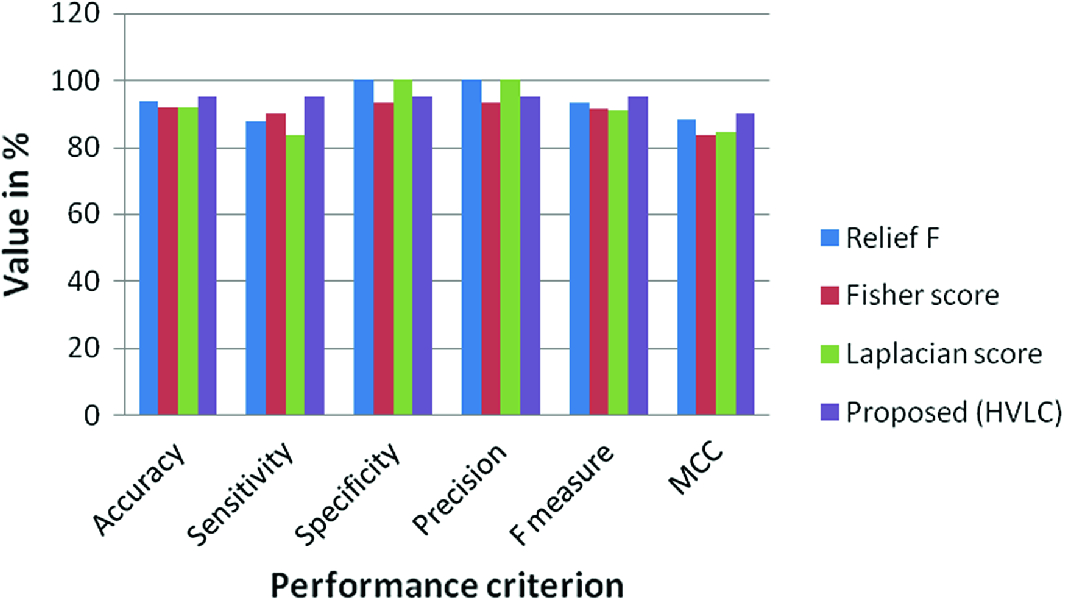
Performance comparison of feature selection techniques
A comparison of the proposed system
Method | Accuracy | Sensitivity | Specificity | Precision | F measure | MCC |
|---|---|---|---|---|---|---|
[3] | 80 | 60 | 100 | 100 | 75 | 65.5 |
[38] | 88.75 | 77.5 | 100 | 100 | 87.3 | 79.5 |
Proposed | 95 | 95 | 95 | 95 | 95 | 90 |
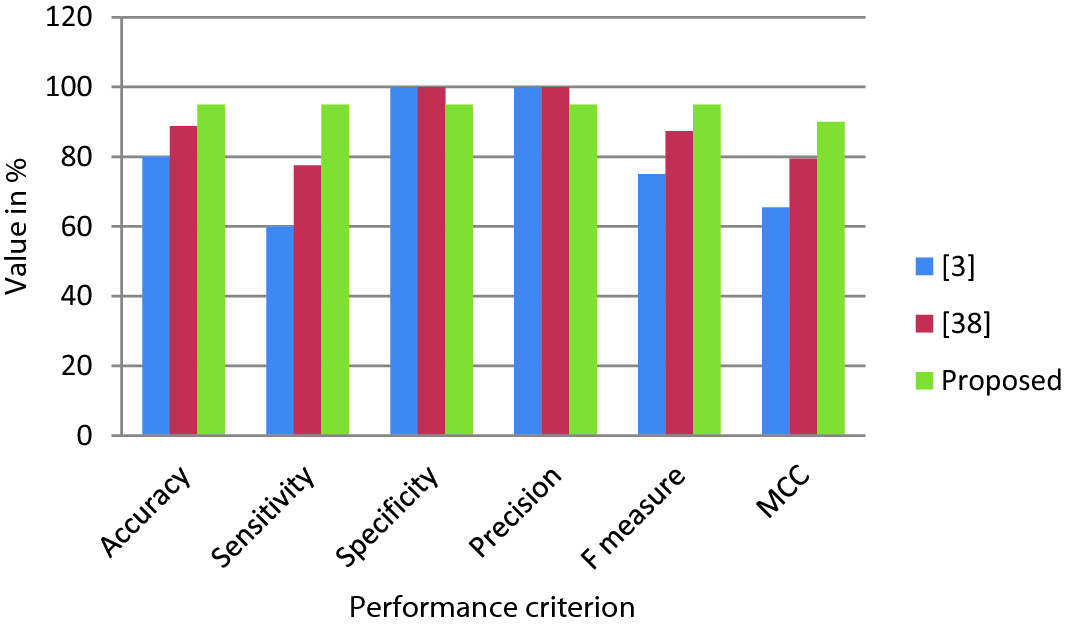
Performance comparison of CAD systems
As seen in Fig. 10, the proposed CAD system for ulcer detection in CE outperforms the other two systems in terms of accuracy, sensitivity, F measure, and MCC. However, it fails to outperform other systems in terms of specificity and precision. Reason for this is that the proposed systems have more false positives as compared to other systems. Approximately 5% of normal cases are misclassified as ulcer cases by the proposed system as compared to the other two systems.
4 Conclusion
With the advancements in the field of multimedia and IoT, the data generation has increased tremendously. This study focuses on the data reduction of one of the emerging medical imaging systems, capsule endoscopy. With advanced imaging system, CE generates a massive number of images with minute details. It is important for a CAD system to preserve minute details of a CE image and thereby provide a precise diagnosis. This study addresses the dilemma of reducing data while preserving crucial information. The proposed data reduction technique reduces the feature vector from 181548 to 3000 for each image. It reduces data by 98.34% and yet the proposed system outperforms when compared with other data reduction techniques and systems. The significant reduction in the size of data certainly reduces computational time and memory.