Table 1
Rates of Suicide in the United States per 100,000 People

Note. Data retrieved from Kochanek, Murphy, Xu, and Tejada-Vera (2016). *Age-adjusted rate
CHAPTER 2
A BRIEF HISTORY OF COMPLETED SUICIDES
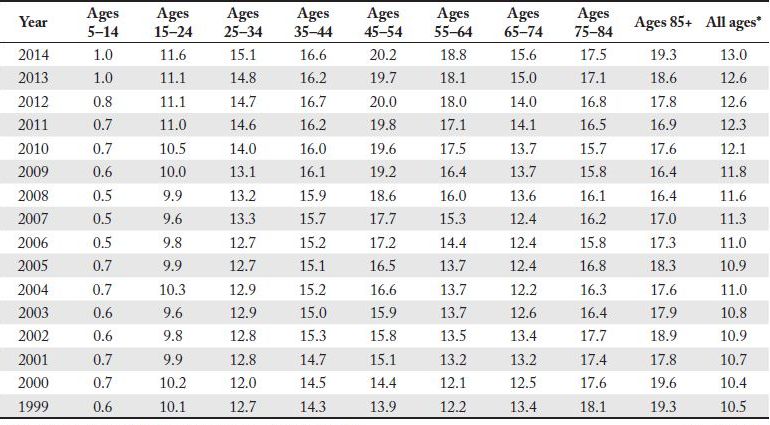
To understand suicidal behavior, specialists study prevalence rates. To that end, suicidologists rely on an equation: the number of people who complete suicide per 100,000 people per age group (X # per 100,000). For example, Table 1 reveals that for all age groups in 2014 there was an average prevalence rate of 13.0 per 100,000 people. Given that rates are established in age bands (i.e., 5–14, 15–24, 25–34, 35–44, 45–54, 55–64, 65–74, 75–84, 85+), analyzing the particular prevalence rate by age can be considered historically and comparatively. We can consider the range in prevalence rates over time and as compared to the other age bands. We can consider historic effects and emerging patterns. All of these comparisons can be made, but only for completed suicides, far less so for ideation and attempts.
Table 1
Rates of Suicide in the United States per 100,000 People

Note. Data retrieved from Kochanek, Murphy, Xu, and Tejada-Vera (2016). *Age-adjusted rate
Comparisons can also be made geographically (see Tables 2 and 3). The analysis of suicide rate by census region shows that the prevalence rate of all age groups combined in the Northeast (12.2 per 100,000) is well below the national average, while the prevalence rate in the West (18.7 per 100,000) is considerably higher. Of the 10 states with the highest prevalence rates, eight are Western states, with the highest rates occurring in Montana, Alaska, New Mexico, Wyoming, and Utah. The fewest absolute total numbers of suicides occurred in Rhode Island (113), while California had the greatest number (4,214).
Table 2
Suicide Rate by Region (2014)
| Region | Rate per 100,000 |
| Midwest | 13.8 |
| Northeast | 12.2 |
| South | 13.6 |
| West | 18.7 |
| Overall | 13.0 |
Note. Data compiled from Kochanek et al. (2016) based on U.S. Census Bureau (n.d.) regions.
Table 3
Suicide Rate by State (2014)
| Rank | State | Number | Rate per 100.00 |
| 1 | Montana | 251 | 23.9 |
| 2 | Alaska | 167 | 22.1 |
| 3 | New Mexico | 449 | 21.0 |
| 4 | Wyoming | 120 | 20.6 |
| 5 | Utah | 559 | 20.5 |
| 6 | Idaho | 320 | 20.0 |
| 7 | Colorado | 1,083 | 19.9 |
| 8 | Nevada | 573 | 19.6 |
| 9 | Oklahoma | 736 | 19.1 |
| 10 | Vermont | 124 | 18.7 |
| 11 | Oregon | 782 | 18.6 |
| 12 | West Virginia | 359 | 18.1 |
| 13 | Arizona | 1,244 | 18.0 |
| 14 | New Hampshire | 247 | 17.8 |
| 14 | North Dakota | 137 | 17.8 |
| 16 | Arkansas | 515 | 17.3 |
| 17 | South Dakota | 141 | 17.1 |
| 18 | Missouri | 1,017 | 16.3 |
| 19 | Kentucky | 728 | 16.0 |
| 20 | Maine | 220 | 15.7 |
| 20 | Kansas | 455 | 15.7 |
| 22 | South Carolina | 753 | 15.2 |
| 23 | Washington | 1,119 | 15.2 |
| 24 | Tennessee | 997 | 14.8 |
| 25 | Indiana | 948 | 14.3 |
| 25 | Louisiana | 679 | 14.3 |
| 27 | Florida | 3,035 | 13.9 |
| 28 | Hawaii | 204 | 13.8 |
| 29 | Nebraska | 251 | 13.4 |
| 30 | Pennsylvania | 1,817 | 13.3 |
| 30 | Michigan | 1,354 | 13.3 |
| 32 | Delaware | 126 | 13.2 |
| 33 | North Carolina | 1,352 | 13.1 |
| 33 | Wisconsin | 769 | 13.1 |
| 35 | Alabama | 715 | 13.0 |
| 36 | Iowa | 407 | 12.9 |
| 36 | Virginia | 1,123 | 12.9 |
| 38 | Georgia | 1,295 | 12.6 |
| 38 | Ohio | 1,491 | 12.6 |
| 40 | Mississippi | 380 | 12.5 |
| 41 | Minnesota | 686 | 12.2 |
| 41 | Texas | 3,254 | 12.2 |
| 43 | California | 4,214 | 10.5 |
| 43 | Illinois | 1,398 | 10.5 |
| 45 | Rhode Island | 113 | 10.1 |
| 46 | Connecticut | 379 | 9.8 |
| 47 | New Jersey | 786 | 8.3 |
| 48 | Massachusetts | 596 | 8.2 |
| 49 | Maryland | 606 | 8.2 |
| 50 | New York | 1,700 | 8.1 |
| 51 | District of Columbia | 52 | 7.8 |
| Overall | 42,826 | 13.0 |
Note. Data retrieved from Kochanek et al. (2016).
In considering these varied rates by state, we speculated that states with the highest percentage of gun ownership might correspond with the highest rankings of completed suicide. The logic is that access to lethal means is an important correlate of suicide. In fact, this hypothesis has some support in the rates of gun ownership. A study of firearms ownership and social gun culture (Kalesan, Villarreal, Keyes, & Galea, 2016) can be used to give context to this argument. The states highest in suicide rate also have high rates of gun ownership—Montana (suicide prevalence rate 23.9; 52.3% gun ownership), Alaska (22.1; 61.7%), New Mexico (21; 49.9%), and Wyoming (20.6; 53.8%); while the states lowest in suicide rate also have low rates of gun ownership—New York (8.1; 10.3%), Maryland (8.2; 20.7%), Massachusetts (8.2; 22.6%), New Jersey (8.3; 11.3%), and Connecticut (9.8; 16.6%).
The following data are taken from a variety of CDC reports, including the National Vital Statistics Reports and the CDC WISQARS data reporting system (CDC, 2017b; Kochanek et al., 2016; see also http://www.cdc.gov/nchs/products/nvsr.htm). This information helps us to visualize and understand patterns of suicidal behavior in the U.S.
 1.6% of all deaths are from suicide.
 On average, one suicide occurs every 11.9 minutes.
 Suicide is the 10th leading cause of death for all Americans.
 Suicide is the second leading cause of death for young people aged 15–24.
 Suicide is the fourth leading cause of death for 25–44 year olds.
 Suicide is the second leading cause of death among college students (Turner, Leno & Keller, 2013).
 Male suicides occur at nearly 3 times the rate of female suicides. In 2015, 33,994 males died by suicide, while 10,199 females died by suicide.
 In the U.S., death by suicide occurs more than twice as frequently as death by homicide. In 2015, 44,193 completed suicide, while 17,793 were victims of homicide.
 An estimated 1.3 million Americans age 18 and over attempted suicide in 2014 (CDC, 2015a).
Clearly suicide is commonplace, pervasive in our society, and preventable. Suicidologists are becoming increasingly more sophisticated about the phenomenon. However, preventing suicidal behavior is complicated and requires the expertise of myriad professionals. For example, policy makers, healthcare professionals, researchers, philosophers, educators, and others have great potential for helping fix this societal problem.
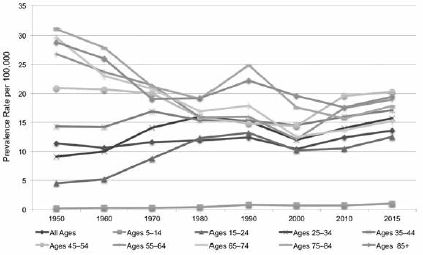
An examination of suicide rates over an extended time period allows trends to be studied (see Table 4 and Figure 2). Across time, the youngest group has had the lowest incidence rates, while the highest rates were in the oldest groups. The data show that adolescents were less likely to complete suicide than adults. However, the trends over time for these groups were very different. Since 1950, the overall suicide rate has increased from 11.4 to 13.6. During this time span, youth (ages 5–24) suicide rates have more than doubled, while older adult (ages 55–85+) suicide rates have declined dramatically. The suicide rates for the 35–54 age group have remained relatively constant. In 1950, the suicide rates for older adults (26.8 to 31.1) were more than 5 times the rate for adolescents aged 15 to 24 (4.5). By 2015, the rates for older adults ranged from 15.3 to 19.4 while the rate for adolescents was 12.5. In 2015, the rate for older adults was less than twice the rate for adolescents. Thus, although the current rates for youth suicide may not appear to be disproportionate to the overall population rates, the trends observed over time for these groups are quite different.
Table 4
A 60-Year Look at Prevalence Rates

Note. Rates are per 100,000; Data compiled from Centers for Disease Control and Prevention (2009, 2017a); Non-age-adjusted data.
Figure 2. U.S. suicide prevalence rates (CDC, 2009, 2017a).

TRENDS IN SUICIDAL BEHAVIOR
People have found myriad ways to kill themselves. Some of the popular methods from times past included poison, jumping from cliffs, and knives or swords. Contemporary approaches are wide ranging, from firearms to hanging. In some cases, such as car wrecks or death in a police shooting, intentionality may be unclear. A suicidal person may have intentionally crashed his or her car or induced a police officer to shoot. In such situations, psychological autopsies are a useful tool to determine cause of death relative to intent. More on psychological autopsy will appear in Chapter 6.
Firearms, suffocation, and poisons (including drugs/pharmaceuticals) are the most common methods of suicide. In recent times, important differences have existed between males and females relative to suicide attempts, completions, and approaches taken. Tables 5 and 6 illustrate the differences.
Table 5
Suicide Methods Used in the U.S. (2015); N = 44,193
| Method | Percent of Total Suicides | Number of Suicides |
| Firearms | 49.8% | 22,018 |
| Hanging, strangulation, suffocation | 26.8% | 11,855 |
| Poisons | 15.4% | 6,816 |
| All other methods | 8.0% | 3,504 |
Note. Data compiled from CDC (2017a).
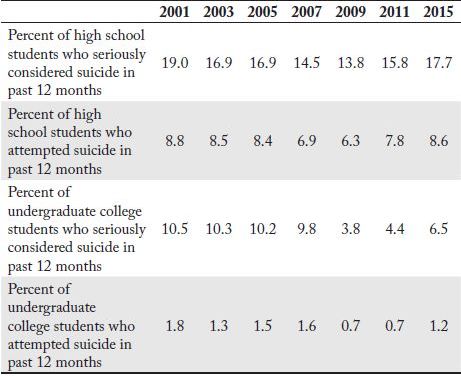
Table 7 illustrates suicide-related behavior among students in grades 9–12 during the 12 months prior to the survey being conducted in 2015. The grouping of students aged 15–24 into one category in National Vital Statistics Reports masks developmental differences among those who engage in suicidal behavior. The American College Health Association and the Centers for Disease Control Division of Adolescent and School Health each collect data that can be compared to see these developmental differences (see Table 8; American College Health Association, 2016; CDC, 2016). The two reports survey similar numbers of high school and college students. For example, the CDC’s 2015 Youth Risk Behavior Survey high school sample was 15,624 students from across the U.S., and the 2015 ACHA sample was 16,760 students from 40 colleges and universities across the U.S. The high school students represent a heterogeneous group while college students would be a more selective group relative to general ability, academic achievement, and life experience. The data from these two reports show significantly lower rates of (a) seriously considering and (b) attempting suicide for college students compared to high school students. In 2015, high school students attempted suicide at a rate that was 7 times greater than the rate for college students, and seriously considered suicide at a rate that was nearly 3 times higher than that for college students. From 2001 to 2009, both groups showed a positive downward trend in suicidal behavior, but there has been an uptick in recent years.
Table 7
Suicide-Related Behaviors of Students in Grades 9–12 in the U.S. (2015); N = 15,624
| Behavior (During the 12 Months Before the Survey) | Prevalence Rate (%) |
| Seriously considered attempting suicide | 17.7 |
| Made a plan about how they would attempt suicide | 14.6 |
| Attempted suicide one or more times | 8.6 |
| Suicide attempt resulting in an injury, poisoning, or an overdose that had to be treated by a doctor or nurse | 2.8 |
Note. Data retrieved from 2015 Youth Risk Behavior Survey, Tables 25 and 27 (CDC, 2016).
High school and college students will generally fall into the 15–24 age group, which had a dip in its steady increase in completed suicides in the first decade of the 21st century (see Table 4). This downward trend has reversed according to 2015 data. Suicide ideation and attempts among both college and high school students (Table 8) reflect this overall trend. The differences between the two groups imply that high school students are at significantly higher risk for suicidal behaviors, particularly for suicide attempts, than college students. It may be that students find greater acceptance in the college environment than in the high school environment because they are able to find a peer group that readily accepts them as they are. For students who are nonmodal (e.g., high-ability students), or who possess characteristics that make them feel very different from most of their peers, finding this acceptance in high school can be difficult.
Table 8
Trends in Suicide-Related Behaviors of High School and College Students in the U.S.

Note. Data compiled from CDC (2013, 2016), and American College Health Association (2016).
Acceptance in a peer group is not necessarily an explanation for differences in the nature of suicidal ideation between adolescents or young adults and the elderly. We can infer from developmental differences and life differences between these age groups that the rationalizations these individuals use to justify suicidal behaviors are profoundly different. Youth suicidal behavior tends to be driven by the desire to escape relatively temporary emotional pains (Shneidman, 1993), while the need to be free of chronic physical pain is a common rationalization of suicidal behavior for the elderly. Young people have immature notions of permanence compared to older people, and this becomes an essential factor in the suicide decision. Older people have a better sense of temporality because of their life experiences. Furthermore, the emotional pains of youth will subside, while the physical pains of the elderly often worsen. Therefore, suicide ideation is a qualitatively different phenomenon among diverse age groups.
As this summary of the available data indicates, completed suicides are a reality of modern society. In 2015, 36,277 people under the age of 65 died by suicide. The CDC calculates the number of years of potential life if these thousands of people had lived just to the age of 65 (CDC, 2015b). These 869,164 years of potential productivity, creativity, and social interactions were lost forever when they died. Some unknown number of the tens of thousands of deaths by suicide each year is likely to be of individuals with gifts and talents. In the next chapter, we will examine the research that offers clues to how we may identify and support the unique population that is the focus of this book.
KEY POINTS
 Suicidologists study prevalence rates that are established in age bands to understand suicidal behavior and to consider them historically and comparatively.
 Analysis of suicide rates by census region: Highest suicide rates in 2014 were recorded in the Western U.S., and the lowest rates were recorded in the Northeast.
 Access to lethal means is an important correlate of suicide. Hence, the states with the highest percentage of gun ownership correspond with the highest rankings of completed suicide.
 Suicide is the second leading cause of death among college students.
 Suicide is commonplace, pervasive to our society, and preventable.
 Policy makers, health care professionals, researchers, philosophers, educators, and others have great potential for helping prevent suicide.
 Examination of suicide prevalence rates from 1950–2015 showed that the suicide rate has been increasing, but at a more rapid pace for youth (ages 5–24), whose rates have nearly tripled.
 The most common contemporary approaches to completing suicide are firearms, followed by hanging or suffocation.
 High school students are at significantly higher risk for suicidal behaviors than college students.
 Suicide ideation is a qualitatively different phenomenon among diverse age groups.