Appendix 2
TPO versus Volume Profiles
Humans have a fascination with numbers. We crave exactness and abhor ambiguity; if we can't comfortably comprehend a piece of information, we often discard it in favor of contrary indicators that match our preconceived notions. Yet it is precisely in moments of uncertainty that the experienced trader identifies opportunity, like the savvy angler who looks for a subtle ripple in the slow water below a snag.
Consider volume, which can serve to validate market opportunities. You must constantly ask yourself, “Is volume validating the current market direction?” Volume profiles (not to be confused with Market Profiles) show you exactly how much volume—including relative volume—occurred at each price, as well as the exact number of contracts for the entire session. See the example in Figure A2.1.
Figure A2.1 Volume Example
To reiterate, the three main components of the auction process are:
It's important to note that what the volume profile does not show is far more important to the way I trade that what it actually displays. I believe it is the more ambiguous combination of time and volume—rather than volume alone—that provides the most timely, relevant insight (when considered within the larger market context). Volume is important, but so is time, because a price that is not accepted over time is, in fact, rejected.
All traders know the psychological pressure of time (tick, tick, tick). Being in a trade that begins to stall can create serious psychological doubt. And the longer a trade fails to advance in our favor, the longer we have to sit there imagining what might be going wrong. For example, the late liquidation or short-covering rally in the pit session may be the result of time running out for day traders, rather than a lack of volume. The most likely scenario is that these situations are caused by a combination of both factors.
Single Price Level Distortions
It is not uncommon to witness much higher volume at or around a single price level. For example, the previous day's high or low, or the overnight high or low, is likely to attract above-average trade. Additional examples include the opening and the halfback. When viewed on an absolute-volume basis, these levels may appear to be far more important than they deserve to be. Therefore, it's imperative to view volume in relation to time, which is more likely to smooth out these prominent levels, allowing us to better maintain a more complete overall perspective.
End of Day Total Volume versus Ongoing Volume throughout the Day
Markets often develop a direction, or tone, for a single day. This direction may not be confirmed by volume, however, even while the auction continues until the close. In many instances, the movement is corrected the following day due to lack of volume. In other words, there is often a delay in the effect that such a low-volume move may have on a market.
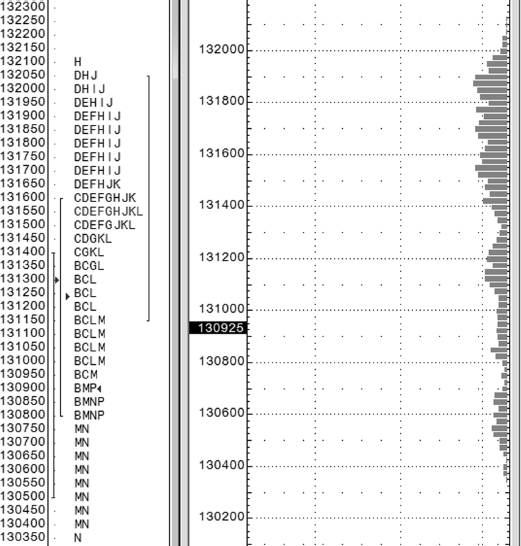
Anomalies
An anomaly is a single price or price level that lacks symmetry, which creates an unusual shape in the Market Profile. Anomalies represent structural weakness, and they're created through a combination of time and price—and therefore may not show up on volume profiles. In fact, volume profiles alone often identify false anomalies, such as the previous day's high or low, as discussed earlier. These points of structural weakness are often revisited during the current or following trading session.
The graphic in Figure A2.2 will help make this point.
Figure A2.2 TPO Profiles Next to Volume Profiles
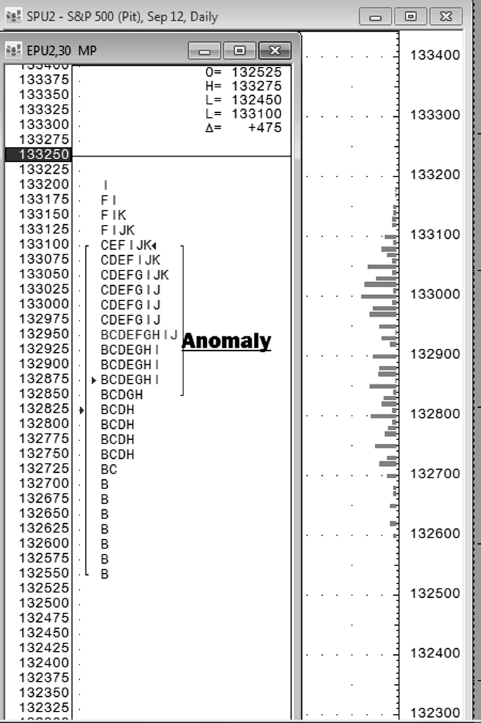
It's hard to believe that these two charts are from the same market on the same day. The difference is revealed by combining volume and time. In a conventionally constructed Market Profile, volume is estimated by multiplying price x time—the greater the number of TPOs reading from left to right, the higher the estimated volume. While this method isn't perfect, I believe it offers superior insight to volume in a vacuum.
The Market Profile—with its extremely visual, pattern-forming TPOs—enables me to better answer pivotal questions about how volume is being distributed throughout the day:
 Is volume being distributed within a rotational market? Is volume being distributed as part of a trend?
I start a new Market Profile anytime I think that a new directional auction is underway. That way, I can compare the new volume to the old volume within the context of distinct directional movements.
Too Focused on Volume
Of course, volume is only one element to consider during any given trading day. Among the other considerations (discussed elsewhere in this book, and in Markets in Profile) are:
Value—developing higher, lower, overlapping, and so on. Which timeframe is in control (this is paramount). Rotational trading day. Trend day. One-timeframing. Short covering. Long liquidation.Conclusion
After a lifetime spent observing markets, I choose to give more emphasis to the Market Profile—with its evolving, multidimensional structure—because I believe it provides a more accurate representation of the auction process by juxtaposing volume and time. In addition, it smooths out aberrations when there is high volume at the opening price, as well as other static references, like the prior pit session high and low, and the overnight high and low.
Ultimately, you must make your own decisions as you carefully choose which tools you use and which indicators you follow as you trade. Rest assured that no matter what you decide, there is never a single, simple answer. I suggest you compare volume profiles and Market Profiles side by side, writing down your observations as you see how they mirror and/or contradict each other. What does the ambiguity tell you? Can you identify change before your competitors (mostly laggards) transform opportunity into the familiar patterns of consensus?