The first known use of the term "geographic information system" was by Roger Tomlinson in 1968. It was used in his paper called A Geographic Information System for Regional Planning, and because of this, he is commonly known as the "father of GIS".
The first known application for spatial analysis was in 1832 by a French geographer named Charles Picquet. He represented the 48 districts of Paris by halftone color gradients following the number of deaths incurred by the outbreak of cholera per 1,000 inhabitants.
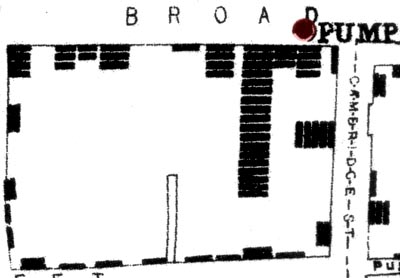
John Snow was determined to find the source of a cholera outbreak in 1854. He attempted to find the source of the cholera outbreak in London’s Broad Street region by marking points on a map to depict where the cholera victims lived, and by connecting the cluster he found, he was able to link the source of the outbreak to a water source that was nearby. This was one of the first known effective employments of geographic procedures in the study of disease transmission.
In his map, he used bars to represent deaths that occurred at specified households; however, in his first map, there were several minor errors. One of these errors was the location of the Broad Street pump:

With the second map he published, he fixed his errors, which included the location of the pump:

While essential components of geology existed beforehand in cartography, John Snow's guide was extremely remarkable. It was novel because of the way that he utilized cartographic techniques to portray as well as examine groups of geologically subordinate wonders. And because of this, John Snow is known to many as a pioneer in disease mapping, in which many of the concepts he established are still used today in conjunction with many other aspects of GIS by the Centers for Disease Control and Prevention (CDC).
By the early 20th century, we saw the advancement of photozincography (also known as heliozincography). Photozincography gave the ability for maps to be split into layers. This meant that each layer could hold information only relevant to that specific layer, such as vegetation, trees, or waterways. It was mainly used for printing contours, since drawing these was a very labor-intensive task and thus made this technique extremely useful for cartographers. Having conduits, trees, or vegetation on independent layers implied that they could be chipped away at without alternate layers there to confound the artist, or to cause issues when, say, structures were obstructing something that should have been checked. This is also still used today; one such usage is when marking the location of electrical lines that are underground, or water pipes for houses:

With photozincography, maps like this were initially drawn on glass plates but were later changed over to plastic film as there were numerous points of interest regarding plastic over glass. Plastic was lighter, required less space for capacity, was less fragile, and more. At the point when the greater part of the layers were done, they were joined into a solitary picture utilizing an extensive procedure camera. When color printing became available, the layers' conception was withal utilized for engendering separate plates for engendering each color.
The utilization of layers later became one of the main features of contemporary GIS, and the photographic process described is not considered to be a component of GIS itself as the maps were and are just images without any databases linked to them. Advancement of PC equipment that was impelled by atomic weapons prompted broadly useful PC mapping applications in the mid 1960s. In 1960, the world's first obvious operational GIS by the Federal Department of Forestry and Rural Development in Ottawa, Ontario, Canada was created.
This first obvious operational GIS was created by none other than Dr. Roger Tomlinson. This GIS was known as the Canada Geographic Information System (CGIS), and it was utilized to store, break down, and control the information gathered for the Canada Land Inventory. The Canada Land Inventory was an administration push to decide the land capacity for provincial Canada by mapping data regarding the dirt, horticulture, amusement, untamed life, waterfowl, ranger service, and land use at a size of 1 to 50,000. Due to the scale and the amount of information that needed to be stored, a rating classification factor was created to permit easier and more effective analysis.
While there were other computer mapping applications at the time, CGIS made massive improvements as it provided capabilities for overlay, measurement, scanning, and digitizing the map data. It was also able to support a national coordinate system that spanned the entire continent with coded lines as arcs. This meant that it had a true embedded topology and it stored the attributes and locational information in separate files. The utilization of overlays in advancing the spatial investigation of focalized geographic information is the motivation behind Tomlinson turning out to be known as the "father of GIS".
In 1964, Howard T. Fisher shaped the Laboratory for Computer Graphics and Spatial Analysis at the Harvard Graduate School of Design (LCGSA 1965 – 1991), where a large number of essential hypothetical ideas in spatial information to be handled were produced. By the 1970s, seminal software code and systems were distributed by the LCGSA. These systems were SYMAP, GRID, and ODYSSEY; not only did these systems serve as sources for subsequent commercial development, but they themselves were distributed to colleges, research centers, and business conglomerates worldwide.
MOSS and GRASS GIS were two public GIS systems that were in development by the late 1970s. Roughly a few years later, in the early 1980s, new commercial vendors for GIS software emerged. Those commercial vendors were the Environmental Systems Research Institute, CARIS, MapInfo Corporation, ERDAS, and M&S Computing, along with Bentley Systems Incorporated for CAD. These sellers were fruitful in having the capacity to fuse numerous new highlights and ways to deal with GIS programming, for example, consolidating the original ways to deal with the partition of spatial and characteristic data with second-age ways to deal with sorting out trait information into database structures and additionally fusing CGIS highlights.
The first well-known work area GIS item that was discharged for the DOS OS was known as the Mapping Display and Analysis System, and was released to the public in 1986. In 1990, MIDAS was ported to the Microsoft Windows platform and was renamed to MapInfo for Windows during that process. This marked the process of moving GIS from the research sector over into the business sector.
One critical note to include is that CGIS kept going great into the 1990s and had fabricated a substantial advanced land asset database in Canada. CGIS was created as a centralized server-based framework for the government as a commonplace asset for arranging and administration programming. Along these lines, it had the capacity to do mainland wide investigation of complex datasets, however, CGIS was never made accessible in the business market sphere.
At the turn of the 20th century, users were beginning to explore GIS data over the internet. This called for data and transfer standardization. All of this was caused by the rapid growth in various systems and, as such, showcased the flaw that there were many different systems that used very few similar methods or data formats and needed to be consolidated.
As of late, there is an ever-growing number of open source GIS packages that run on a range of operating systems and software that are very easily customized to perform specific tasks. Research institutes and hobbyists are making mapping applications and geospatial data readily available via the internet.