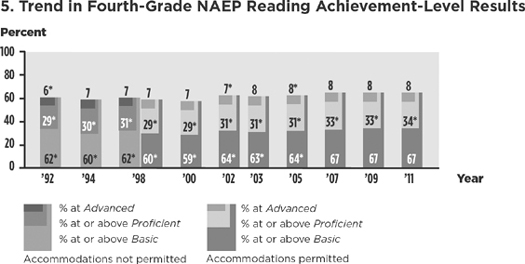
Graphs 1, 2, 3, and 4 appear in the text in chapter 5.

*Significantly different (p<.05) from 2011
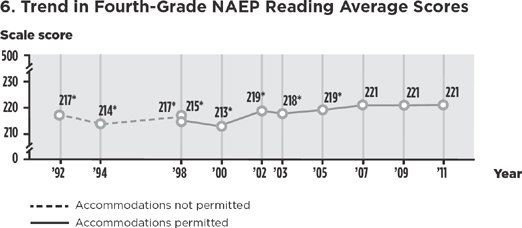
*Significantly different (p<.05) from 2011
*Significantly different (p<.05) from 2011
NOTE: Black includes African American. Race categories exclude Hispanic origin. Score gaps are calculated based on differences between unrounded average scores.
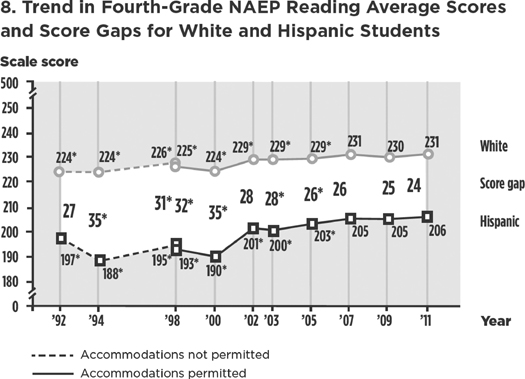
*Significantly different (p<.05) from 2011
NOTE: White excludes students of Hispanic origin. Hispanic includes Latino. Score gaps are calculated based on differences between unrounded average scores.
#Rounds to zero
*Significantly different (p<.05) from 2011
1 Score gaps reflect the average score for Asian/Pacific Islander students minus the score for white students.
NOTE: Pacific Islander includes Native Hawaiian. Race categories exclude Hispanic origin. Score gaps are calculated based on differences between unrounded average scores. Score differences between Asian/Pacific Islander and white students were not found to be statistically significant in 1994, 1998, 2000, 2005, and 2007.
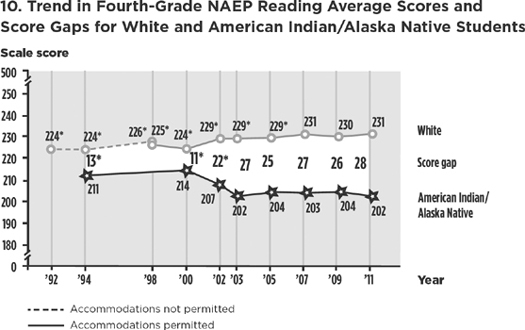
*Significantly different (p<.05) from 2011
NOTE: Sample sizes were insufficient to permit reliable estimates for American Indian/Alaska Native students in 1992 and 1998. Race categories exclude Hispanic origin. Score gaps are calculated based on differences between unrounded average scores. Score differences between white and American Indian/Alaska Native students were not found to be statistically significant in 1994 and 2000.
*Significantly different (p<.05) from 2011
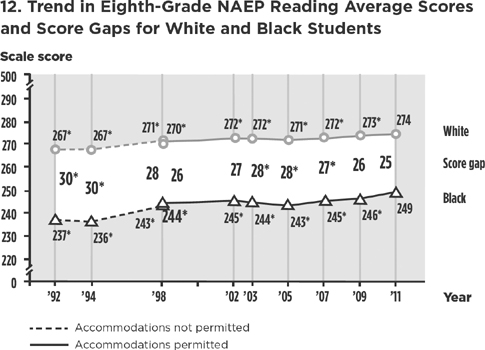
*Significantly different (p<.05) from 2011
NOTE: Black includes African American. Race categories exclude Hispanic origin.
Score gaps are calculated based on differences between unrounded average scores.
* Significantly different (p<.05) from 2011
NOTE: White excludes students of Hispanic origin. Hispanic includes Latino. Score gaps are calculated based on differences between unrounded average scores.

#Rounds to zero
* Significantly different (p<.05) from 2011
1 Score gaps reflect the average score for Asian/Pacific Islander students minus the score for white students.
NOTE: Pacific Islander includes Native Hawaiian. Race categories exclude Hispanic origin. Score gaps are calculated based on differences between unrounded average scores. Score differences between Asian/Pacific Islander and white students were not found to be statistically significant in 1992, 1994, 1998, 2003, 2005, 2007, 2009, and 2011.
* Significantly different (p<.05) from 2011
NOTE: Sample sizes were insufficient to permit reliable estimates for American Indian/Alaska Native students in 1992 and 1998. Race categories exclude Hispanic origin. Score gaps are calculated based on differences between unrounded average scores.
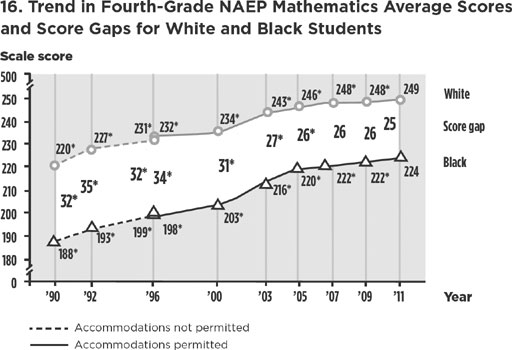
* Significantly different (p<.05) from 2011
NOTE: Black includes African American. Race categories exclude Hispanic origin. Score gaps are calculated based on differences between unrounded average scores.
* Significantly different (p<.05) from 2011
NOTE: White excludes students of Hispanic origin. Hispanic includes Latino. Score gaps are calculated based on differences between unrounded average scores.
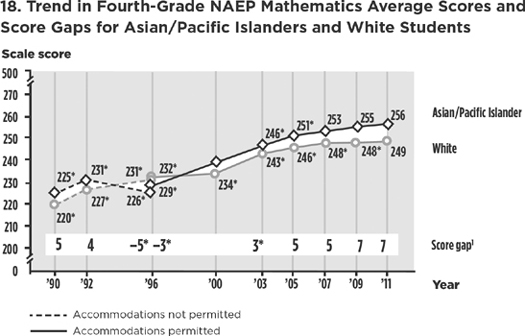
*Significantly different (p<.05) from 2011
1 Score gaps reflect the average score for Asian/Pacific Islander students minus the score for white students.
NOTE: Special analyses raised concerns about the accuracy and precision of the results for Asian/Pacific Islander students in 2000; therefore, they are omitted from this figure. Pacific Islander includes Native Hawaiian. Race categories exclude Hispanic origin. Score gaps are calculated based on differences between unrounded average scores. Score differences between Asian/Pacific Islander and white students were not found to be statistically significant in 1990, 1992, and 1996.
* Significantly different (p<.05) from 2011
NOTE: Sample sizes were insufficient to permit reliable estimates for American Indian/Alaska Native students in 1990, 1992, and 1996 (accommodations-not-permitted sample). Race categories exclude Hispanic origin. Score gaps are calculated based on differences between unrounded average scores. The score difference between white and American Indian/Alaska Native students was not found to be statistically significant in 1996.

# Rounds to zero
* Significantly different (p<.05) from 2011
1 Accommodations not permitted
NOTE: Special analyses raised concerns about the accuracy and precision of the results for Asian/Pacific Islander students in 2000; therefore, they are omitted from this figure. Sample sizes were insufficient to permit reliable estimates for American Indian/Alaska Native students in 1990 and 1992. Black includes African American, Hispanic includes Latino, and Pacific Islander includes Native Hawaiian. Race categories exclude Hispanic origin. Results are not shown for students whose race/ethnicity was unclassified or two or more races. Detail may not sum to totals because of rounding.
* Significantly different (p<.05) from 2011

* Significantly different (p<.05) from 2011
* Significantly different (p<.05) from 2011
NOTE: Black includes African American. Race categories exclude Hispanic origin. Score gaps are calculated based on differences between unrounded average scores.

* Significantly different (p<.05) from 2011
NOTE: White excludes students of Hispanic origin. Hispanic includes Latino.
Score gaps are calculated based on differences between unrounded average scores.
* Significantly different (p<.05) from 2011
1 Score gaps reflect the average score for Asian/Pacific Islander students minus the score for white students.
NOTE: Special analyses raised concerns about the accuracy and precision of the results for Asian/Pacific Islander students in 1996; therefore, they are omitted from this figure. Pacific Islander includes Native Hawaiian. Race categories exclude Hispanic origin. Score gaps are calculated based on differences between unrounded average scores. Score differences between Asian/Pacific Islander and white students were not found to be statistically significant in 1990, 1992, and 2000.
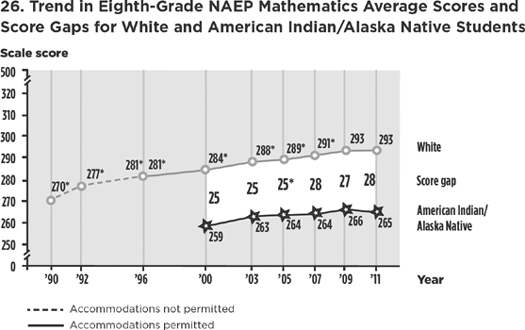
* Significantly different (p<.05) from 2011
NOTE: Sample sizes were insufficient to permit reliable estimates for American Indian/Alaska Native students in 1990, 1992, and 1996. Race categories exclude Hispanic origin. Score gaps are calculated based on differences between unrounded average scores.
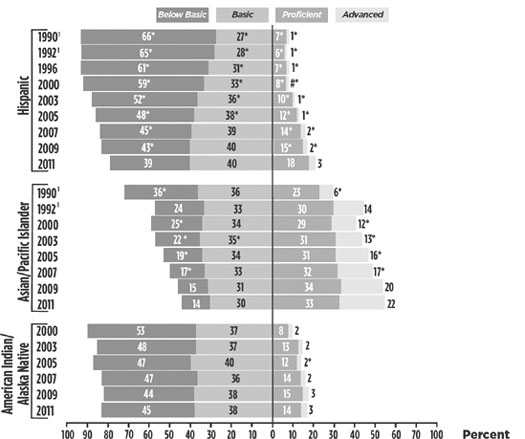
# Rounds to zero
* Significantly different (p<.05) from 2011
1 Accommodations not permitted
NOTE: Special analyses raised concerns about the accuracy and precision of the results for Asian/Pacific Islander students in 1996; therefore, they are omitted from this figure. Sample sizes were insufficient to permit reliable estimates for American Indian/Alaska Native students in 1990, 1992, and 1996. Black includes African American, Hispanic includes Latino, and Pacific Islander includes Native Hawaiian. Race categories exclude Hispanic origin. Results are not shown for students whose race/ethnicity was unclassified or two or more races. Detail may not sum to totals because of rounding.
* Significantly different (p<.05) from 2008

* Significantly different (p<.05) from 2008
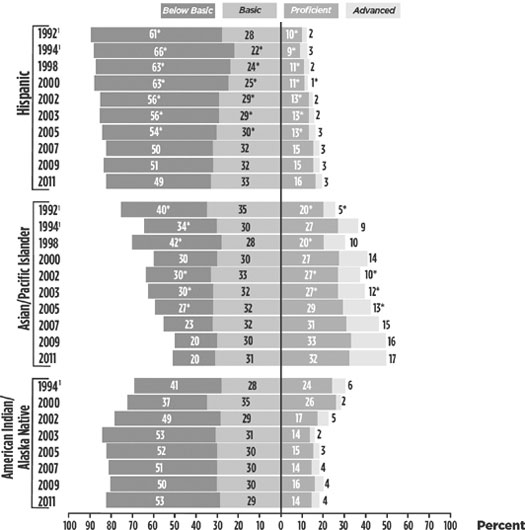
* Significantly different (p<.05) from 2011
1 Accommodations not permitted
NOTE: Sample sizes were insufficient to permit reliable estimates for American Indian/Alaska Native students in 1992 and 1998. Black includes African American, Hispanic includes Latino, and Pacific Islander includes Native Hawaiian. Race categories exclude Hispanic origin. Results are not shown for students whose race/ethnicity was unclassified. Detail may not sum to totals because of rounding.
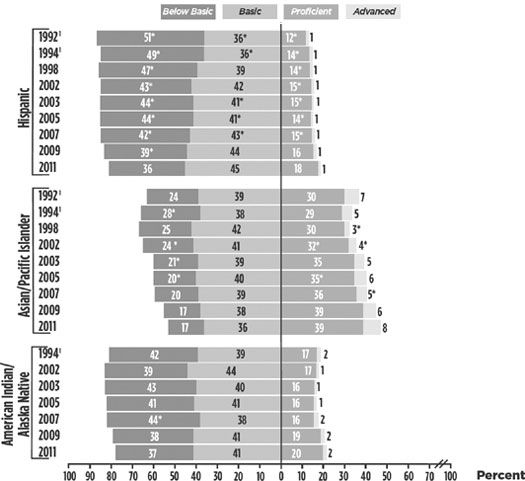
# Rounds to zero
* Significantly different (p<.05) from 2011
1 Accommodations not permitted
NOTE: Sample sizes were insufficient to permit reliable estimates for American Indian/Alaska Native students in 1992 and 1998. Black includes African American, Hispanic includes Latino, and Pacific Islander includes Native Hawaiian. Race categories exclude Hispanic origin. Results are not shown for students whose race/ethnicity was unclassified. Detail may not sum to totals because of rounding.
NOTE: The averaged freshman graduation rate is the number of graduates divided by the estimated freshman enrollment count four years earlier. This count is the sum of the number of eighth graders five years earlier, the number of ninth graders four years earlier, and the number of tenth graders three years earlier, divided by 3. Ungraded students were allocated to individual grades proportional to each state’s enrollment in those grades. Graduates include only those who earned regular diplomas or diplomas for advanced academic achievement (e.g., honors diplomas) as defined by the state or jurisdiction. The 2005–6 national estimates include imputed data for the District of Columbia, Pennsylvania, and South Carolina. The 2007–8 estimate for Maine includes graduates from semiprivate schools. The 2008–9 national estimates include imputed data for California and Nevada.
SOURCE: U.S. Department of Education, National Center for Education Statistics, Common Core of Data (CCD), “NCES Common Core of Data State Dropout and Completion Data File,” school year 2007–8; 2008–9, Version 1a; and “State Nonfiscal Survey of Public Elementary/Secondary Education,” 1990–91, Version 1b; 1995–96, Version 1b; 2000–2001, Version 1b; 2005–6, Version 1b; and 2006–7, Version 1b.
NOTE: Status completion rates measure the percentage of eighteen- through twenty-four-year-olds who are not enrolled in high school and who also hold a high school diploma or alternative credential, such as a General Educational Development (GED) certificate. Those still enrolled in high school are excluded from the analysis. Beginning in 2003, respondents were able to identify themselves as being two or more races. The 2003 through 2009 categories for white, non-Hispanic, and black, non-Hispanic contain only respondents who indicated just one race. The Hispanic category includes Hispanics of all races and racial combinations. Due to small sample sizes for some or all of the years shown in the figure, Asians/Pacific Islanders and American Indians/Alaska Natives who are not Hispanic are included in the totals but not shown separately. The “two or more races, non-Hispanic” category is also included in the total in 2003 through 2009 but not shown separately due to small sample sizes. The variability of Hispanic status rates reflects, in part, small sample size of Hispanics in earlier years of the Current Population Survey (CPS). Beginning with 1987, estimates reflect new editing procedures for cases missing school enrollment item data. Estimates beginning with 1992 reflect new wording of the educational attainment item. Estimates beginning with 1994 reflect changes due to newly instituted computer-assisted interviewing. For details about changes in the CPS over time, please see P. Kaufman, M. N. Alt, and C. Chapman, Dropout Rates in the United States: 2001 (NCES 2005-046) (Washington, D.C.: National Center for Education Statistics, Institute of Education Sciences, U.S. Department of Education, 2004).
SOURCE: U.S. Department of Commerce, Census Bureau, Current Population Survey (CPS), October 1972–2009.
NOTE: Status completion rates measure the percentage of eighteen- through twenty-four-year-olds who are not enrolled in high school and who also hold a high school diploma or alternative credential, such as a General Educational Development (GED) certificate. Those still enrolled in high school are excluded from the analysis. Respondents were able to identify themselves as being two or more races. The white, non-Hispanic; black, non-Hispanic; Asian/Pacific Islander, non-Hispanic; and American Indian/Alaska Native, non-Hispanic categories consist of individuals who considered themselves to be one race and who did not identify as Hispanic. Non-Hispanics who identified themselves as multiracial are included in the “two or more races, non-Hispanic” category. The Hispanic category consists of Hispanics of all races and racial combinations.
SOURCE: U.S. Department of Commerce, Census Bureau, Current Population Survey (CPS), October 2009.
SOURCE: U.S. Department of Education, National Center for Education Statistics, Common Core of Data (CCD, NCES), Common Core of Data State Dropout and Completion Data file, School Year 2009–10, Version 1a.
NOTE: The status dropout rate indicates the percentage of sixteen- through twenty-four-year-olds who are not enrolled in high school and who lack a high school credential. High school credentials include high school diplomas and alternative credentials, such as a General Educational Development (GED) certificate. Beginning in 2003, respondents were able to identify themselves as being two or more races. The 2003 through 2009 categories for white, non-Hispanic, and black, non-Hispanic contain only respondents who indicated just one race. The Hispanic category includes Hispanics of all races and racial combinations. Due to small sample sizes for some or all of the years shown in the figure, Asians/Pacific Islanders and American Indians/Alaska Natives who are not Hispanic are included in the totals but not shown separately. The “two or more races, non-Hispanic” category is also included in the totals in 2003 through 2009 but not shown separately due to small sample sizes. The variability of Hispanic status rates reflects, in part, small sample size of Hispanics in earlier years of the Current Population Survey (CPS). Beginning with 1987, estimates reflect new editing procedures for cases with missing data on school enrollment items. Estimates beginning with 1992 reflect new wording of the educational attainment item. Estimates beginning with 1994 reflect changes due to newly instituted computer-assisted interviewing. For details about changes in the CPS over time, please see P. Kaufman, M. N. Alt, and C. Chapman, Dropout Rates in the United States: 2001 (NCES 2005-046) (Washington, D.C.: National Center for Education Statistics, Institute of Education Sciences, U.S. Department of Education, 2004).
SOURCE: U.S. Department of Commerce, Census Bureau, Current Population Survey (CPS), October 1972–2009.
! Interpret data with caution. The coefficient of variation (CV) for this estimate is 30 percent or greater. NOTE: The status dropout rate indicates the percentage of sixteen- through twenty-four-year-olds who are not enrolled in high school and who lack a high school credential. High school credentials include high school diplomas and alternative credentials, such as a General Educational Development (GED) certificate. Respondents were able to identify themselves as being two or more races. The white, non-Hispanic; black, non-Hispanic; Asian/Pacific Islander, non-Hispanic; and American Indian/Alaska Native, non-Hispanic categories consist of individuals who considered themselves to be one race and who did not identify as Hispanic. Non-Hispanics who identified themselves as multiracial are included in the “two or more races, non-Hispanic” category. The Hispanic category consists of Hispanics of all races and racial combinations.
SOURCE: U.S. Department of Commerce, Census Bureau, Current Population Survey (CPS), October 2009.
SOURCE: OECD, Education at a Glance 2012 (2012), Table A1.2a, available at http://dx.doi.org/10.1787/888932664176.
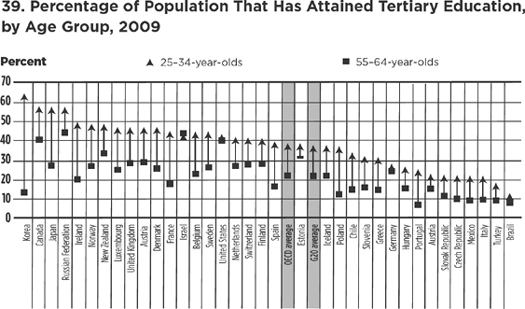
NOTE: Countries are ranked in descending order of the percentage of twenty-five- to thirty-four-year-olds who have attained tertiary education.
SOURCE: OECD, Table A1.3a. See Annex 3 for notes (www.oecd.org/edu/eag2011).
* Significantly different (p<.05) from 2008
NOTE: Score gaps are calculated based on differences between unrounded average scores. Black includes African American. The white and black race categories exclude Hispanic origin.
* Significantly different (p<.05) from 2008
NOTE: Score gaps are calculated based on differences between unrounded average scores. Black includes African American. The white and black race categories exclude Hispanic origin.