Fedora System Tools
Package Name | Application | Description |
|---|---|---|
system-config-selinux | SELinux Management | Manages and configures SELinux policy |
gnome-system-monitor | System Monitor | GNOME System Monitor |
gnome-system-log | System Log | GNOME system log viewer |
gnome-terminal | Terminal | GNOME terminal window |
baobab | Disk Usage Analyzer | Baobab Disk Usage Analyzer |
gnome-disk-utility | Palimpsest Disk Utility | Palimpsest DeviceKit disk manager |
sealert | SELinux Troubleshooter | setroubleshoot, SELinux alert browser |
gnome-power-statistics | Power Statistics | Power usage |
Performance Analysis Tools and Processes
Performance Tools
Performance Tool | Description |
|---|---|
vmstat | Performance of system components |
top | Listing of most CPU-intensive processes |
free | Listing of free RAM memory |
sar | System activity information |
iostat | Disk usage |
GNOME System Monitor | System monitor for processes and usage monitoring (System ➤ Administration ➤ System Monitor) |
KDE System Monitor | KDE system monitor for processes and usage monitoring |
Frysk | Monitoring tool for system processes |
GNOME System Monitor
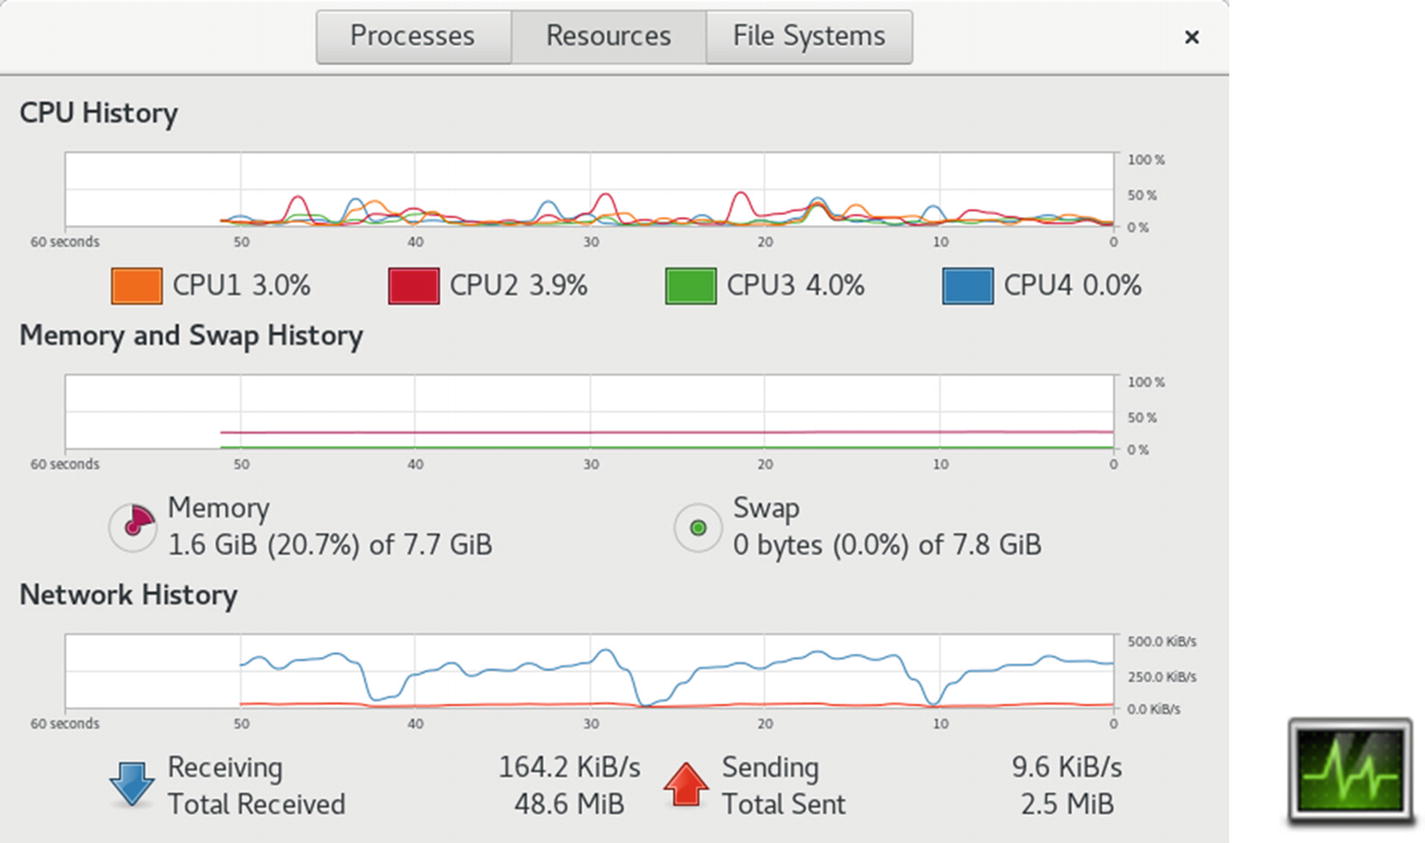
GNOME System Monitor
Note
System information, such as the Fedora release, hardware information, and system status, is available on the System Settings ➤ Details ➤ About tab.
The File Systems tab lists your file systems , including where they are mounted, their type, and the amount of disk space used and how much is free. You can sort the list by any category. Device, directory, and type names are listed alphabetically. Total, free, available, and used space can be sorted numerically in ascending or descending order. Double-clicking on a file system entry will open that file system in a file manager window.
The Processes tab lists your processes, letting you sort and search processes. You can use field buttons to sort by name (Process Name), process ID (ID), percentage of use (%CPU), and memory used (Memory), among others. The menu (right side of the menu bar) lets you select all processes, just your own (My Processes), or active processes. You can stop any process by selecting it and then clicking the End Process button (lower-right corner) or by right-clicking on it and choosing End. You can right-click a process entry to display a menu with actions you can take on the selected process, such as stopping (Stop), ending (End), killing (Kill), and continuing a process (Continue), as well as changing the priority of the process (Change Priority). The Open Files entry opens a dialog listing all the files, sockets, and pipes the process is using. The Properties entry displays a dialog showing all the details of a process, such as the name, user, status, memory use, CPU use, and priority. Memory Maps display, selected from the Memory Maps entry, shows information on virtual memory, inodes, and flags for a selected process .
Display features such as the colors used for CPU graphs can be set using the dconf editor's gnome-system-monitor keys at org ➤ gnome ➤ gnome-system-monitor.
Managing Processes
Should you have to force a process or application to quit, you can use the GNOME System Monitor Processes tab to find, select, and stop it. You should be sure of the process you want to stop. Ending a critical process could cripple your system.
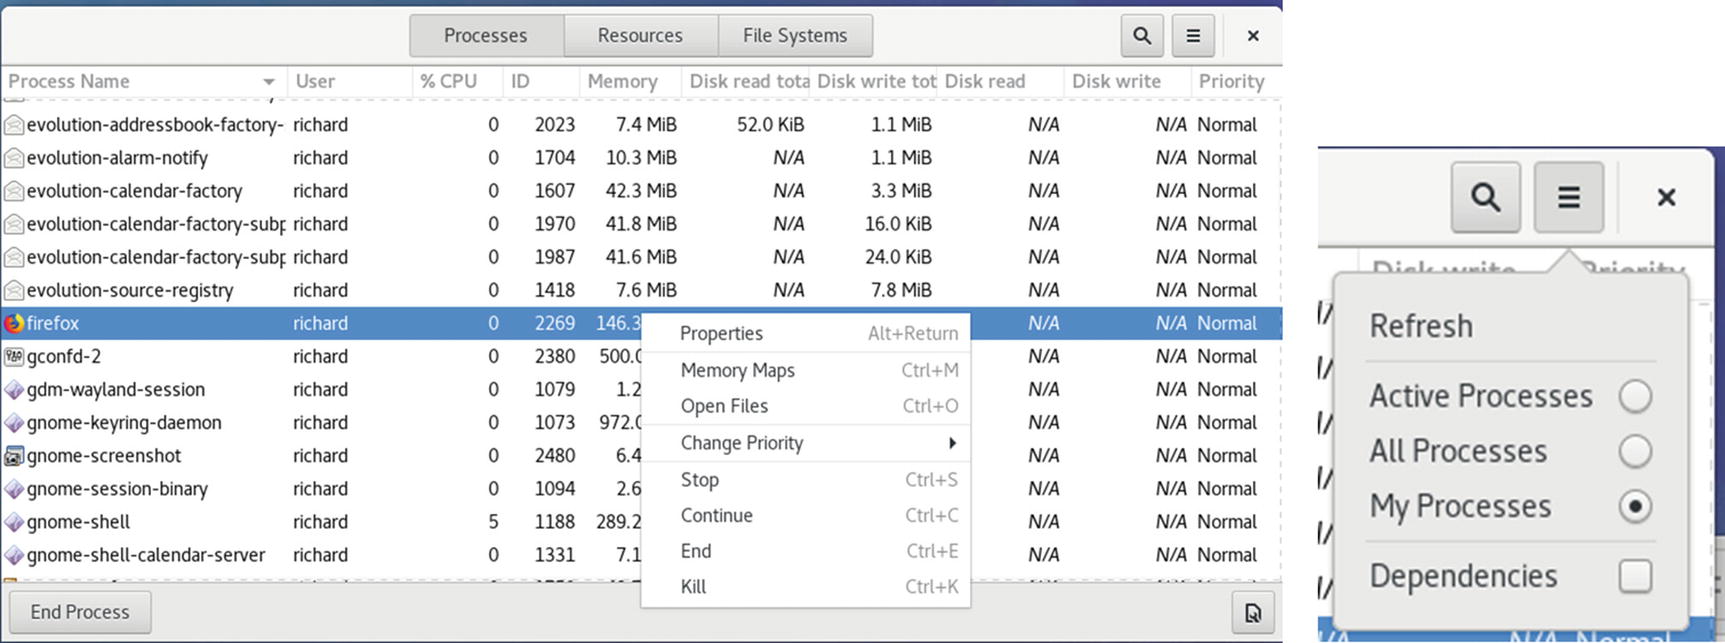
GNOME System Monitor, Processes tab
KDE System Monitor
The KDE System Monitor is accessible on the KDE desktop from System ➤ System Monitor and on the GNOME desktop from the Applications ➤ System Tools ➤ System Monitor. This tool allows you to monitor the performance of your own system as well as remote systems. KDE System Monitor can provide simple values or detailed tables for various parameters. A System Load tab provides graphical information about CPU and memory usage, and a Process Table tab lists current processes using a tree format to show dependencies. You can design your own monitoring tabs with worksheets, showing different types of values you want to display and the form you want to display them in, like a bar graph or digital meter . The Sensor Browser pane is an expandable tree of sensors for information like CPU System Load or Memory's Used Memory. There is a top entry for each host you are connected to, including your own, localhost. To design your own monitor, create a worksheet and drag and drop a sensor onto it.
Glances
Glances is a comprehensive system monitoring tool run from the command line in a terminal window with the glances command. It shows detailed resource use for the system, network, disk, file system, sensors, and processes (see Figure 12-3). It also warns you of any critical alerts. The system section covers detailed memory, CPU, swap and load usage. The network section shows the activity on each network device. The Disk I/O section lists your storage devices and their read/write usage. The File Sys section shows all your partitions and how much memory is used. The Sensors section shows the temperature detected by your sensors such as those for CPU, GPU, and the ambient temperature. The Tasks section lists your active processes by CPU usage, showing memory used, pid, user and the command. Press q to end your glances session.
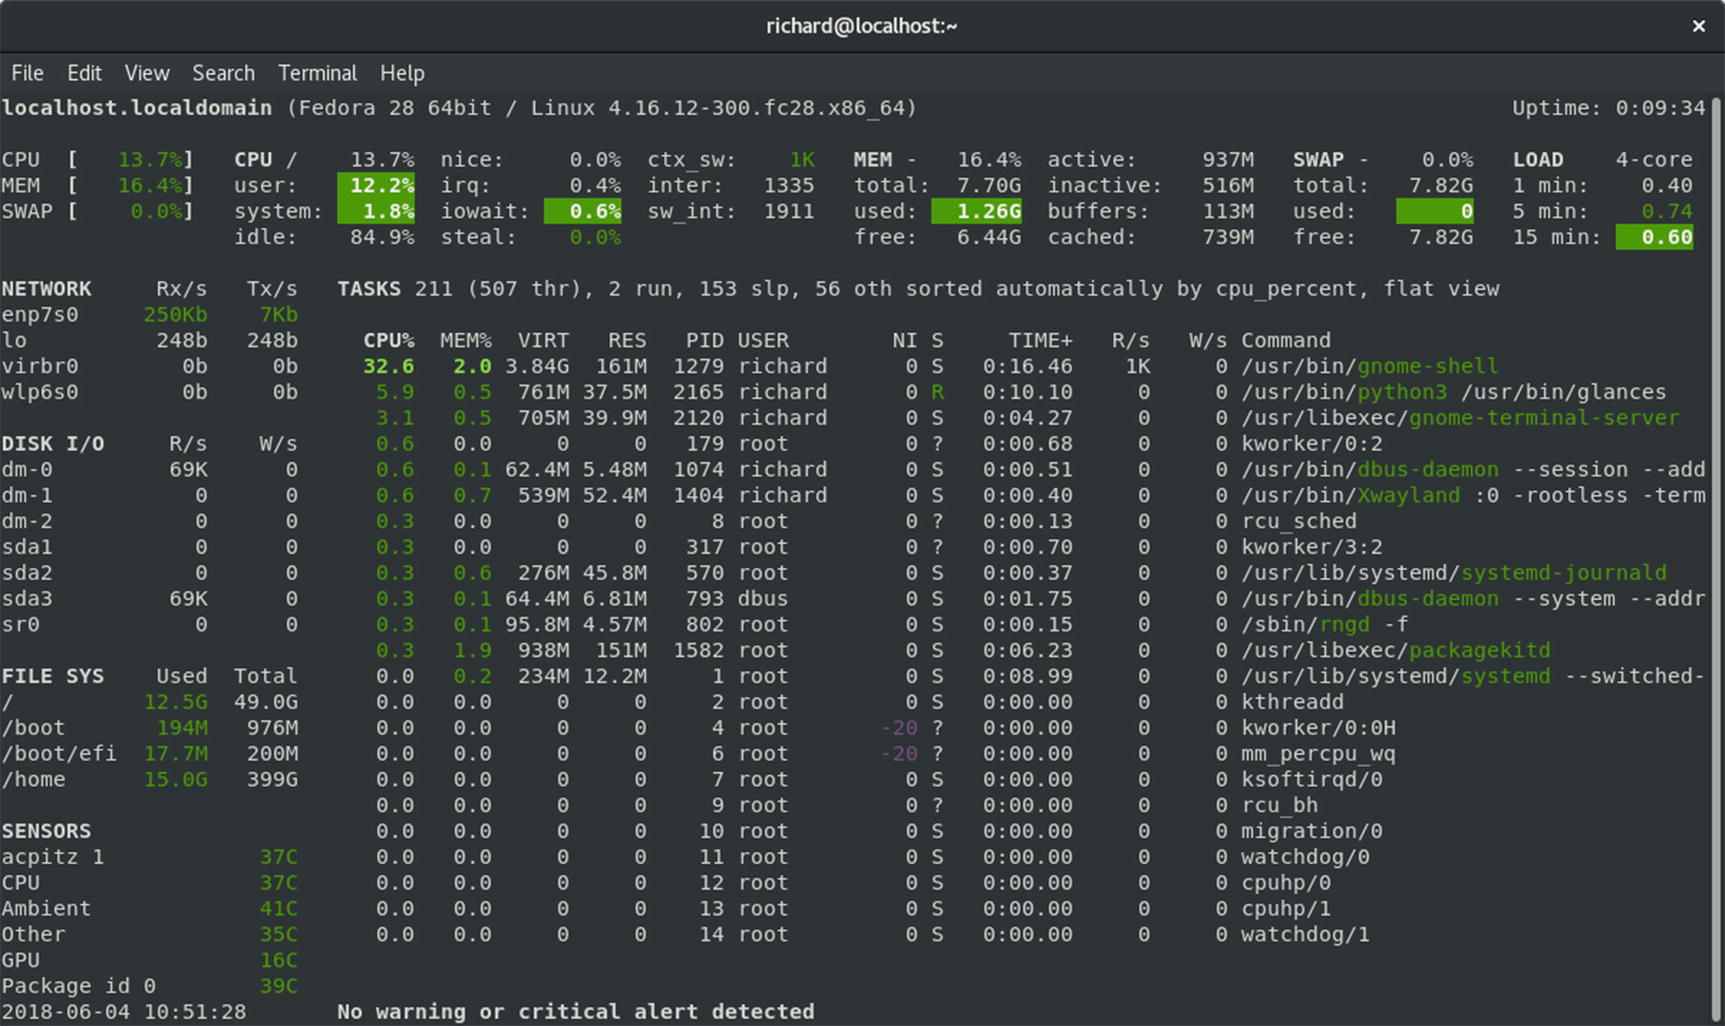
Glances System Monitor
vmstat, free, top, iostat, dstat, and Xload
From a terminal window, you can use tools such as vmstat, free, top, and iostat to monitor your system (systat package). The vmstat command outputs a detailed listing indicating the performance of different system components, including CPU, memory, I/O, and swap operations. A report is issued as a line with fields for the different components. If you provide a time period as an argument, it repeats at the specified interval, usually a few seconds. The top command provides a listing of the processes on your system that are the most CPU intensive, showing what processes are using most of your resources. The listing is in real time and updated every few seconds. Commands are provided for changing a process’s status, such as its priority.
The free command lists the amount of free RAM memory on your system, showing how much is used and how much is free, as well as what is used for buffers and swap memory. Xload is an X Window System tool showing the load, CPU, and memory, iostat displays your disk usage, and sar shows system activity information.
Frysk
Frysk is a specialized complex monitoring tool for system processes. With Frysk you can set up very specific monitoring tasks, focusing on particular applications and selecting from a set of observer processes to provide information about exit notification, system calls, and execution. You can also create your own customized observers for processes. Find out more about Frysk at http://sourceware.org/frysk .
Terminal Window Administrative Access: sudo and sudo su
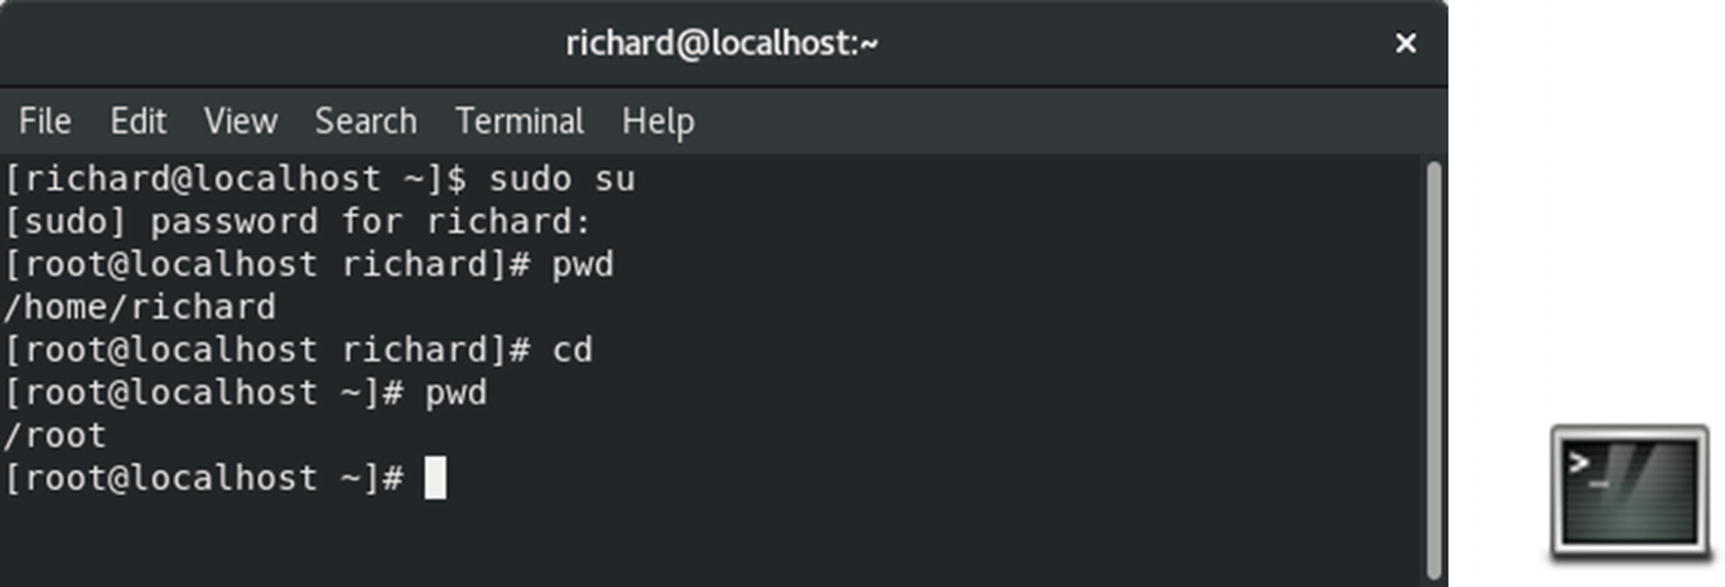
The terminal window allows you to enter Linux commands on a command line (Utilities ➤ Terminal ). It also provides you with a shell interface for using shell commands instead of your desktop. The command line is editable, allowing you to use the Backspace key to erase characters on the line. Pressing a key will insert that character.
The terminal window is often used to run administrative tasks. First, log in as the root user, using the sudo command. You are prompted to enter your password. You can then run administrative-level commands, such as dnf to install packages or nano to configure system files.
Schedule Tasks
Scheduling regular maintenance tasks, such as backups, can be managed either by using the systemd timers or by the cron service. The systemd timers are systemd files that run service files. Check the man page for systemd.timers for a detailed description of timers. They have the extension .timer. A timer file will automatically run a corresponding service file that has the same name. For example, the dnf-automatic.timer will run the dnf-automatic.service file. The timer file only contains scheduling information. Its filename determines which service file to run. It is possible to designate a different service file with the Unit directive in the timer file. If you want to run a command-line operation for which there is no service file, you can create your own with an ExecStart entry for that command.
You can create timer files and place them in the /etc/systemd/system directory. If you also have to set up a service file for it, you can place it in the same directory. To activate a timer be sure to enable it with systemctl. If you created a service file, be sure to enable that also.
You can still use the older cron service to schedule tasks. The cron service is implemented by the cron daemon that constantly checks for certain actions to take. These tasks are listed in the crontab file. The cron daemon constantly checks the user’s crontab file to see if it is time to take these actions. Any user can set up a crontab file. The root user can set up a crontab file to take system administrative actions, such as backing up files at a certain time each week or month.
Creating cron entries can be a complicated task, using the crontab command to make changes to crontab files in the /etc/crontab directory. Instead, you can use several desktop cron-scheduler tools to easily set up cron actions. Two of the more useful tools are KCron and GNOME Schedule, the latter which creates an easy-to-use interface for creating scheduled commands.
On KDE you can use the KDE Task Scheduler (KCron) to set up user- and system-level scheduled tasks (install the kdeadmin package). You access the Task Scheduler on the System Settings window, System Settings ➤ Task Scheduler (System Administration section). The Task Scheduler window will list your scheduled tasks. Click the New Task button to open a New Task window in which you can enter the command to run, add comments, and then specify the time in months, days, hours, and minutes from simple arranged buttons. On the Task Scheduler window, you can select a task and use the side buttons to modify it, delete the task, run it now, or print a copy of it. For tasks using the same complex commands or arguments, you can create a variable and then use that variable in a command. Variables are listed in the Environment Variables section. To use a variable in a scheduled task, precede its name with the $ character when you enter the command. Entering just the $ symbol in the Command text box will display a drop-down list of predefined system variables you can use, such as $PATH and $USER.
System Logs, journals, and journald
If you want, you can still install and run the older rsyslogd, which stores message in the /var/log/messages file.
GNOME Logs and System Log
GNOME logs
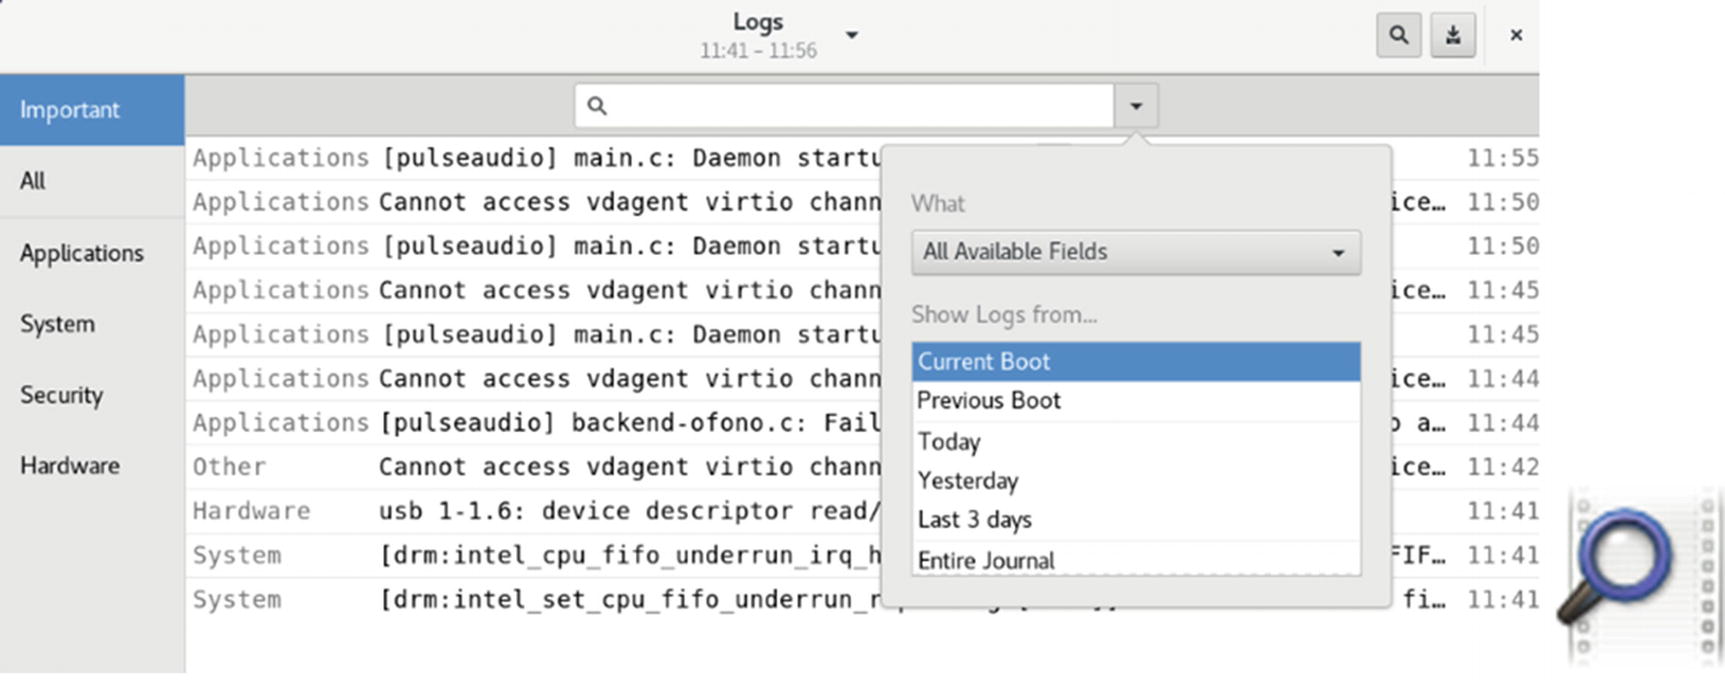
You can also use the GNOME Log File Viewer to view these logs (Utilities ➤ System Log). Install System Log on GNOME Software or the gnome-system-log package on Packages. A sidebar lists the different logs. Selecting one displays the log in the right pane (see Figure 12-6). A search button on the top right opens a search box, in which you can search for messages in the selected log. A menu button on the top right lets you perform tasks such as zooming, copying, selecting, and filtering. The System Log queries the journald daemon for log reports using journalctl.
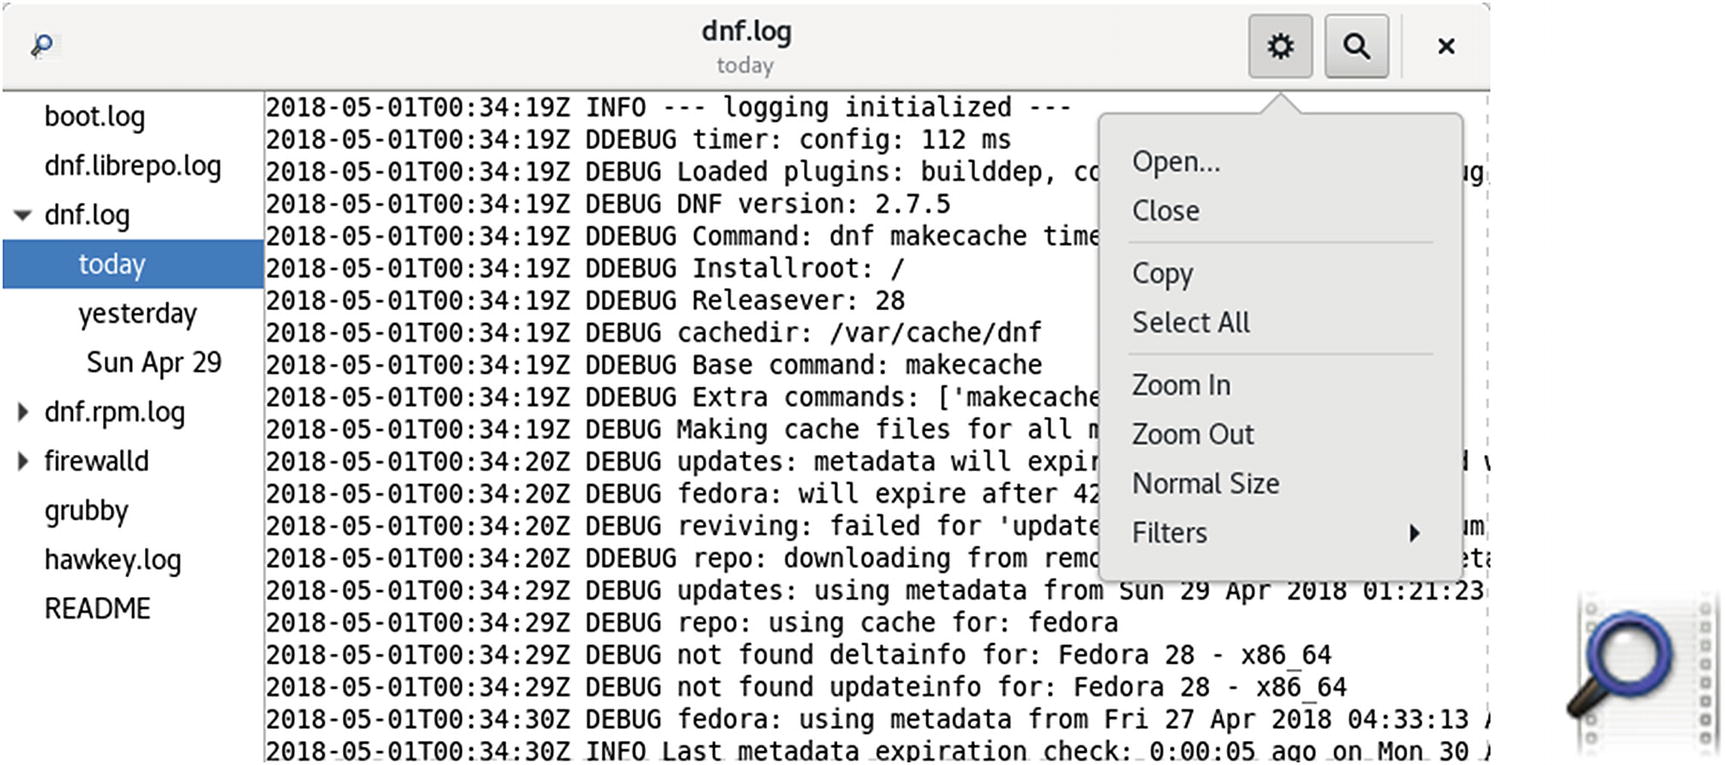
System Log
Disk Usage Analyzer
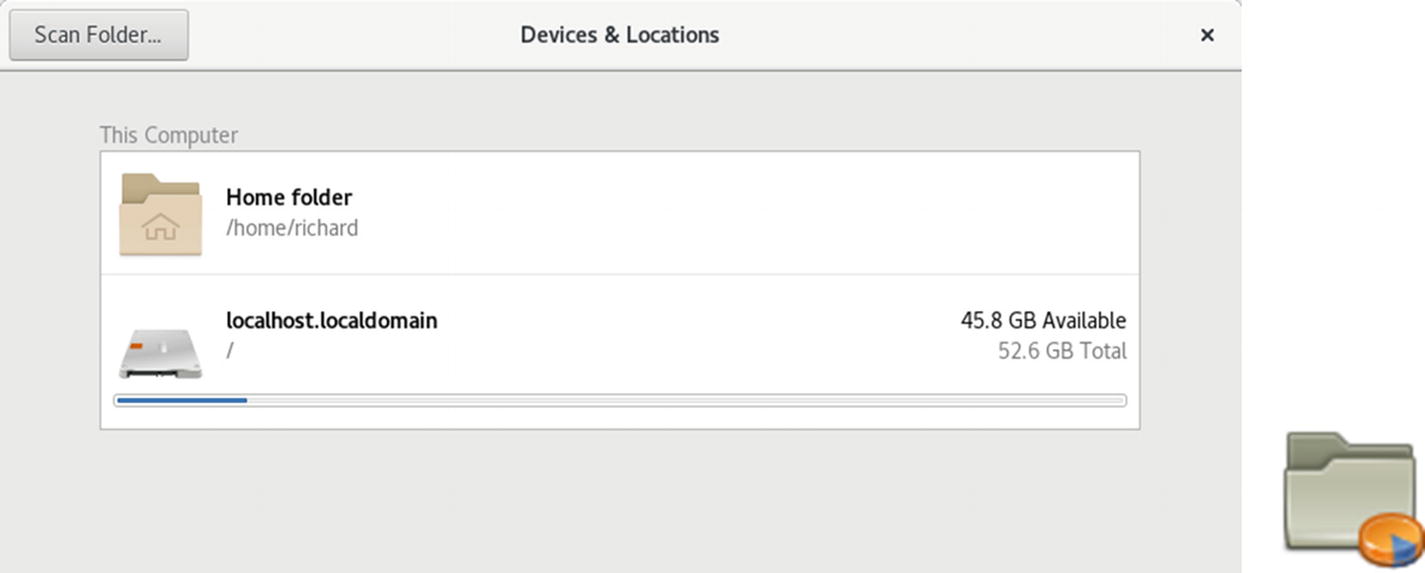
Disk Usage Analyzer: Scan dialog
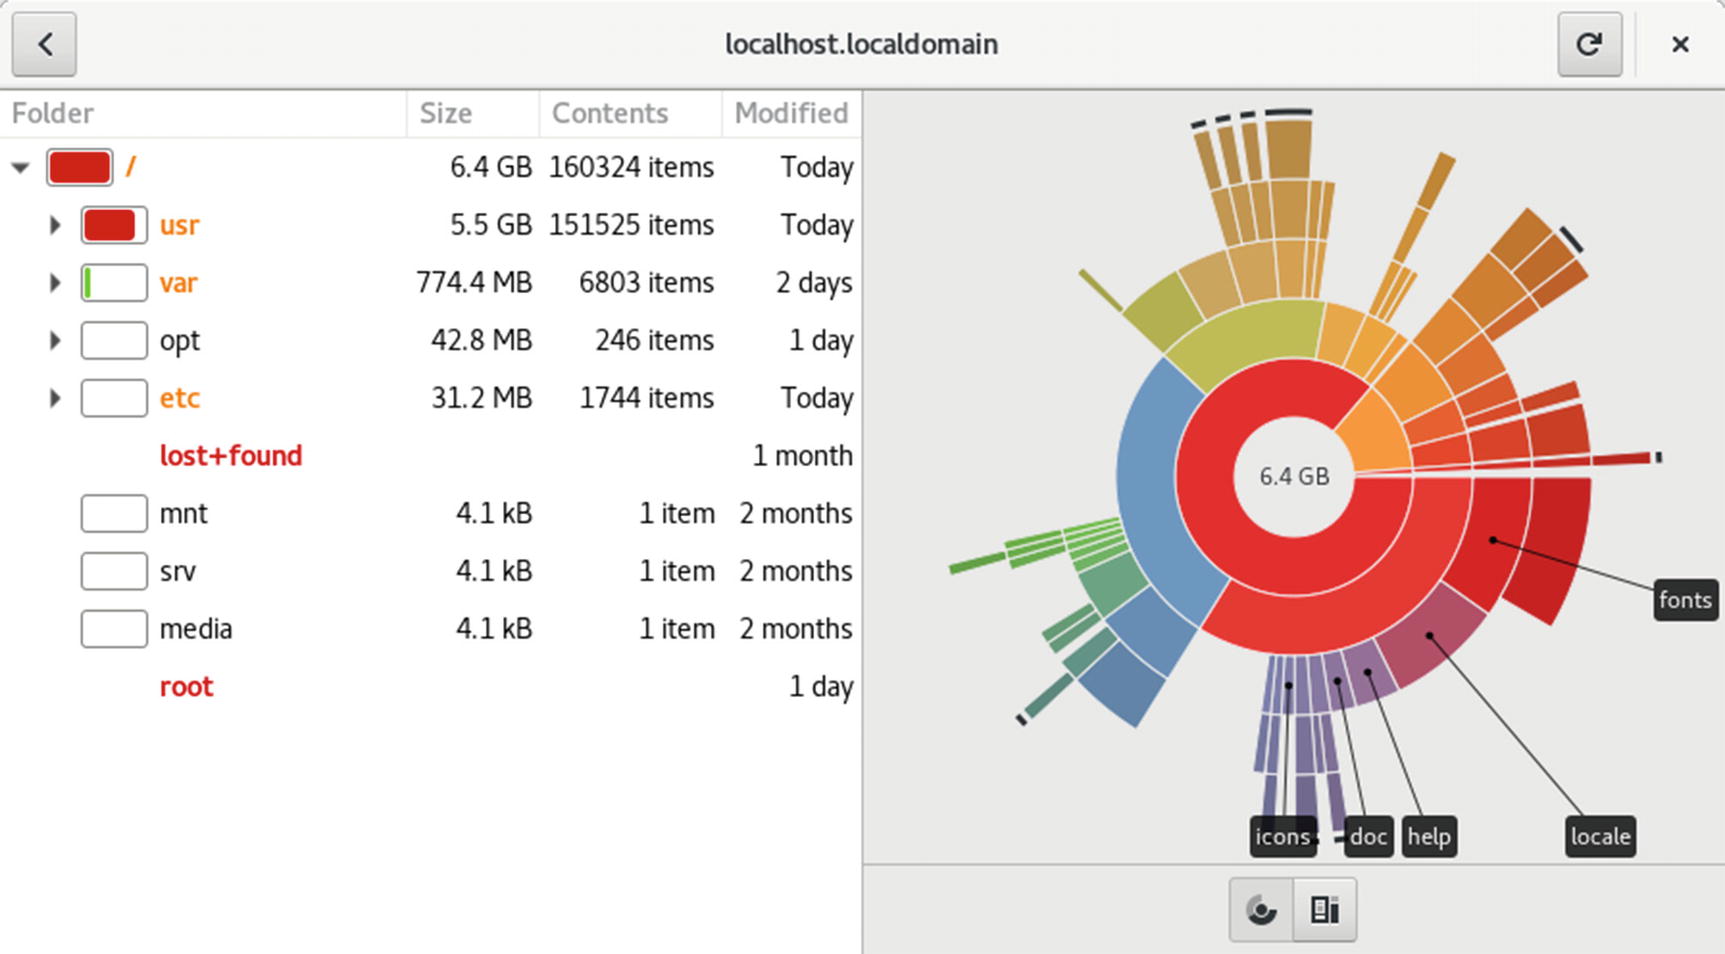
Disk Usage Analyzer
A representational graph for disk usage is displayed on the right pane. The graph can be either a Ring Chart or a Treemap. The Ring Chart is the default. Choose the one you want from the buttons on the lower right. For the Ring Chart, directories are shown, starting with the top-level directories at the center and moving out to the subfolders. Passing your mouse over a section in the graph displays its folder name and disk usage, as well as all its subfolders. The Treemap chart shows a box representation, with greater disk usage in larger boxes, and subfolders encased within folder boxes.
Virus Protection
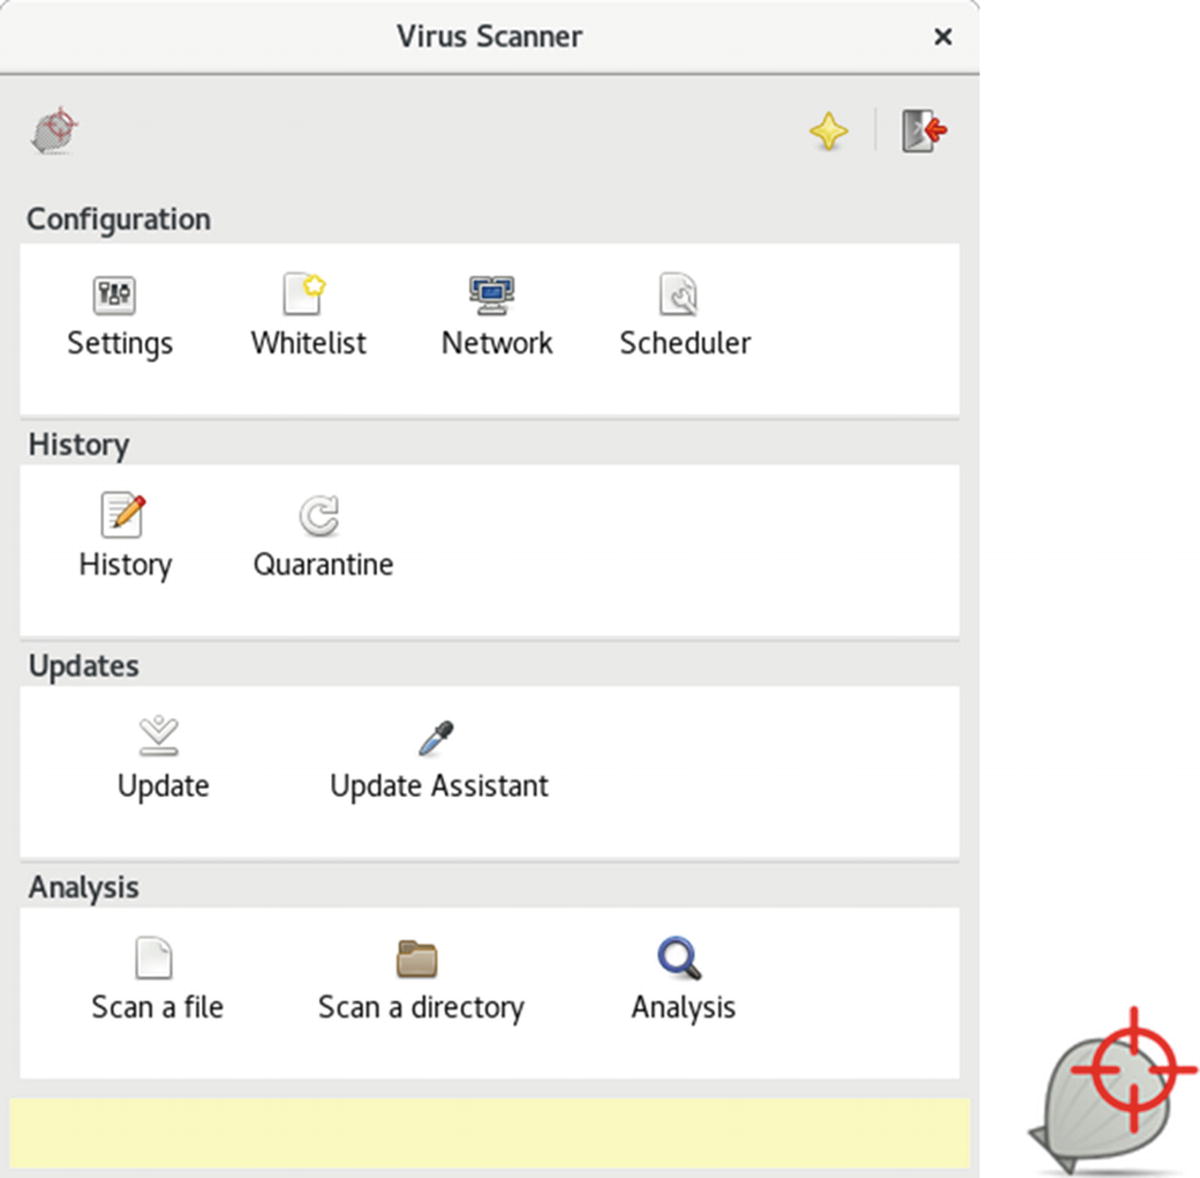
The clamtk tool for ClamAV virus protection
You can also install the clamav-milter and clamav-scanner packages, which work with your email application, to detect viruses .
Disk Utility and Udisks
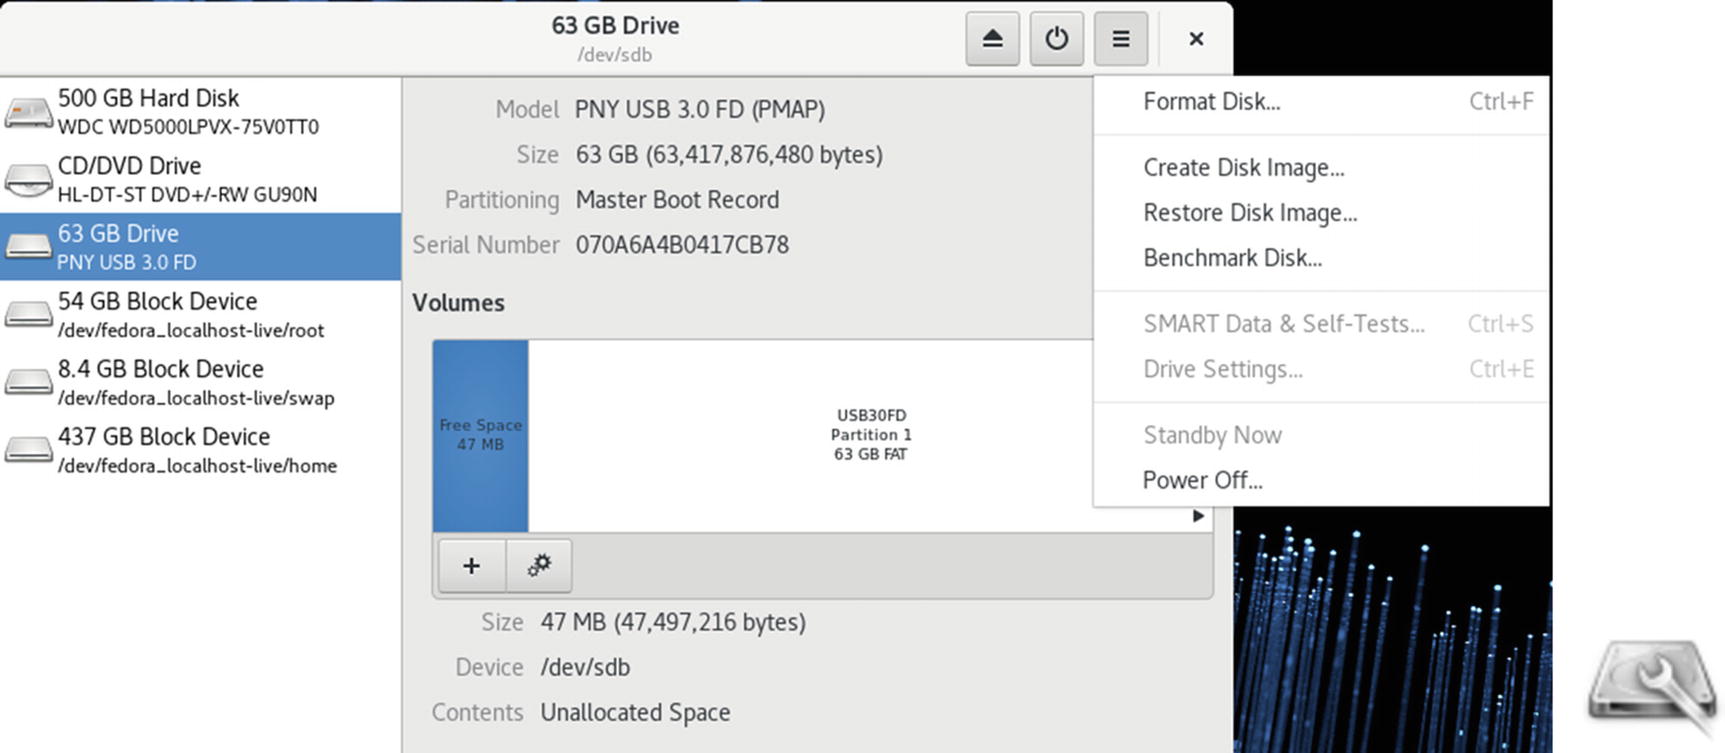
Disk Utility is a Udisks supported user configuration interface for your storage media, such as hard disks, USB drives, and DVD/CD drives (gnome-disk-utility package, installed by default). Tasks supported include disk labeling, mounting disks, disk checks, and encryption. You can also perform more advanced tasks, like managing RAID and LVM storage devices, as well as partitions. Disk Utility is accessible via Utilities ➤ Disk Utility. Users can use Disk Utility to format removable media like USB drives. Disk Utility is also integrated into GNOME Files, letting you format removable media directly.
Note
You can use GParted (GNOME Partition Editor) to create and remove your hard disk partitions, and to display information about them. GParted is available from the EPEL repository. Once it’s installed, you can access it as the GParted Partition Editor.
Disk Utility
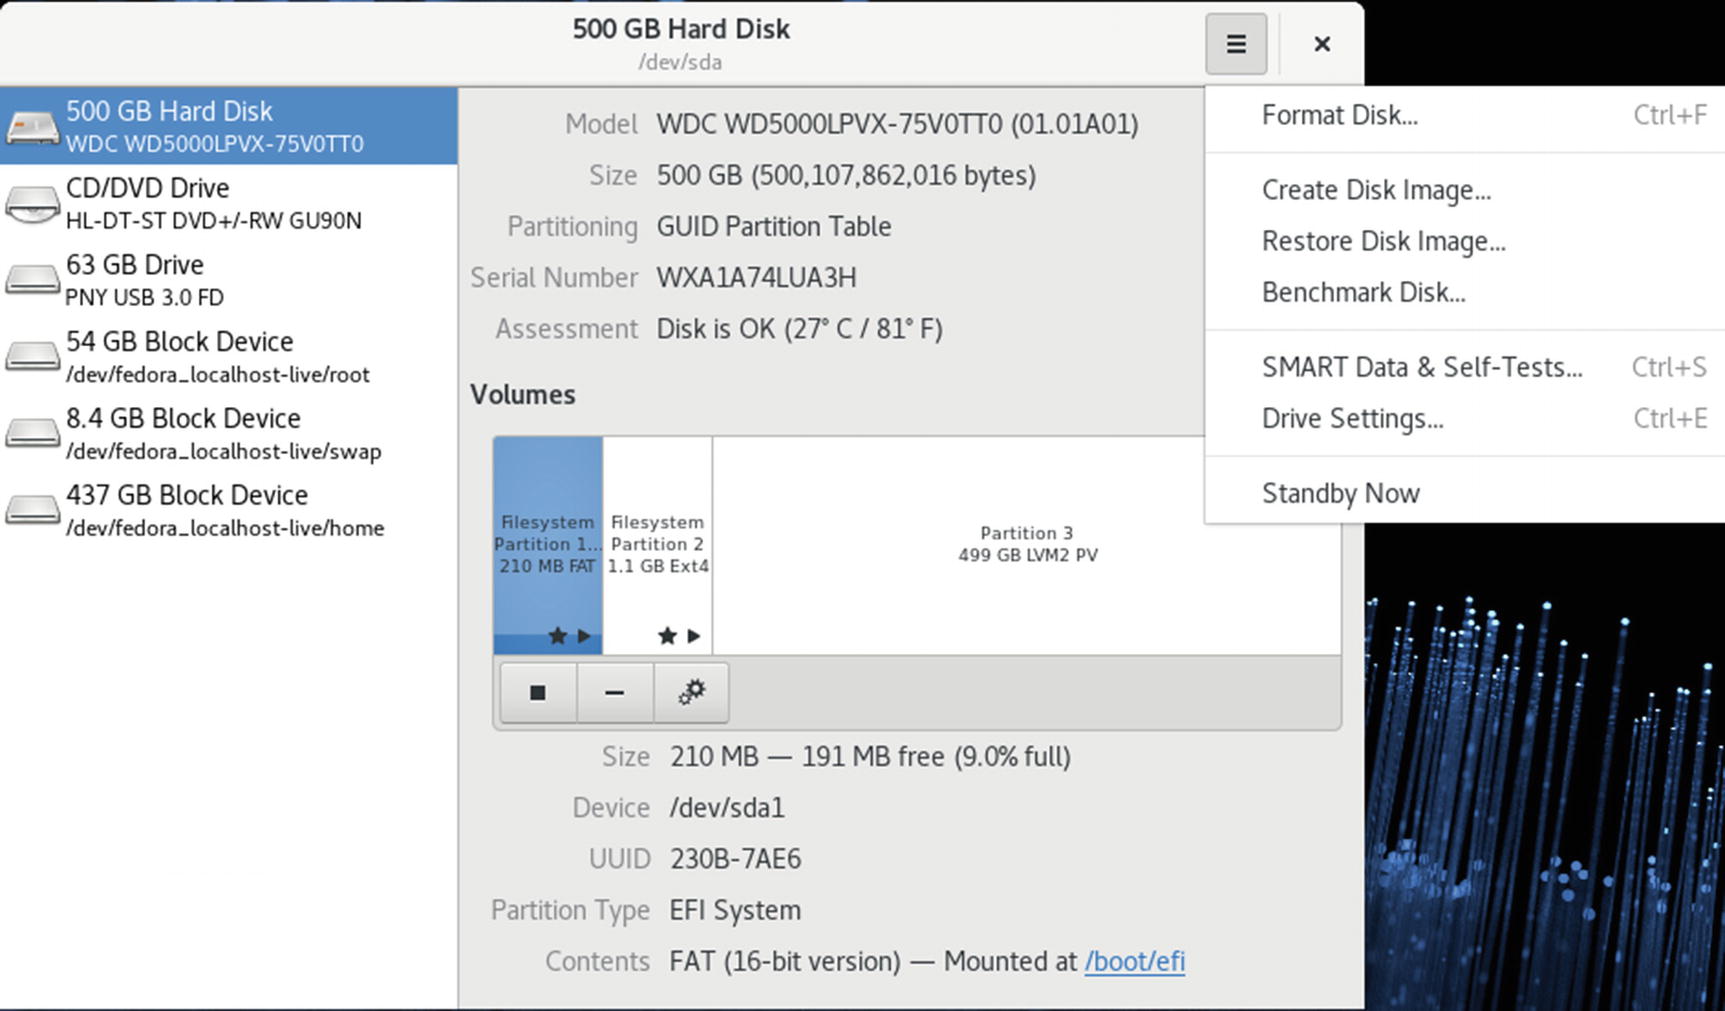
Disk Utility, hard drive
Disk Utility, Volumes
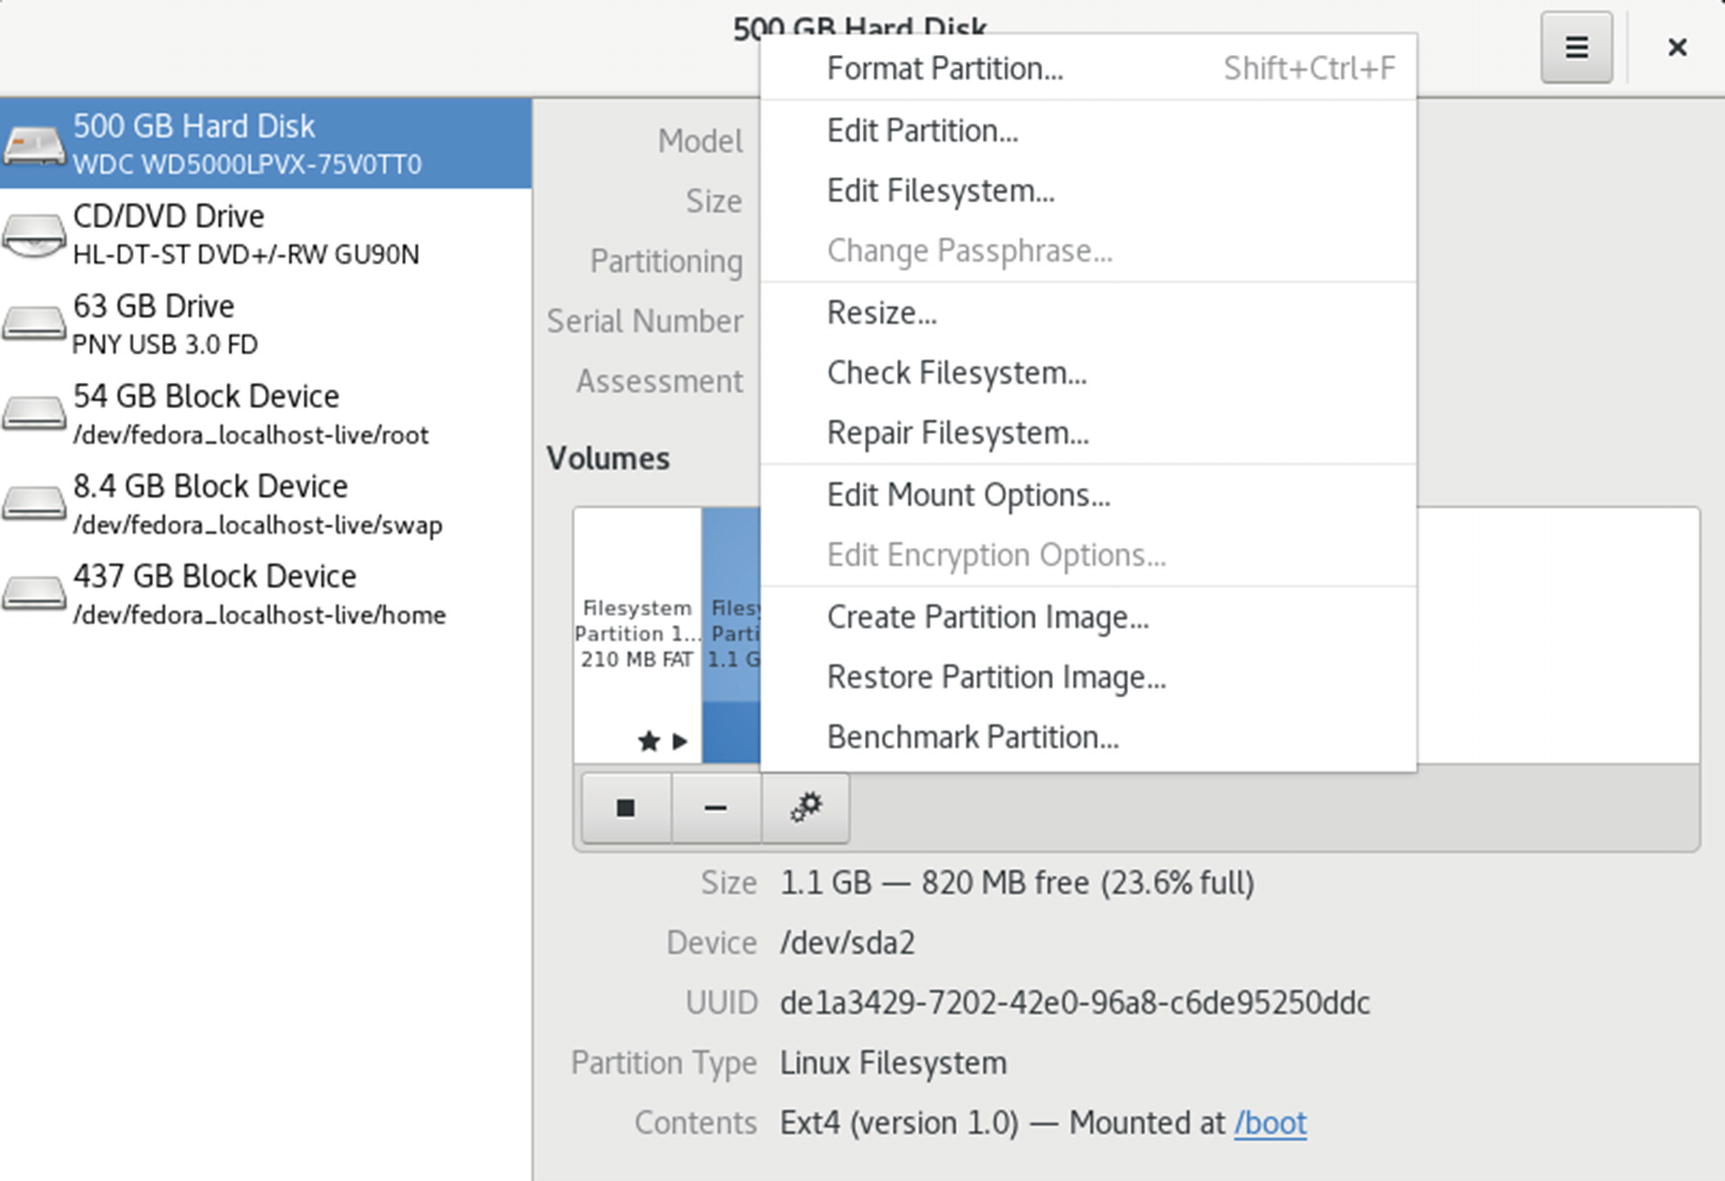
Clicking on a partition entry on the graphical icon bar displays information about that partition such as the file system type, device name, partition label, and partition size. The Contents entry tells if a partition is mounted. If in use, it displays a Mounted At: entry with a link consisting of the path name where the file system is mounted. You can click on this path name to open a folder with which you can access the file system. The button bar below the Volumes images provides additional tasks you can perform, such as unmounting a file system (square button) and deleting a partition (minus button). From the More Tasks menu, you can choose entries to change the partition label, type, and mount options. Certain partitions, like extended and swap partitions, display limited information and have few allowable tasks.
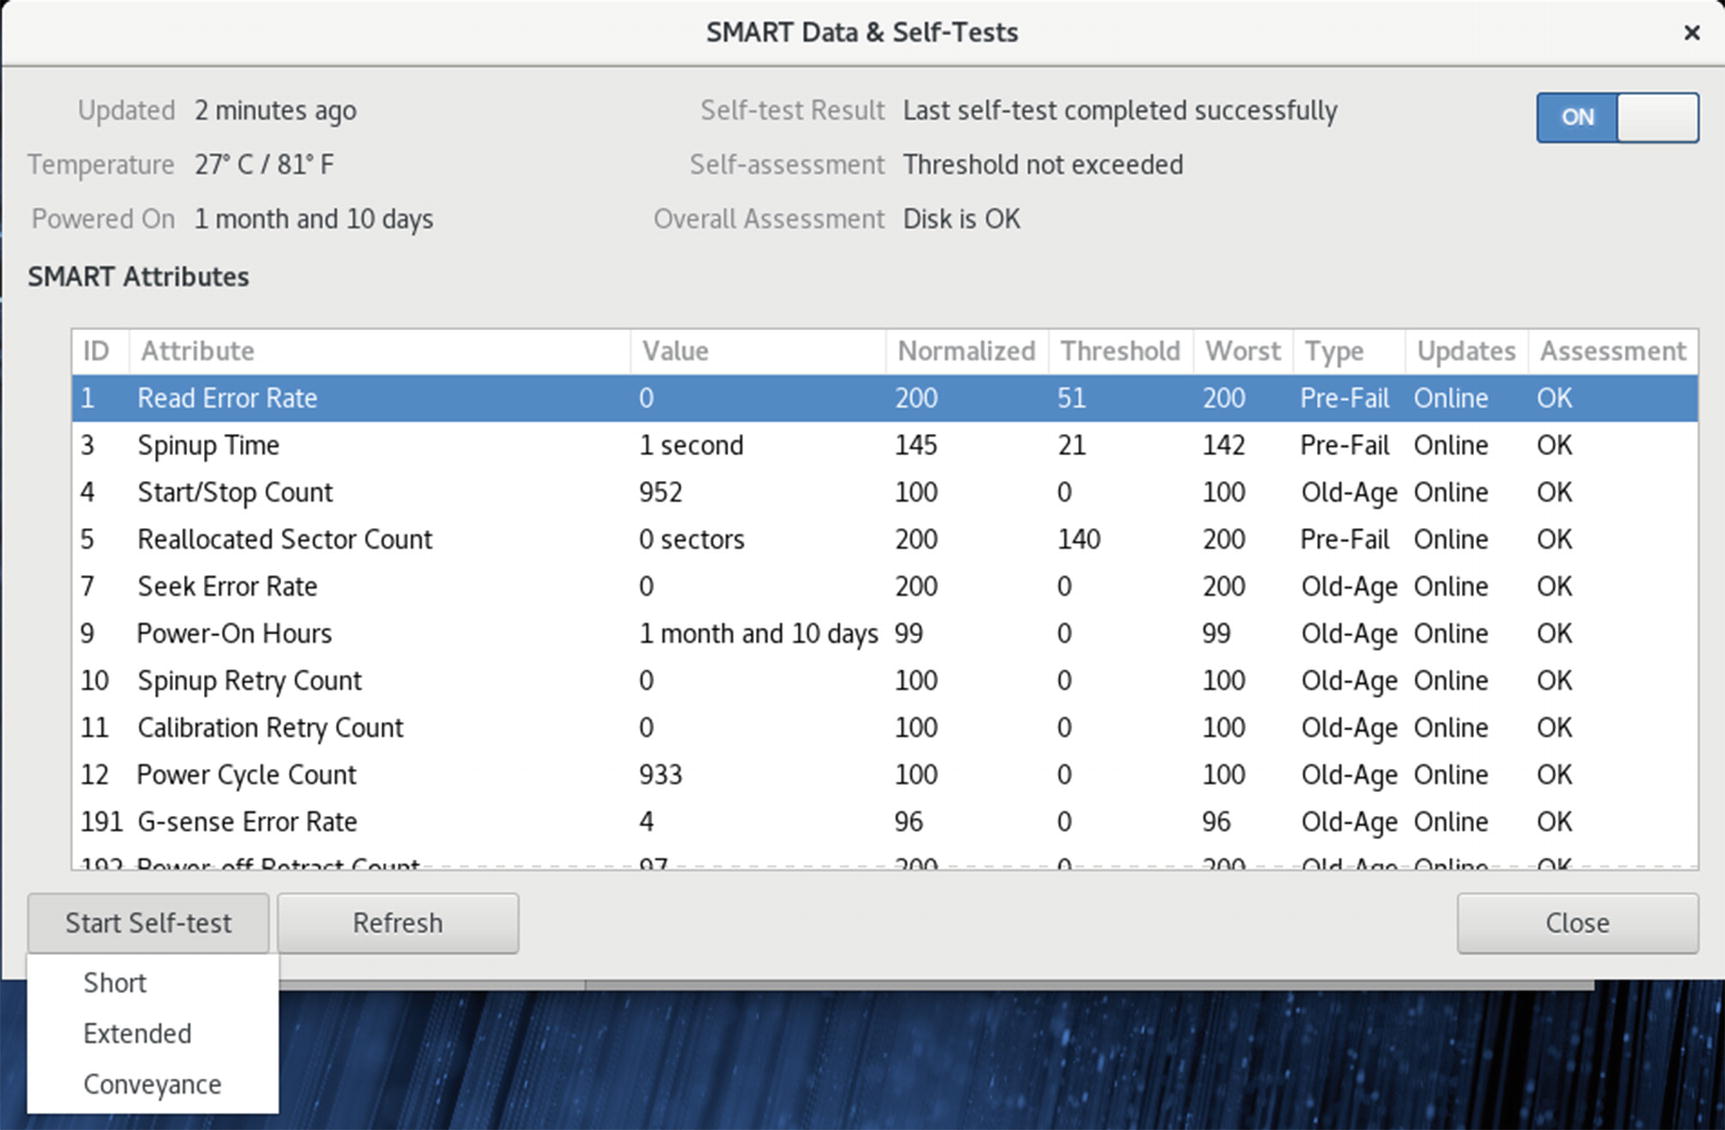
Disk Utility: Hard Disk hardware SMART data
Hardware Sensors
Sensor Packages and Applications
Sensor Application | Description |
|---|---|
lm_sensors | Detects and accesses computer (motherboard) sensors, such as CPU and fan speed. Runs sensors-detect once to configure. |
hddtemp | Detects hard drive temperatures. |
ksensors | KDE sensor applet, frontend for hddtemp. |
xsensors | X sensor package. |
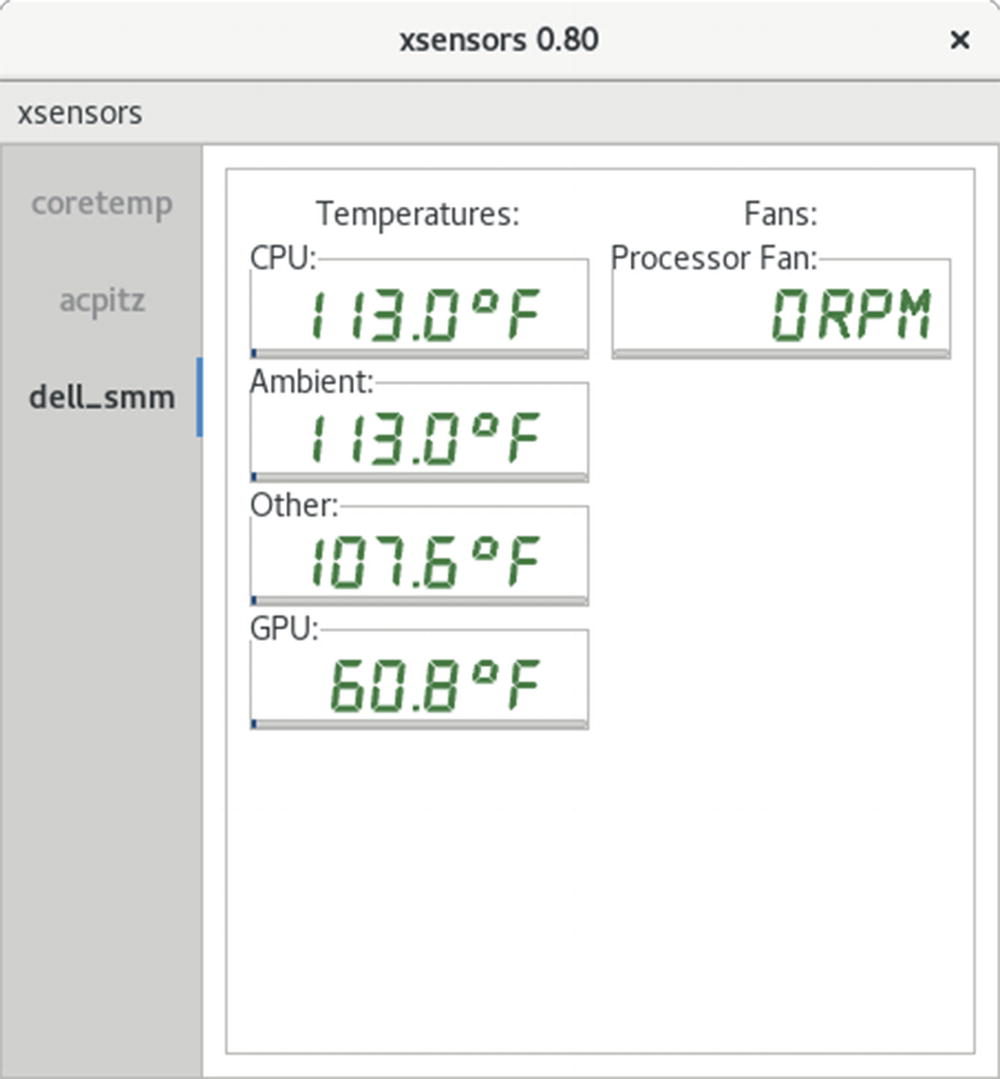
Xsensors
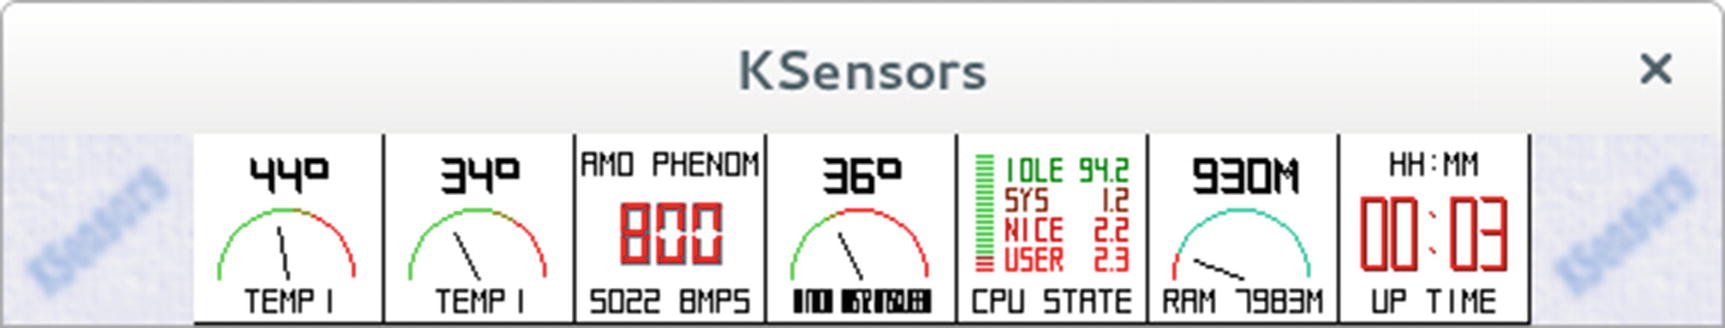
KSensors
SELinux : Configuration with policycoreutils-gui
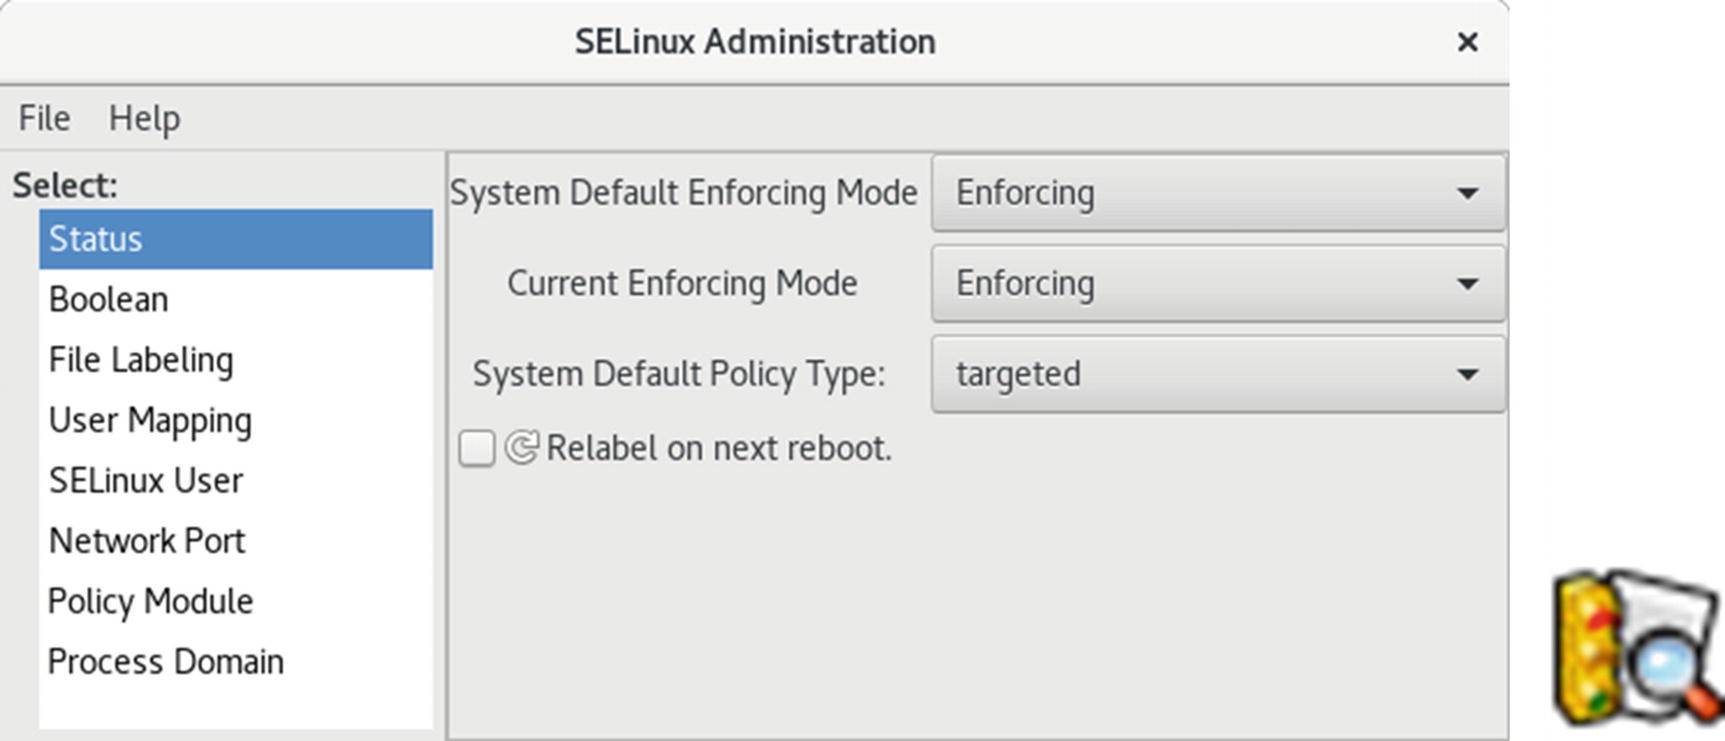
The system-config-selinux, SELinux Management
The Status pane sets the default and current enforcing modes. Here you can enable or disable SELinux, as well as specify the policy type. By default, the enforcing modes are set to Enforcing. You have the choice of Disable, Permissive, and Enforcing. If you are experiencing difficulties accessing your system, you can set the enforcing modes to Permissive or Disabled. Permissive will allow access, but issue warning messages. Disabled will completely shut down SELinux. The policy is normally targeted, focusing on network services like Samba and Apache. You can download and install more restrictive policies, but you may need a detailed understanding of SELinux to manage them.
This pane also features the relabeling option. Sometimes when you install new server software or update your system, you may need to relabel some of your files and directories. Relabeling will mark the files and directories to correct security access. Check Relabel on Next Reboot to perform the relabeling. It may take some time.
Note
Configuration for general SELinux server settings is carried out in the /etc/selinux/config directory. Currently there are only two settings available: the state and the policy. You set the SELINUX variable to the enforcement mode, such as enforcing or permissive, and the SELINUXTYPE variable to the kind of policy you want.
User Mapping shows the mapping of user login names to SELinux users. Initially, there will be two mappings: the root user and the default user.
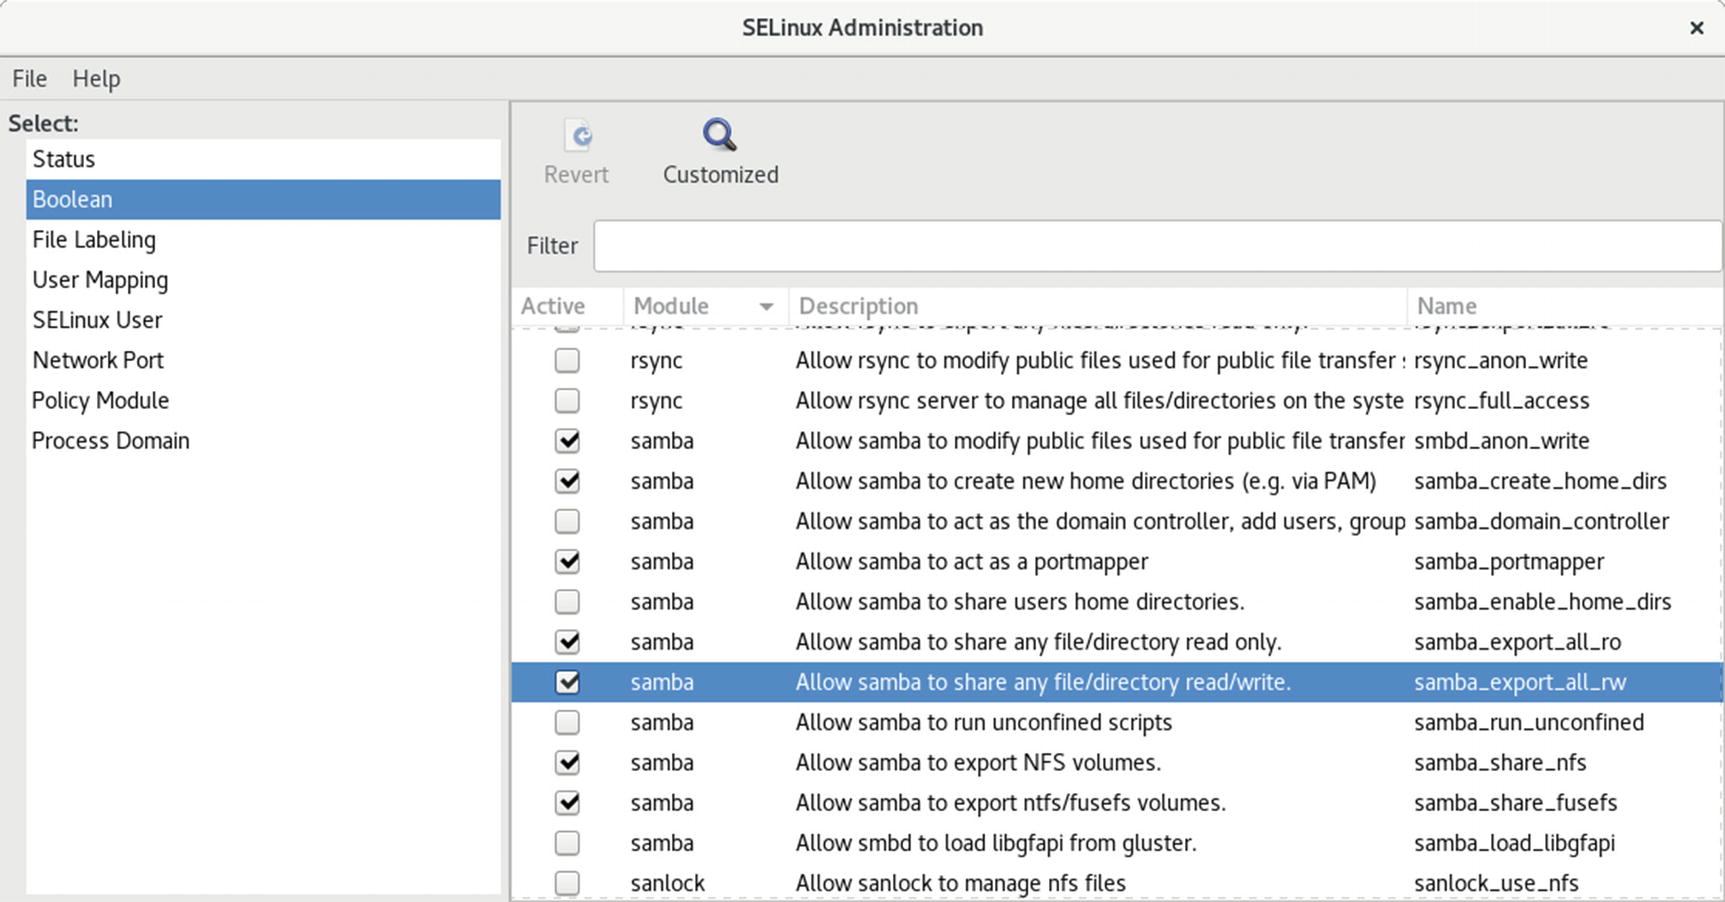
policycoreutils-gui SELinux Boolean pane
To allow access to many network services, you must not only allow access through your firewall but also through SELinux . The Boolean pane has entries for the different network services. Samba, in particular, has to have its Boolean entries set before you can access Samba shares.
The File Labeling pane will list your system directories and files, showing their security contexts and types. You can edit a file’s properties by selecting the entry and then clicking Properties. This displays a dialog with File Name, Type, SELinux Type, and Multi-Level Security (MLS) levels. MLS gives a security level value to resources. Only users with access to certain levels can access the corresponding files and applications. You can change the SELinux type or the MLS level. For a permissive policy, the MLS level will be s0, allowing access to anyone. You can also add or delete entries.
The SELinux Users pane shows the different kinds of SELinux users. Initially, there will be several user types, including root, system_u, and user_u. The root user has full and total administrative access to the entire system. The system_u user allows users to take on administrative access where needed. The user_u user is for normal users. Each entry lists its SELinux user, SELinux prefix, MLS level, MLS range, and SELinux roles. MLS level is the access level (s0 on a permissive policy), and MLS range is the range of access from SystemLow to SystemHigh. A given user has certain roles available. The root user has the system_r, sysadm_r, and staff_r roles, allowing that person system access, administration capability, and staff user access. The user_u users also have a system_r role, allowing those users to perform system administration, if they have the root user password.
The Network Port pane lists the network protocol, the SELinux type, and the MLS security level for ports on your system. Select an entry and click Properties to change the SELinux type or the MLS level for the port. The Group View button will display the SELinux type, along with a list of the ports they apply to. This view does not display the MLS level, as these apply to ports individually.
The Policy Module pane lists the different SELinux policy modules. Here, you will see modules for different applications, such as Thunderbird and Evolution, as well as device service such as USB. Listed also are desktops such as GNOME. The pane allows you to add or remove modules. You can also enable or additional audit rules for a module for logging.
SELinux Troubleshooting and audit2allow
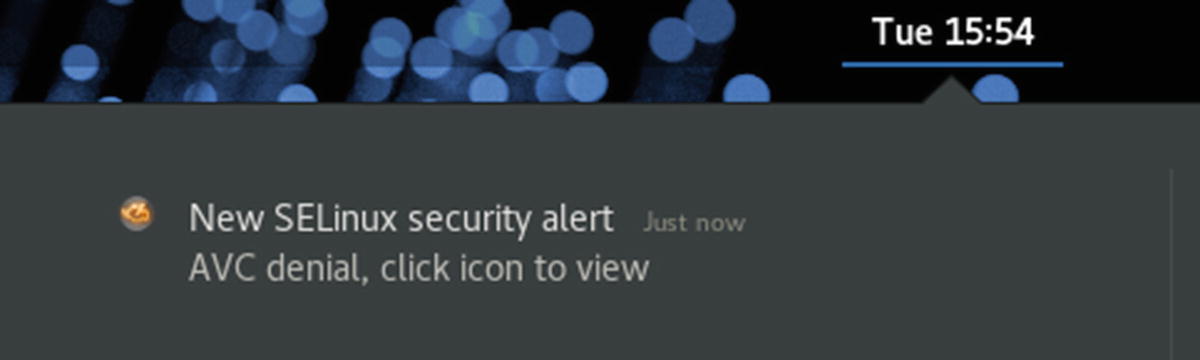
Fedora includes the SELinux troubleshooter , which notifies users of problems that SELinux detects. Whenever SELinux denies access to a file or application, the kernel issues an AVC (Access Vector Cache) notice. These are analyzed by the SELinux troubleshooter to detect problems that users may have to deal with. When a problem is detected, a SELinux troubleshooter notification is displayed in the desktop message tray, along with the troubleshooter icon, as shown here:
Clicking the icon or notice will open the SELinux troubleshooter window. You can also access it at any time as SELinux Troubleshooter. You can find out more information about SELinux troubleshooter at https://fedorahosted.org/setroubleshoot/ .
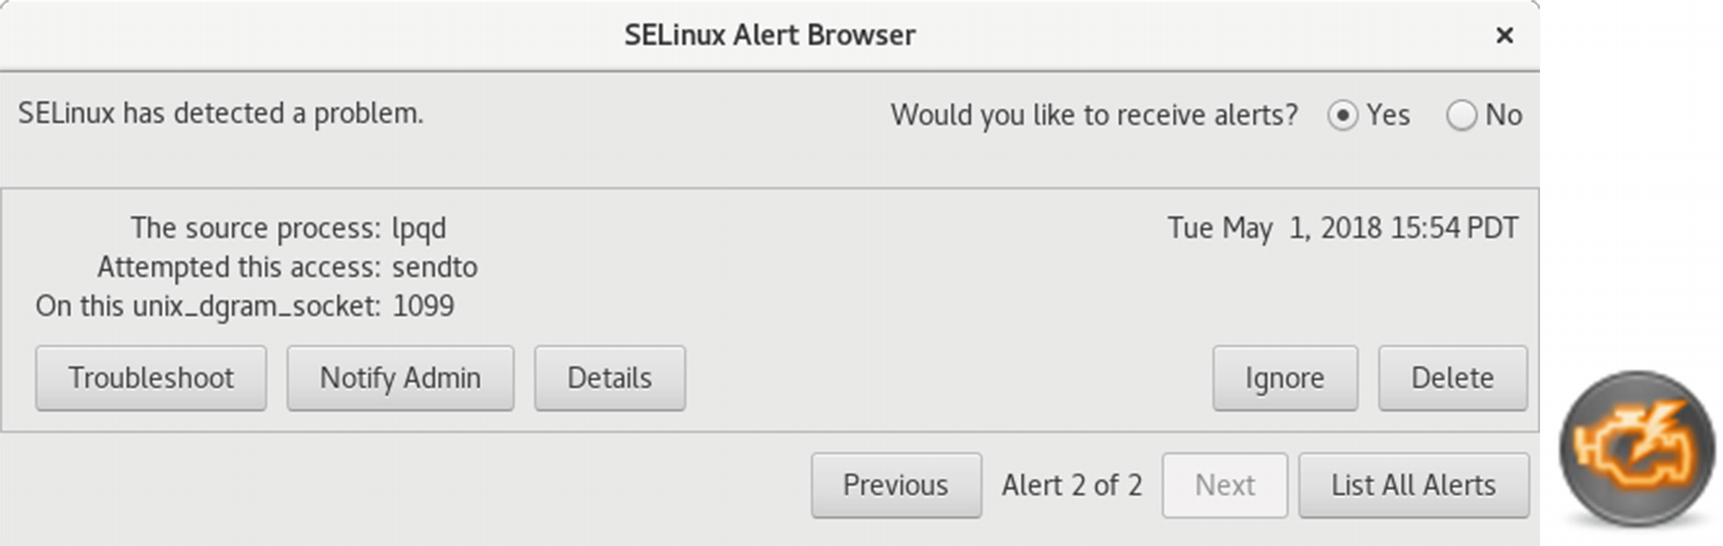
SELinux troubleshooter window
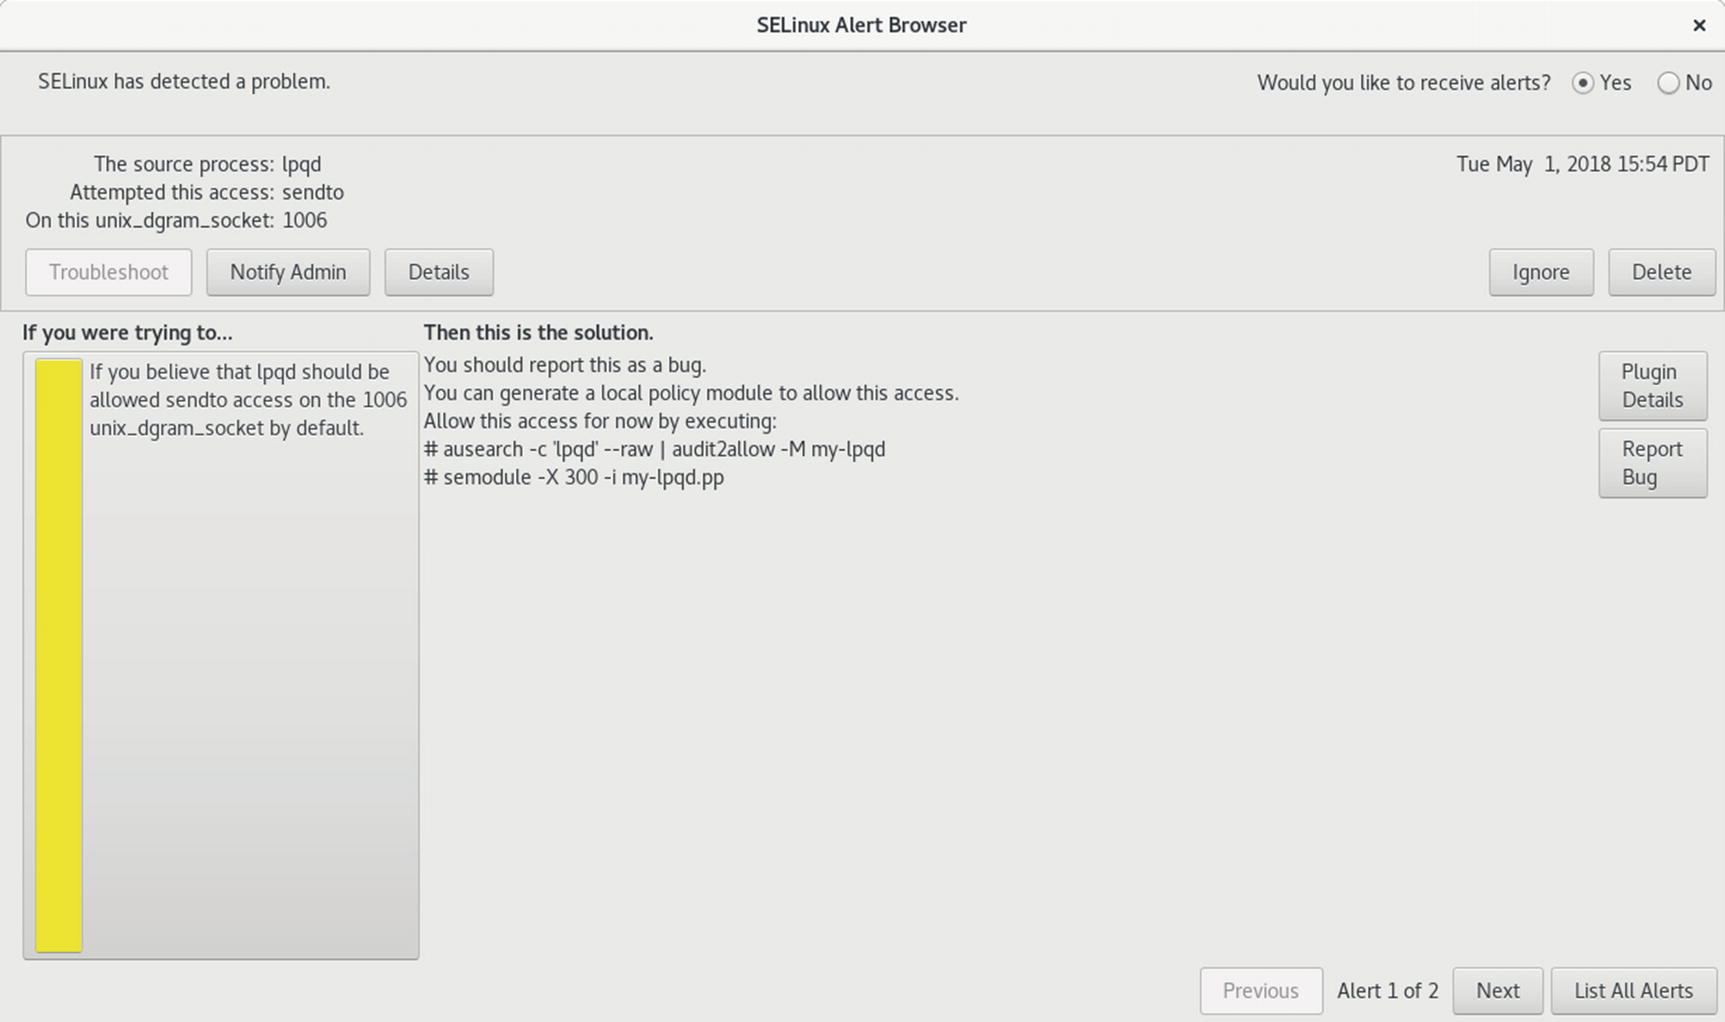
SELinux troubleshooter, troubleshoot listing
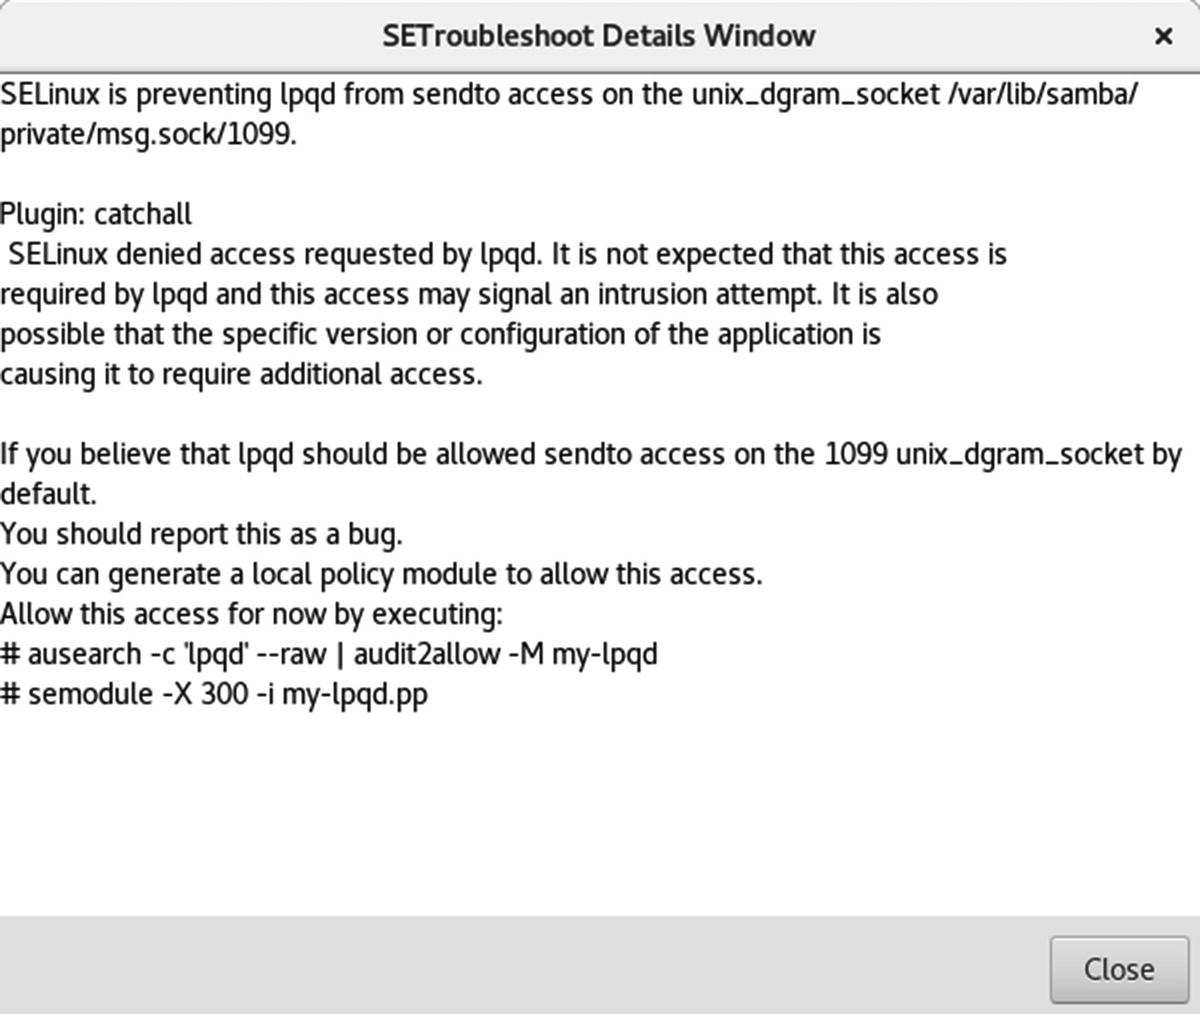
SELinux troubleshooter, plugin details window
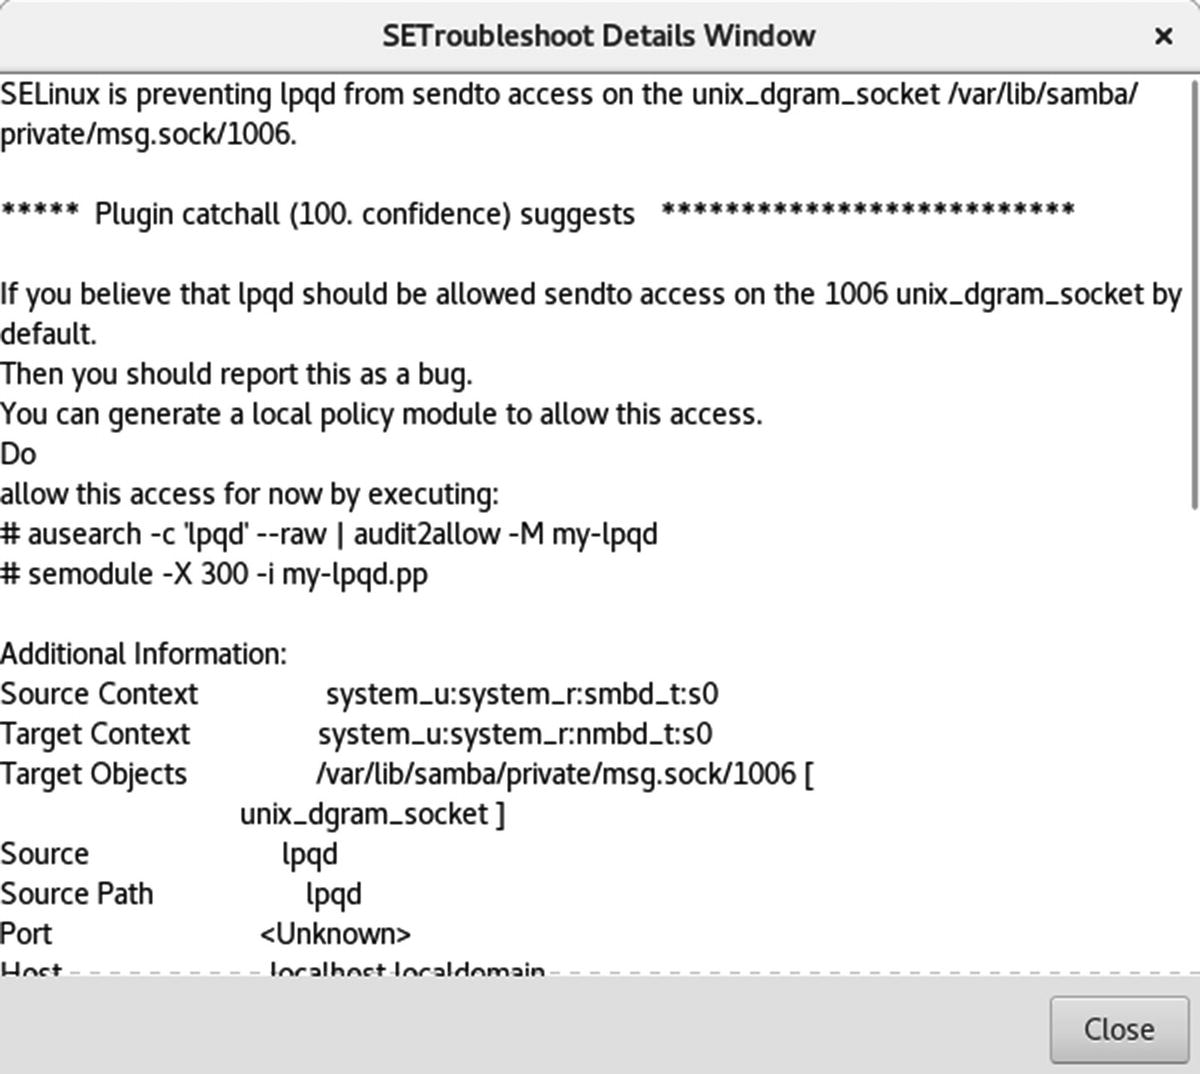
SELinux troubleshooter, full details window
You could also use the SELinux Management tool to make the changes. In this case, you’d choose the Network Port tab and click the Add button to open the Add Network Port dialog.
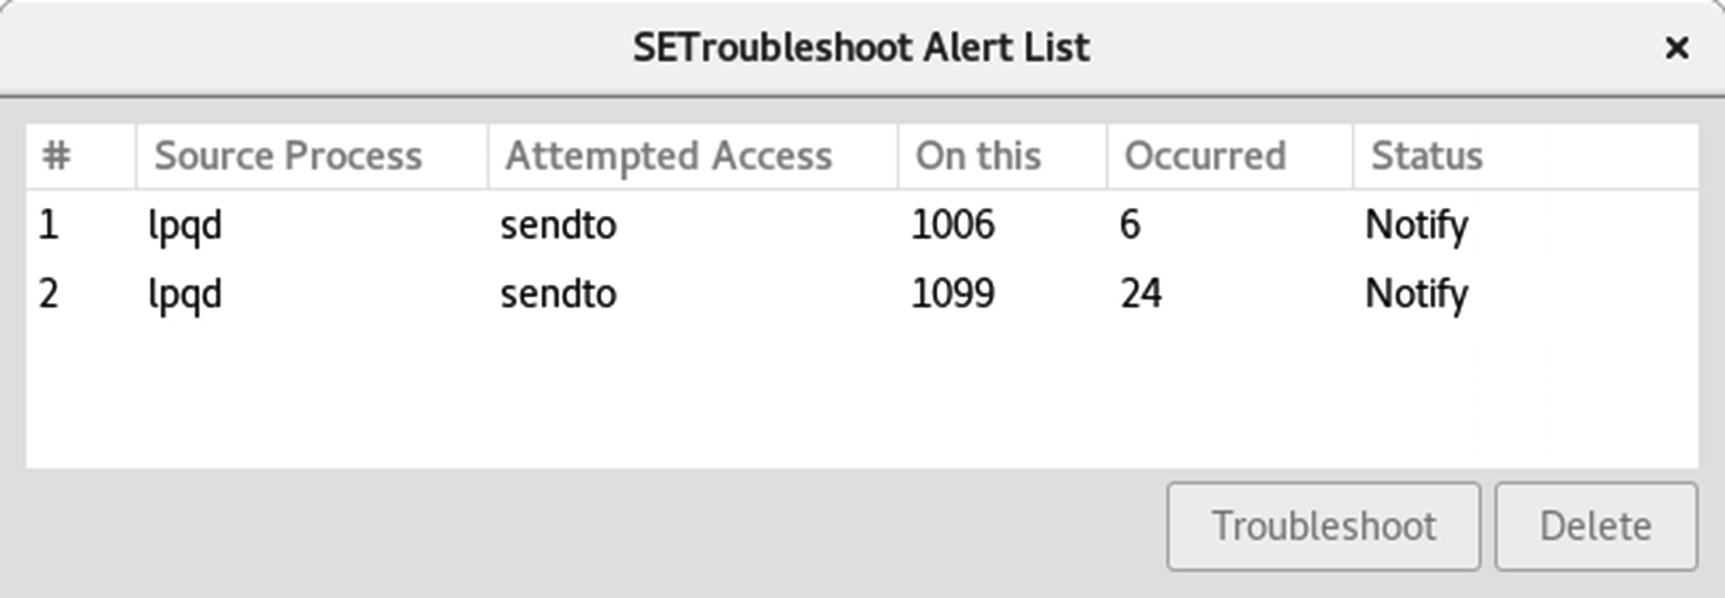
SELinux troubleshooter alert list
In the preceding example, the policy module is called local. If you later want to create a new module with audit2allow, you should either use a different name or append the output to the .te file, using the -o option.