7
Reducing the Distance Between the Virtual Cameras
7.1. Principle
We have seen that stereoscopy can be fatiguing, and that this may be linked to overly marked disparities (see section 3.2). However, these disparities may be reduced if we reduce the distance between the virtual cameras. In fact, if we reduce this distance, the differences between the two images are lessened; the disparities decrease, as does the perception of depth by stereoscopy. At the extreme, if the distance between the virtual cameras is zero, we return to monoscopic vision.
I have often done this experiment with my students, during demonstrations in class. They were introduced to a virtual world in an immersive hall. They had stereoscopic vision in the beginning, but also motion parallax (see section 7.2.1.2) and all the other monoscopic cues (see section 7.2.1.1). After a while, I began progressively reducing the distance between the cameras. After some minutes, I asked them if they had noticed that the stereoscopy was no longer in operation. Out of almost 200 students, not even one had noticed that the stereoscopy had been eliminated. Some were still marveling over the 3 dimensions when I announced that there had been no stereoscopy for more than 5 min. I performed this experiment with the entirely pedagogic aim of showing them that stereoscopy is interesting, but not at all essential. Moreover, it is not the principal cue for depth perception. However, in view of the overwhelming majority of students who did not notice when the 3D was stopped, even having seen their classmates going through the same experiment, I began to wonder if this would not be an interesting way to reduce fatigue while still preserving the impressive side of demonstrations of stereoscopy.
7.1.1. Usefulness of stereoscopy in depth perception
We saw in section 7.4.2 that stereoscopy is one cue for depth perception, but not the only one. We wanted to verify the importance of this cue compared to others, and notably compared to motion parallax in an immersive hall. To measure this importance, we tried to quantify the perception of curvature in immersion using different types of immersion to verify which cues were the most significant in the perception of curves.
7.1.1.1. Protocol
7.1.1.1.1. The subjects
15 subjects underwent tests of perception of a sphere, while 18 people were tested on an unspecified shape. The subjects had to be in good health. They might have vision problems (myopia, astigmatism, farsightedness, presbyopia), as long as they wore corrective lenses. They had to be capable of moving around the room with no inconvenience. The interocular distance was measured for each subject and integrated into calculation of the virtual images when stereoscopy was being used.
All subjects needed to verify that they had good binocular vision. A simple screening test was carried out before the perception test itself: the subject was shown two adjacent cubes of different dimensions, with one significantly closer than the other. The person had to determine which was closer, three times in a row to eliminate guesswork.
7.1.1.1.2. Method used
The method we used was that of constant stimuli. This is in fact the most reliable and the most precise method [BON 86].
We looked for a differentiation threshold (“do you perceive the same virtual object as the physical object?”), and therefore used for our initial shape the virtual object corresponding to the real object. We identified a set of seven variations in each dimension (width, height, thickness) centered around the dimensions of the original object. We used an arithmetic progression rule for ease of use. Each stimulus was displayed three times by random sampling without replacement.
7.1.2. The objects
7.1.2.1. The sphere
7.1.2.1.1. The real sphere
The real sphere (Figure 7.2) was in reality a smooth plastic balloon with a diameter of 20 cm, painted green to match the color of the virtual model. It was shown in front of a black backdrop and lit in the same way as the virtual model (lamp arranged at the same location and intensity adjusted by hand by the experimenter, for the best possible correspondence, Figure 7.1). We tried to take films or photos of the two spheres to get the best comparison of luminosity. However, since the screen was rear projected, the sensor was saturated and could not take a photo showing what the eye perceived, as too much bias was induced by these sensors.
The distance between the two lower lamps was 0.9 m. They were situated 0.98 m beneath the shape. The upper lamp was situated 0.62 m above the shape.
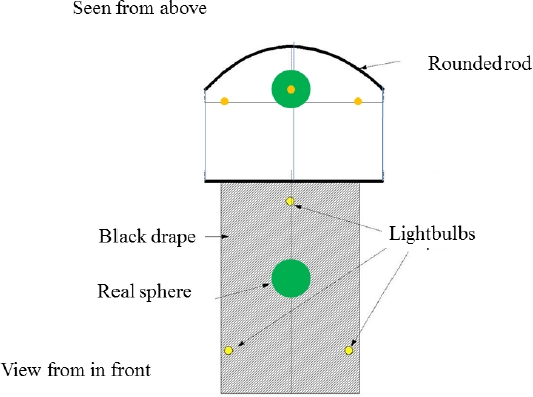
Figure 7.1. Diagram of real equipment
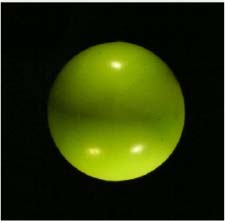
Figure 7.2. Real sphere
7.1.2.1.2. The virtual spheres
The standard sphere was thus a relatively accurate reproduction of the balloon (assumed spherical). It was green and also placed in front of a black background (Figure 7.3). We altered it dimension by dimension by less than 3% of the initial diameter (6mm) centered on the original value for the horizontal and vertical dimensions (called the width and the height, for ease of use further on) and by less than 12% of the initial diameter (24 mm) for variations in depth. These steps were specified in preliminary tests, carried out on three people. When one dimension was changed from the size of the original sphere, the others kept their original value, so as to change only one dimension at a time.
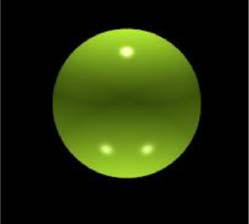
Figure 7.3. Virtual sphere
7.1.2.2. Unknown shape
The purpose of the unknown shape test was to see if the subjects were influenced by the sphere being a simple shape. It would be interesting to know the reaction of subjects faced with a totally unknown shape, whose radius of curvature is not fixed. This is a very interesting case because it is much closer to the shapes encountered in everyday life, especially in the automotive industry. However, the results were equally more complex to analyze.
7.1.2.2.1. The real shape
This unknown shape was a “deformed” sphere. It had the same average dimensions as the sphere in the previous section, but showed no symmetry (Figure 7.4). It was conceived and drawn using CATIA (CAD software) and constructed by rapid prototyping in rigid polystyrene foam with the help of Charly Robot, a digital machine tool. This shape was painted with the same green paint used for the real sphere and was held in the same position as the virtual form by three cables to avoid rotation.
It was also placed in front of a black backdrop (the same as for the sphere) and the same lighting was used (set up in the same way). In Figure 7.5, we see the overall set-up. Note that, in the photo, the lamps are obvious. During the tests, they were hidden (the one above by a drape, the one below by a board painted black).
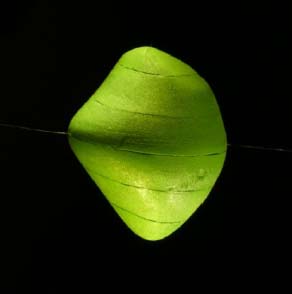
Figure 7.4. Real unknown shape close-up
7.1.2.2.2. The virtual shape
The basic virtual set-up was the same used for the design of the real setup (using CATIA): green, and placed in front of a black backdrop (Figure 7.6).
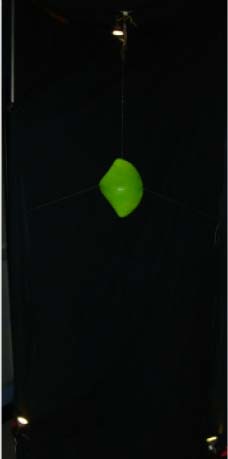
Figure 7.5. Complete real set-up, distance view
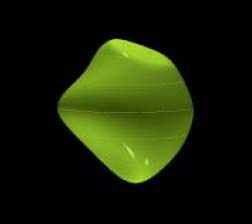
Figure 7.6. Virtual unknown shape
7.1.2.2.3. Experiments carried out
Sequences
We varied several parameters:
- – distance between the two virtual cameras;
- - the distance between the two virtual cameras is nil (monoscopic vision),
- - the distance between the two virtual cameras is adjusted to the interpupillary distance of the subject,
- - the distance between the two virtual cameras is double the interpupillary distance of the subject. This spacing was chosen so as to have the same deformation for each subject, whatever the distance between their eyes;
- – tracking the subject’s point of view;
- - the subject is fixed in place and not allowed to move. The virtual camera is fixed in the direction of the area where the subject’s head is sensed to be,
- - the subject can move around and the virtual camera follows the position and orientation of the head;
- – position of the shape with respect to the screen;
- - the shape is on the screen, minimizing horizontal parallax,
- - the shape is in front of the screen, which allows the subject to move more around it and reduces pixellation,
- - the shape is behind the screen;
- – the shape itself;
- - the shape is a sphere, a basic shape well known to all subjects,
- - the shape is at first unknown to the subjects.
We tested all the combinations of these parameters, giving us 36 combinations. When the point of view of the subject was not tracked, it therefore had a fixed position in both real and virtual worlds. This depended on the position of the virtual object. We defined these so that the subject was always 1.2 m away from the virtual as well as the real shape. This distance was chosen based on Johnston’s results (see section 7.4.2.1) and based on the set-up of our equipment. The crosses on the ground defining these positions were shown to the subject before beginning the very first sequence, as shown in Figure 7.7.
When the shape is behind the screen and when the subject is fixed, the projection of the standard shape is 14 cm in diameter, corresponding to 87 pixels. Thus, a variation of 3% in its diameter changes 2.61 pixels. When the standard object is on the screen, however, its projection is 20 cm in diameter, thus 124 pixels. A 3% change in its diameter thus changes 3.72 pixels. Finally, when the standard shape is located in front of the screen, its projection measures 34 cm, or 211 pixels. A change in 3% adds or removes 6.33 pixels.
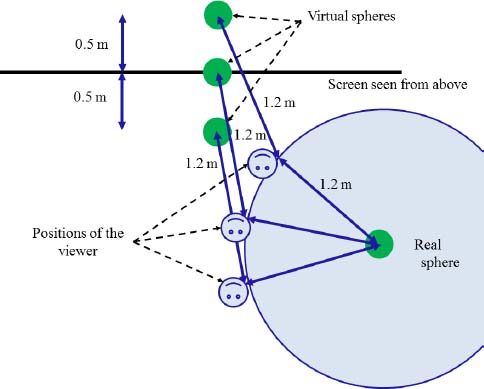
Figure 7.7. Positioning of virtual and real objects and of the observer when the virtual object moves
During a sequence
At the beginning of each sequence, instructions are given to the subject at the top left of the screen. The instructions may be:
“You can move around the room”
or
“Stand on the cross which is nearest the screen”
At the middle of the screen, a phrase invites the tester to press the “A” button on the WiiMote (the big round button on the front) as soon as they have read the instructions.
“Press A to begin”
When a sequence begins, we begin varying the width of the virtual sphere. The subject is alerted all through the test by the phrase:
“The width of the sphere will vary. Is the virtual shape less wide (−) or wider (+)?”
The subject is thus asked to press the “–” or “+” button of the controller (Figure 7.8) to give their opinion. When a button is pushed, a confirmation request appears on the screen:
“You pressed “–/+”; please press “A” to confirm”

Figure 7.8. Screen capture during the test: requesting confirmation of a response
When they validate their response, the object disappears for half a second to prevent comparison between the virtual shapes, before displaying the next variation. If the subject presses “A” without having given a response, the program does not validate and displays the same object again.
There are three series of seven random variations of the object’s width, without replacement. After these 21 questions are posed, the subject is advised of the change in the dimension studied by the phrase:
“Change in dimension: the height will vary”
A new series of 21 questions on the height follows, and another on the depth. Each time the question changes:
“The height of the sphere will vary: is the virtual sphere smaller (–) or larger (+)?”
“The depth of the sphere will vary: is the virtual sphere less deep (–) or deeper (+)?”
During the tests with the unknown shape, obviously the word “sphere” in the previous questions is replaced by the word “shape”.
7.1.2.3. Result
We therefore tested many conditions, but for our purposes, we only compared some of them. If you are curious and wish to know what results all the conditions gave, I invite you to read my thesis.
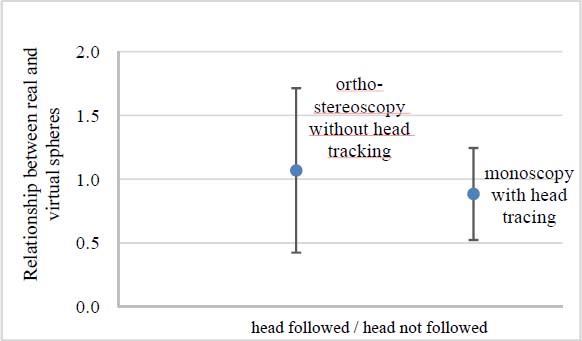
Figure 7.9. Influence of stereoscopic disparities or motion parallax on the cumulative perception of the sphere and the random form
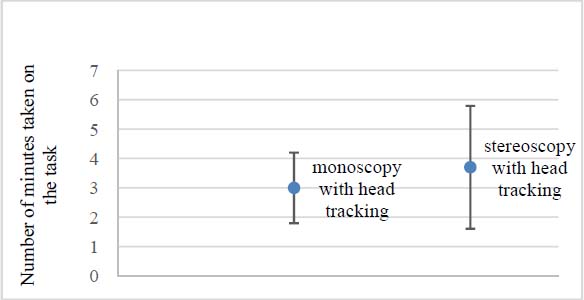
Figure 7.10. Average time taken for the task
7.1.2.3.1. Motion parallax or stereoscopy?
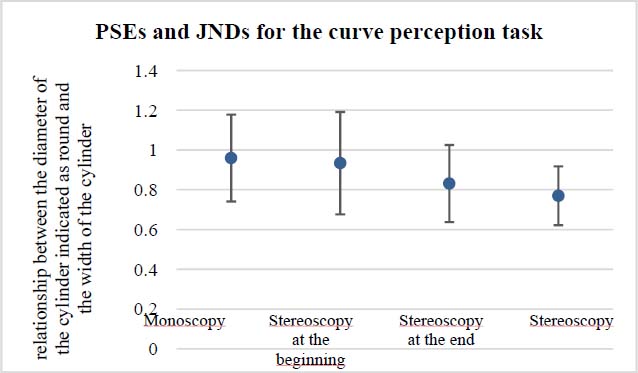
We show in Figure 7.9 the different influences of the two cues of depth perception: stereoscopy and motion parallax. The dots in the graph represent the point of subjective equalization (PSE), that is the diameter of the virtual object divided by that of the real object. The closer it is to 1, the better it is. The bars represent the just noticeable difference (JND) – the smaller it is, the better it is. We can see that motion parallax is a more effective cue for perception of curves than stereoscopic vision, allowing a more precise perception of curves.
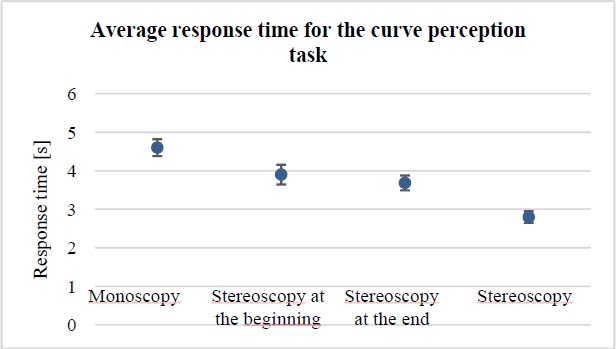
We might think that the subject would take more time to perceive changes in shape when their point of view is tracked, since they are moving around the object. However, making the decision took longer when the point of view was not tracked than the time taken to move to another point of view when the latter was tracked. As shown in Figure 7.10, the average time taken for the task when the point of view was tracked in monoscopic vision was less than in stereoscopic vision with a tracked point of view. This difference is significant (probability of significance: 99%). Thus, it is preferable to be in monoscopic vision with a tracked point of view than in stereoscopic vision with point of view untracked, if we wish to minimize the time taken on a task.
7.1.2.3.2. Contribution of stereoscopy in the presence of motion parallax
We see in Figure 7.11 that there is improved accuracy in perception of curves (the length of the bar) when motion parallax is present. Stereoscopy is thus interesting, even when there is another depth cue.
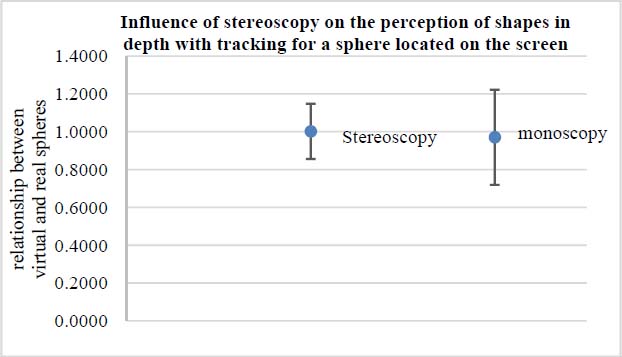
Figure 7.11. Influence of stereoscopy on perception of curves when motion parallax is present
7.1.3. Hypothesis
We thus present the hypothesis that stereoscopy is useful for carrying out tasks in a virtual world, but that it can also be temporarily interrupted without people noticing, so as to rest their visual system. We will also try to determine when it is preferable to activate stereoscopy, with respect to the type of task requested.
