Practice

Now you’ll have a chance to try a few more test-like problems in a scaffolded way. We’ve provided some guidance, but you’ll need to fill in the missing parts of explanations or the step-by-step math in order to get to the correct answer. Don’t worry—after going through the worked examples at the beginning of this section, these problems should be completely doable.

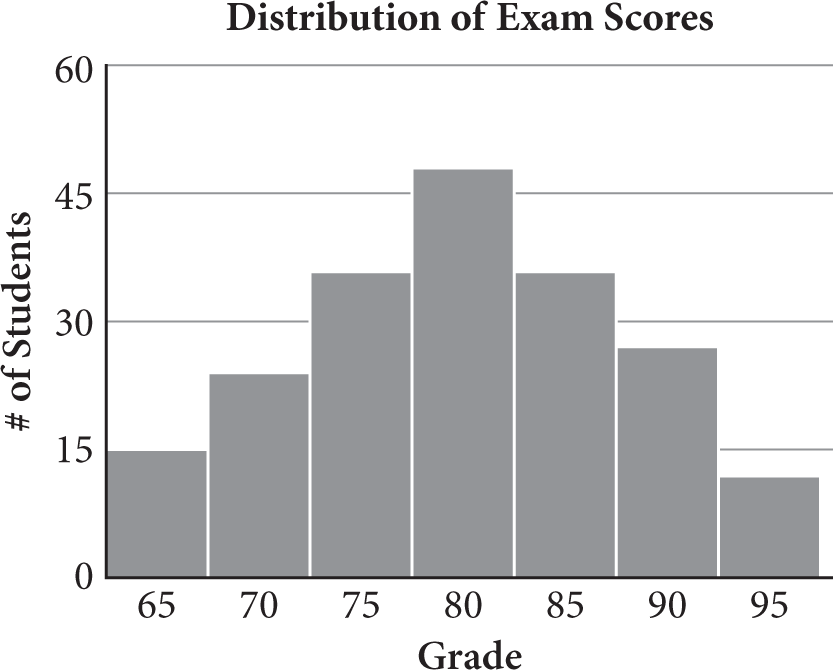
  1. A history professor observes that the scores of a recent 20-question multiple choice exam are normally distributed as shown in the histogram above. However, she later discovers that 25% of the results were omitted from the distribution. Of the omitted scores, 80% are greater than what the professor thought the mean was; the rest are less. Assuming all new data points fit in the current histogram range, which of the following is most likely to occur upon adding the new scores to the data?

    1. The data will be skewed to the right.
    2. The data will be skewed to the left.
    3. The median will decrease.
    4. The range will decrease.

The following table can help you structure your thinking as you go about solving this more involved problem. Kaplan's strategic thinking is provided, as are bits of structured scratchwork. If you’re not sure how to approach a question like this, start at the top and work your way down.

Strategic Thinking Math Scratchwork

Step 1: Read the question, identifying and organizing important information as you go

You need to determine the effect of adding extra data points, most of which are above the mean, to what was previously a normal (symmetric) distribution.

Step 2: Choose the best strategy to answer the question

The question states that most of the new scores are above the mean. Draw a rough sketch of what the new distribution will look like.

post-addition:

The choices mention skew, median, and range. Think about the effect the additions to the data set will have on each of these.

direction of skew:

median shift:

range shift:

Step 3: Check that you answered the right question

If you chose (B), congrats! You’re correct.

Now try a multi-part question set.

  1. Questions 9 and 10 refer to the following information.

  2. 1 2 3 4 5 Total
    Worker
    Placement
    5 17 24 10 5 61
    Bidding 3 12 28 8 3 54
    Area Control 3 10 30 14 2 59

    A small boutique sells board games online. The boutique specializes in worker placement, bidding, and area control board games. Any customer who purchases a game is invited to rate the game on a scale of 1 to 5. A rating of 1 or 2 is considered “bad,” a rating of 3 is considered “average,” and a rating of 4 or 5 is considered “good.” The table above shows the distribution of average customer ratings of the board games sold by the boutique. For example, 24 of the worker placement games sold by the boutique have an average rating of 3.

    1. According to the table, what percent of all the board games sold by the boutique received a rating of “bad”? Round to the nearest tenth of a percent and ignore the percent sign when entering your answer.

    2. The boutique decides to stop selling 50% of the board games that received a rating of “bad” to make room for promising new stock. Assuming no significant changes in ratings in the foreseeable future, what should the difference be between the percentages of board games with a rating of “bad” before and after this change? Round to the nearest tenth of a percent and ignore the percent sign when entering your answer.

The following table can help you structure your thinking as you go about solving this question set. Kaplan's strategic thinking is provided, as are bits of structured scratchwork. If you’re not sure how to approach a question like this, start at the top and work your way down.

Strategic Thinking Math Scratchwork

Step 1: Read the first question in the set, looking for clues

You’re provided a chart with data on the average ratings of board games sold by a boutique.

Step 2: Identify and organize the information you need

You’re asked to find the percent of games that received a rating of “bad”, meaning a rating of 1 or 2.

find % of games with “bad” rating

Step 3: Based on what you know, plan your steps to navigate the first question

Examine the chart carefully, identifying the necessary data from each type of game. You need to determine how many games received a rating of 1 or 2.

worker placement

1: games

2: games


Add the figures to get the total number of games that received a rating of “bad.”

bidding

1: games

2: games

area control

1: games

2: games

total:

Step 4: Solve, step-by-step, checking units as you go

Use the values in the table to find the total number of games in these groups. Write the “bad” part over the total game count, and then convert to a percent.

_____ × 100 % = _____%

Step 5: Did I answer the right question?

If you got 28.7, you’re correct!

Great job! Repeat for the second question. Kaplan's strategic thinking is on the left, and bits of scratchwork guidance are on the right.

Strategic Thinking Math Scratchwork

Step 1: Read the second question in the set, looking for clues

From the previous question, you know the number (and percent) of games that received a rating of “bad.”

# games with “bad” rating: ____; = ____%

Step 2: Identify and organize the information you need

You’re asked for the difference between the percentages of games that received a “bad” rating before and after 50% of such games are removed from the store’s inventory. Your answer from the previous question is key to this calculation.

“bad” % pre-removal: %

“bad” % post-removal: ?

Step 3: Based on what you know, plan your steps to navigate the second question

You know the store wants to get rid of 50% of the games that received a “bad” rating. You already know the current number with a “bad” rating, so finding the new “bad” game count is straightforward. Once there, determine the new “bad” percentage and subtract that from the original.

____ × old “bad” count = new “bad” count convert to %

old “bad” % – new “bad” % = answer

Step 4: Solve, step-by-step, checking units as you go

After the 50% reduction in “bad” games, how many games should have a “bad” rating?

% × old “bad” count
= new “bad” count

×  
                          =  

Reduce the original “bad” game count by 50%.

new “bad” %: × 100
                          = %

Divide your new “bad” count by the total game count. Remember that when the number of “bad” games decreases, the total count decreases by the same amount. Write your results using a couple of decimal points to minimize rounding errors.


Subtract the new “bad” percent from the old “bad” percent.

old “bad” % – new “bad” %: % – %
= %

Step 5: Did I answer the right question?

Did you get 11.9? If so, you’re absolutely correct!

% change:

Nice work! Now test what you’ve learned by taking a brief quiz.