Chapter 5
Flow of concentrated suspensions through fractures: small variations in solid concentration cause significant in-plane velocity variations
Ricardo Medina1, Jean E. Elkhoury1,2, Joseph P. Morris2,3, Romain Prioul2, Jean Desroches4 and Russell L. Detwiler1
1Department of Civil and Environmental Engineering, University of California, Irvine, CA, USA; 2Schlumberger-Doll Research, Cambridge, MA, USA; 3Computational Geosciences, Lawrence Livermore National Laboratory, Livermore, CA, USA; 4Services Pétroliers Schlumberger, Paris, France
Abstract
Flow of high-concentration suspensions through fractures is important to a range of natural and induced subsurface processes where fractures provide the primary permeability (e.g., mud volcanoes, sand intrusion, and hydraulic fracturing). For these flows, the simple linear relationship between pressure gradient and flow rate, which applies for viscous-dominated flows of Newtonian fluids, breaks down. We present results from experiments in which a high concentration (50% by volume) of granular solids suspended in a non-Newtonian carrier fluid (0.75% guar gum in water) flowed through a parallel-plate fracture. Digital imaging and particle image velocimetry analysis provided detailed two-dimensional maps of velocities within the fracture. Results demonstrate the development of a strongly heterogeneous velocity field within the fracture. Surprisingly, we observed the highest velocities along the no-flow boundaries of the fracture and the lowest velocities along the centerline of the fracture. Depth-averaged simulations using a recently developed model of the rheology of concentrated suspensions of monodisperse solids in Newtonian carrier fluids reproduced experimental observations of pressure gradient versus flow rate. Results from additional simulations suggest that small (3%) variations in solid concentration within the fracture can lead to significant (factor of two) velocity variations within the fracture yet negligible changes in observed pressure gradients. Furthermore, the variations in solid concentration persist over the length of the fracture, suggesting that such heterogeneities may play a significant role in the transport of concentrated suspensions. Our results suggest that a simple fracture-averaged conductivity does not adequately represent the transport of suspended solids through fractures, which has direct implications for subsurface suspension flows where small concentration variations are likely.
Key words: fracture, granular, non-Newtonian, rheology, suspension
Introduction
Subsurface flows of fluids with high concentrations of suspended solids are important to a range of naturally occurring and applied problems. Naturally occurring phenomena such as intrusion of magmas composed of crystals suspended in silicate melts (Mader et al. 2013) and mobilization of suspended sediments in the shallow crust such as sand intrusion in sedimentary basins (Huuse et al. 2010) and mud volcanoes (Manga & Brodsky 2006) involve migration of fluidized solids through preexisting or propagating fractures. Engineering applications include environmental remediation (Murdoch et al. 2006), mud injection during drilling (Bittleston et al. 2002), and injection of slurries containing high concentrations of sands during hydraulic fracturing for both oil and gas production (Kern et al. 1959; Montgomery 2013). Suspended solids can alter fracture transmissivity if they become immobilized within the fracture or if their concentration is sufficiently large to change the suspension rheology.
The volumetric concentration of solids in a suspension, φ, strongly influences its rheology. In dilute suspensions (φ  0.2), interactions between particles are negligible, and the rheology of the suspension is similar to that of the suspending fluid, with the effective viscosity, μ, increasing with φ (Krieger & Dougherty 1959). Even at very low φ, particles may bridge or clog at pore throats leading to reduced permeability (Khilar & Fogler 1998). These permeability reductions may be reversed when the clogged particles are remobilized due to earthquake-induced shaking or pressure oscillations (Elkhoury et al. 2006, 2011). When φ approaches a critical limit, φcr, between the random loose and dense packing limits for the solids (0.55
  φcr
φcr  0.64), the particles become completely jammed and abruptly change to a rigid porous medium (Haw 2004). The permeability then decreases to that of a porous medium composed of the jammed solids. Subsequent large pressure perturbations can lead to fluidization of the jammed solids and remobilization (e.g., mud volcanoes). Here, we are interested in intermediate concentrations (0.2
  φ
φ  0.55) where fluid and solid flow together but particle–particle interactions are non-negligible leading to frictional losses that significantly alter the rheology of the suspension from that of the suspending fluid.
Over the past decade, frictional models for the behavior of dry granular solids have been extended to represent the behavior of solids suspended in viscous fluids. Early efforts focused on flows of granular solids down inclined planes (du Pont et al. 2003; Cassar et al. 2005) and established the importance of the dimensionless “viscous number,”  , which relates the timescale of the movement of a single particle subjected to a force Psd2 (where Ps is the pressure acting on a solid particle of diameter, d) in a fluid with viscosity, μf, to the timescale of the displacement of a particle caused by the imposed shear rate,
  . Boyer et al. (2011) demonstrated that relationships of the form
  can adequately quantify the shear stress and proposed corresponding constitutive relationships for the effective friction coefficient, μ(Iv), and volume fraction, φ(Iv). As shear rate (or Iv) increases, φ(Iv) decreases from a maximum of φcr when Iv → 0 and μ(Iv) increases from a minimum when Iv → 0. In pressure-driven internal flows (e.g., tubes and fractures), where the shear rate is maximum at the walls and vanishes along the centerline, the dependence of μ and φ on Iv gives rise to plug-flow behavior for larger values of φ0 (the average solid concentration of the well-mixed suspension and the uniform concentration at the inlet). The result is a localized region of high shear rate near the walls where φ < φ0 and a region in the center of the flow where φ → φcr and the fluid and solid move at the same velocity. Lecampion & Garagash (2014) extended the constitutive relationships for φ(Iv) and μ(Iv) proposed by Boyer et al. (2011) to develop a model for pressure-driven flows through tubes and channels.
Parallel-sided channels provide an idealized analog to fractures in geologic systems where fractures typically have rough walls that may also be permeable. However, as with early studies of Newtonian (Witherspoon et al. 1980) and non-Newtonian (Di Federico 1997) fluid flow in fractures, beginning with this idealized geometry provides a well-controlled step toward understanding more complicated geometries. The emphasis of previous suspension-flow studies in channels was to quantify the distribution of solids and velocity across the gap between the surfaces (or aperture). Here, we consider larger three-dimensional flow fields, where the velocity may also vary in the plane of the fracture. We are particularly interested in the influence of boundary conditions on suspension flows. In experimental and computational studies of fluid flow through fractures, uniform pressure is typically applied along two boundaries to create the pressure gradient that drives the flow. When studying suspension flows, it is also necessary to prescribe φ0 at the inlet boundary. The obvious choice is to also assume uniform φ0, but due to the strong dependence of the effective viscosity μ on φ, small variations of φ within the flow field can cause variations and instabilities in the velocity field. In addition, many previous studies of the rheology of concentrated suspensions focused on idealized monodisperse (Karnis et al. 1966; Lyon & Leal 1998a) or bimodal (Lyon & Leal 1998b) spherical solids. Here, we explore the implications of the complex rheology of a mixture of guar and silica sand representative of suspended solids encountered in the subsurface. In particular, we focus on conditions where suspended solids flow with the fluid, and we do not consider conditions under which the settling of solids within the fracture is important.
We present results from a pair of experiments in which we flowed high-solid-concentration fluid through a parallel-sided fracture with two different boundary-condition configurations. To aid in interpreting the results of the experiments, we simulated flow through the experimental system using the rheological model of Lecampion & Garagash (2014).
Overview of experiments
We designed an experimental apparatus to explore the role of suspension rheology and flow geometry on fracture flow. Transparent parallel-sided fractures provide the ability to both directly measure the flow geometry under experimental conditions and visualize and quantify the velocity field within the fracture. Here, we describe the experimental apparatus, the details of the fluid–solid mixture used for the experiments, the configuration of the experimental system, and the procedure used to carry out the experiments.
Experimental apparatus
A rotating stand rigidly fixed a high-sensitivity 12-bit charge-coupled device camera (Photometrics Quantix KAF-6303e) above a monochromatic (red) light-emitting diode panel. Clamps held the fracture cell to the stand between the light source and the camera. Two ∼0.3-cm-thick aluminum shims separated the two fracture surfaces (15 cm × 15 cm × 1.2 cm smooth glass plates) and served as no-flow boundaries along the fracture edges. The fracture cell secured the fracture surfaces while allowing visualization of the entire flow field. An electronic controller synchronized 65-ms pulses of the light source with the camera exposure to provide reproducible high-resolution (76 × 76-µm pixels) measurements of transmitted light intensity (Fig. 5.1). Section “Image analysis” describes how we processed measured intensities to yield velocity fields.
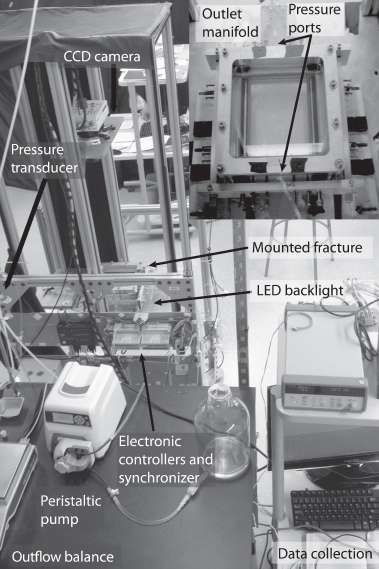
Fig. 5.1 Photograph of experimental setup and fracture cell (inset).
We carried out two experiments in the same fracture with different inlet/outlet boundary conditions. Experiment A used linear inlet and outlet manifolds (Fig. 5.2A), which included large rectangular channels that spanned both ends of the fracture. Initially, a high-capacity syringe pump pushed slurry into one end of the inlet manifold (dark gray arrow) and out a waste line at the other end of the inlet manifold (light gray arrow) filling the manifold with slurry. We then closed the waste line and opened the two outlets on either side of the outlet manifold (black arrows) to initiate flow through the fracture. Experiment B used a wedge-shaped manifold (Fig. 5.2B) that allowed us to flow directly into the fracture without prefilling the manifold. This configuration included only a single inlet and a single outlet tube. Furthermore, the wedge-shaped manifold tapers gradually from the inlet port (gray arrow) to a rectangle with the same width (W) and aperture (h) as the fracture. A differential pressure transducer connected to the ports located at the center of the inlet and outlet manifolds (marked by X in both configurations in Fig. 5.2) measured the differential fluid pressure (ΔPf) across the fracture at high temporal resolution (0.3 Hz) during each experiment.
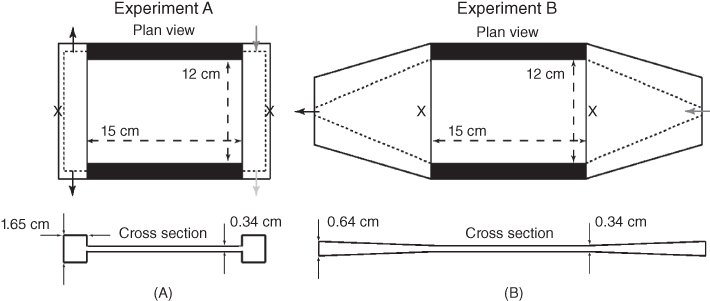
Fig. 5.2 Schematic of inlet and outlet manifold configurations for Experiments A and B. The separate schematics shown for Experiments A and B highlight the difference between the manifold geometries for the two experiments. For Experiment A, a large rectangular channel (much more conductive than the fracture) bounded each end of the fracture. For Experiment B, the manifold gradually tapered from the inlet/outlet tubing to the fracture geometry. The schematic shows the location of the inlet (dark gray arrows), outlet (black arrows), and waste (light gray arrow; Experiment A only). Symbol ‘x’ marks the locations of the pressure ports that were connected to the differential pressure transducer.
Fluid description and experimental configuration
For both experiments, we used a carrier fluid consisting of 0.75% by volume mixture of guar gum and water. This guar/water mixture is a shear thinning fluid that behaves as a Newtonian fluid under low shear rates and exhibits non-Newtonian behavior at higher shear rates (Fig. 5.3). We selected guar because it is a well-characterized high-viscosity fluid that can be prepared reliably and consistently as a base fluid for high-solid-concentration slurries. A laboratory-grade blender (Waring 7012G) mixed the guar/water solution. We slowly added guar with the blender operating at 6800 rpm. After adding all of the guar, we added biocide (glutaraldehyde, 0.005% by volume) and increased the blender speed to 16,900 rpm and mixed for at least 10 min to ensure complete hydration of the guar. Applying a vacuum for at least 12 h removed most of the trapped air bubbles from the carrier fluid.
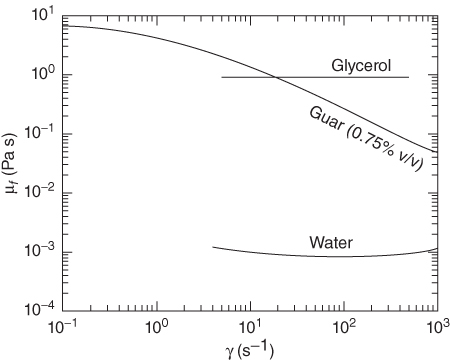
Fig. 5.3 Measured viscosities (μf) plotted against shear rate ( ) for water, glycerol, and the 0.75% guar–water mixture used as the carrying fluid for the experiments.
We prepared the high-solid-concentration fluid by adding 50% by volume of silica sand to the de-aired carrier fluid. The sand had a multimodal particle-size distribution ranging from submicron to about 600 µm (Fig. 5.4). Note that the fines served to reduce the permeability of the solids, which reduced their settling rate such that negligible settling occurred within the fracture. A rotary paddle mixed the slurry as we slowly added sand. After adding all of the sand to the guar solution, we stirred the slurry under vacuum for approximately 15 min to ensure a well-mixed and bubble-free slurry. Removing bubbles was important both for the flow characteristics (entrained gas increases compressibility of the fluid) and optical quantification of the flow field (Section “Image analysis”).
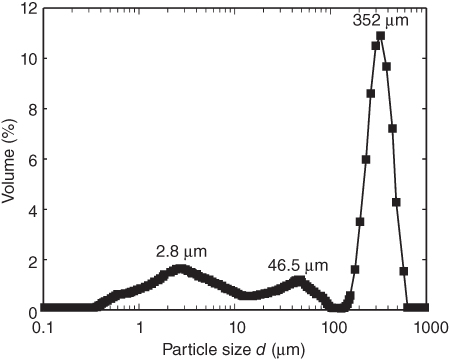
Fig. 5.4 Particle-size distribution for the solids used in the flow experiments. The solids consisted of angular silica sand grains.
After mixing, we immediately transferred the slurry to a high-capacity (12.5 l) syringe pump to minimize solid particle settling prior to initiating slurry flow. The syringe pump consisted of a clear polycarbonate pipe (2.5 m long, 2.5 cm inner diameter) fitted with a plunger from a 60-ml syringe. A plastic funnel capped the bottom of the tube and provided a smooth transition from the pipe to the 3-mm-inner-diameter tubing. Water pumped through a tube using a peristaltic pump (Masterflex LS) displaced the plunger and pushed slurry through the funnel at specified flow rates. Balances recorded the mass flow rate of water into the syringe (Qinρw) and the mass flow rate of slurry from the fracture (Qoutρs).
Experimental procedure
Prior to initiating flow experiments, we used light-transmission techniques to measure the fracture aperture field. This involved two steps: (i) measuring the mean fracture aperture and (ii) measuring the spatial distribution of aperture within the fracture (see Detwiler et al. 1999 for details). To measure the mean aperture, we oriented the fracture vertically with the inlet at the bottom and filled the inlet tubing, manifold, and about 10% of the fracture with dyed water (FD&C Blue No. 1 at 32 mg 1–1, Warner Jenkins) and acquired a set of images. We then measured the volume of fluid (Vd) required to nearly fill the fracture (∼90%) and acquired another set of images. This provided an accurate measure of the mean fracture aperture, ⟨h⟩ = Vd/Ad, where Ad is the area occupied by the injected fluid. We then acquired a set of images with the fracture completely filled with dyed water, flushed the fracture with ∼10 pore volumes of deionized water, and acquired a set of reference images with the fracture filled with deionized water. We used these images to calculate the spatial distribution of the fracture aperture (described in Section “Aperture measurement”). After measuring the aperture field, we drained and dried the fracture and associated tubing to prepare for the flow experiment.
After drying the fracture, we filled the inlet tubing with solid-free carrier fluid while carefully preventing entrainment of air bubbles. After filling all of the inlet tubing, we slowly filled the fracture with carrier fluid and acquired a set of reference images. We then rotated the fracture to horizontal and initiated slurry injection at 6.0 ml min−1. When the fracture was completely filled with slurry and the effluent mass flow rate reached steady state, we began a stepped flow experiment with image acquisition at regular intervals.
Image analysis
Raw images consist of measured light intensity values, which we transformed to light absorbance,  , where Ir is the measured intensity at a pixel in a reference image and Ii is the measured intensity at the same pixel in the measured image. Converting measured intensities to absorbance allows quantitative comparison of images between experiments by eliminating the influence of variations in camera or light-source settings. In addition, absorbance fields provide greater contrast between flowing particles and the carrier fluid.
Aperture measurement
Light absorbance can also be directly related to fracture aperture by applying the Beer–Lambert law (Christian et al. 2014) to measurements of the fracture filled with clear and dyed water:

where I is the measured intensity at a location, I0 is the incident light intensity, ϵ is the absorption coefficient of the solute, C is the dye concentration, h is the solute-filled gap, and ξ, is a constant that accounts for absorbance by the solvent and the glass plates (Detwiler et al. 1999). Though the fracture consists of two pieces of flat glass, small variations in long-wavelength aperture are common. These variations can be quantified using light-transmission techniques to measure the fracture aperture; see, for example, Detwiler et al. (1999). The aperture at any location is then calculated as

where ⟨A⟩ is absorbance averaged over the entire field. This method of measuring fracture aperture yields measurements of hi,j that are accurate to within approximately ±1% of ⟨h⟩, or about 30 µm for the fracture used in these experiments. Table 5.1 summarizes the details of the fracture aperture measurements for Experiments A and B.
Table 5.1 Parameters and geometry for both experiments
| Fracture size | |
| L × W (cm) | 15 × 12 |
| Aperture (cm) | |
| Mean | 0.34 |
| Standard deviation | <0.01 |
| Flow-rate range (ml min–1) | 0.2–6.0 |
List of notations
| Symbol | Definition |
| α | Tracked particle (–) |
 |
Shear rate (s−1) |
| ΔPf | Pressure difference of fluid across fracture (psi) |
| Δt | Time step used in simulation (s) |
| Δx | Size of cell in the x-direction (cm) |
| Δxα | x-Displacement of tracked particle (cm) |
| Δy | Size of cell in the y-direction (cm) |
| Δyα | y-Displacement of tracked particle (cm) |
| ϵ | Absorption coefficient of solute (l mol−1 cm−1) |
| μ | Effective carrier-fluid viscosity (Pa s) |
| μf | Viscosity of carrier fluid (Pa s) |
| ξ | Absorbance of solvent and glass plates (–) |
| T | Shear stress (Pa) |
| Φ | Volumetric concentration of solids (–) |
| φ0 | Average solid volume concentration (–) |
| φcr | Critical volumetric concentration of solids (–) |
| ρs | Density of slurry (kg l−1) |
| ρw | Density of water (kg l−1) |
| Ωij | Region occupied by cell i,j (cm2) |
| A | Light absorbance (–) |
| Ad | Area occupied by dyed water (cm2) |
| C | Solute concentration (mol l−1) |
| h | Fracture aperture (cm) |
| I | Measured light intensity (cd) |
| I0 | Incident light intensity (cd) |
| Iv | Viscous number (–) |
| i,j | Coordinate positions in the x- and y-directions, respectively |
| L | Fracture length (cm) |
| P | Total pressure (Pa) |
| Ps | Pressure acting on a solid particle (Pa) |
| Pf | Pressure acting on the fluid (Pa) |
| Qin | Influent flow rate (ml min−1) |
| Qout | Effluent flow rate (ml min−1) |
| Uα | Volume of parcel of fluid occupied by tracked particle α (cm3) |
| Vd | Volume occupied by dyed water (cm3) |
| Vx | Velocity component in flow direction (m s−1) |
| vxij | x-Velocity component in cell i,j (cm s−1) |
| vyij | y-Velocity component in cell i,j (cm s−1) |
| W | Fracture width (cm) |
| ⟨·⟩ | Spatially averaged quantity |
Particle image velocimetry
We used particle image velocimetry (PIV) analysis to calculate velocity fields from the measured absorbance fields using a modified version of the MATLAB-based software, PIVlab (Thielicke & Stamhuis 2012). A high-pass filter applied to the absorbance fields removed long-wavelength features and increased the contrast between individual sand grains and the surrounding carrier fluid. We divided the fracture image into 40 × 40-pixel subregions and calculated the cross-correlation between corresponding subregions in pairs of sequential images. The PIV algorithm provided a local measure of the average distance sand grains moved from one frame to the next. We note that the absorbance fields provide a high-resolution measure of the depth-integrated absorbance of the slurry-filled fracture. Thus, the resulting velocity fields indicate an average measure of the velocity of the solids at each location in the fracture. For φ0 = 0.5 (our experiments), we expected the formation of a high-concentration plug in the center of the fracture. Therefore, the measured velocity fields are probably more heavily weighted by particles traveling at the peak velocity and, thus, represent an overestimate of the average slurry velocity. We performed PIV analysis on the entire data set (1000s of images) and constructed the time series of the evolving velocity field within the cell. The supplemental material includes animations of the measured absorbance fields used for the PIV analysis.
Experimental results
After initializing slurry flow through the fracture, we carried out the two flow experiments by sequentially decreasing the flow rate through a sequence of steps and then increasing it through a subset of the same flow rates. At each flow rate, we attempted to allow the pressure differential (ΔPf) and effluent mass flow rate (Qoutρs) to reach steady state. Figure 5.5 shows the time series of mass flow rate of water pumped into the large injection syringe, Qinρw (black circles), the differential pressure measured across the fracture, ΔPf (dark gray), and the normalized effluent mass flow rate,  (dashed black line). Because the density of the slurry (ρs) was ∼1.8 kg 1−1, we expected the dashed black line in Figure 5.5 to be relatively constant at a value of 1.8. This was the case for Experiment A, but for Experiment B, each change in flow rate resulted in an immediate increase in
  during decreasing flow-rate steps (or, vice versa, decrease in
  during increasing flow-rate steps) followed by a gradual decrease in
  (or, respectively, an increase in
  ) during the following period of constant flow rate. This anomalous behavior during Experiment B resulted from expansion/compression of a volume of about 75 ± 5 ml of air that entered the injection syringe during filling. At each flow rate, as the trapped air equilibrated with the new pressure,
  gradually approached the expected steady-state value of 1.8.
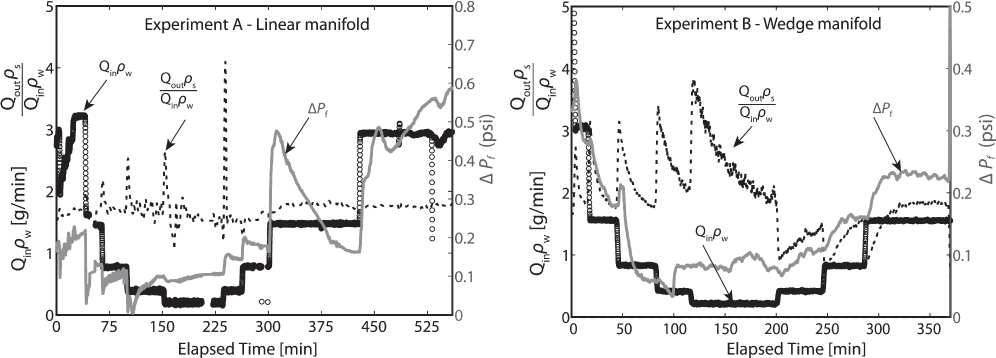
Fig. 5.5 Mass flow rate of water into the syringe pump (black circles) and differential pressure across the fracture (dark gray) plotted against time for Experiments A and B. The dashed black line is the ratio of the mass flow rate of high-φ effluent from the fracture over the mass flow rate of water into the syringe. At steady state, the dashed black line will be equal to the density of the high-solid-concentration fluid (∼1.8 kg l−1).
Despite the transient flow rates observed during Experiment B, the transients observed in ΔPf are consistent with the changing flow rate. That is, as the flow rate gradually approached steady state after each change in flow rate, ΔPf approached steady state at a similar rate. An exception occurred at the lowest flow rates (t ∼ 100–150 min), where ΔPf became relatively constant even when flow rate changed. For Experiment A, the correlation between Qout and ΔPf was not as clear, particularly for the increasing flow steps. This was likely due to changes in the distribution of solids and fluid within the inlet and outlet manifolds.
To interpret the transient behavior observed during the experiments, it is useful to plot steady-state flow rate (Qout) versus the corresponding ΔPf at each of the measured flow rates for each experiment to clarify how the slurry rheology affected the transmissivity of the constant-permeability fracture (Fig. 5.6). Despite significant differences in the behavior of the time series of the two experiments, plots of Qout versus ΔPf are surprisingly similar for both experiments. Most notably, results from both experiments suggest a yield stress ∼0.05 psi (or a positive ΔPf that must be exceeded to initiate flow) as Qout → 0. Also, after the flow rate had been reduced to near zero and then increased, the two experiments exhibited significantly different behaviors. This observation emphasizes the potential for hysteretic behavior in flows of high-concentration slurries.
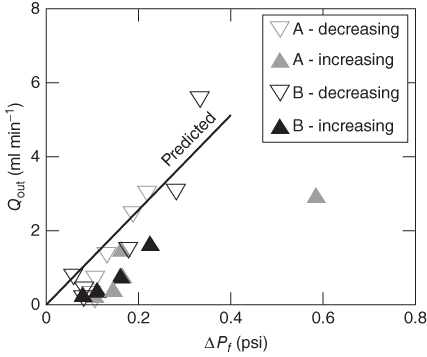
Fig. 5.6 Volumetric flow rate through the fracture (Qout) plotted against differential pressure (ΔPf) for the full range of measured flow rates for both experiments.
In addition to the fracture-scale observations of Qout and ΔPf, PIV analysis of sequential pairs of images provided discrete measurements of the velocity field within the fracture. Averaging sequential velocity fields, measured during a period when the observed flow rate was approximately constant, provided a relatively noise-free measure of velocity throughout the fracture at each flow rate. Figure 5.7 shows a representative subset of these solid velocity fields for both experiments. During Experiment A at early time, the flow field was nearly one-dimensional, with the slightly surprising result that the highest velocities occurred along the no-flow boundaries (top and bottom of each frame in Fig. 5.7), where one typically expects fluid velocity to be the lowest due to no-slip conditions on the boundaries. However, at later time, the flow field became more complex with a large region near the outflow boundary with zero velocity and a smaller region near the inlet boundary with near-zero velocity. When the flow rate returned to 1.5 ml min−1 (last frame at bottom), the inlet region returned to a similar configuration to the earlier measurement at the same flow rate (second frame from top) but the outlet region remained jammed. This hysteretic response was a direct manifestation of the geometry of the boundaries and helps explain the difference in pressure response to decreasing (down triangles) and increasing (upright triangles) flow rates observed in Figure 5.6. The outlet manifold was much larger than the fracture aperture, such that pressure losses within the manifold were relatively small compared with those in the fracture. However, the flow geometry caused a stagnation point at the middle of the manifold, which led to the development of the zero velocity region when shear rate decreased. The resulting jamming of the solids was not immediately reversible when flow rate was subsequently increased.
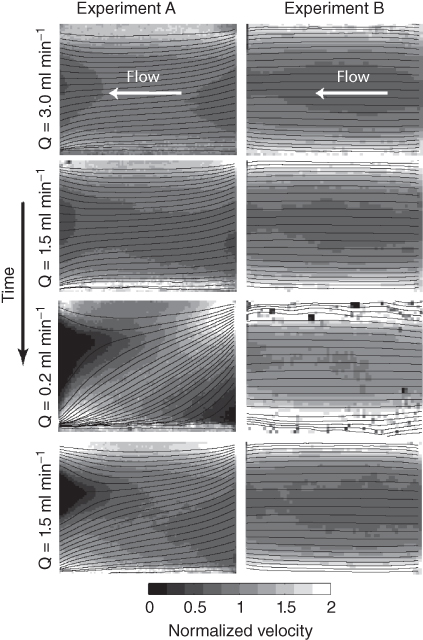
Fig. 5.7 Normalized velocity fields measured over the entire fracture for a subset of the flow rates for Experiments A and B superimposed with the corresponding streamlines. The velocity fields are normalized by the depth-averaged velocity (V = Qout/W ⟨h⟩), during each step to facilitate the comparison of velocity fields and profiles at different flow rates. A jammed (∼zero velocity) region developed in Experiment A. High-velocity regions/bands are observed in both experiments near the no-flow (top and bottom) boundaries. See the included supplemental material for animations detailing the evolution of the velocity field for both experiments.
By contrast, the inlet and outlet boundaries for Experiment B precluded a stagnation point within the flow system. The resulting flow field remained nearly one-dimensional throughout the duration of the experiment. Furthermore, because no jamming occurred, there was no evidence of hysteresis in the relationship between flow rate and differential pressure. However, as with Experiment A, the highest velocities occurred along the no-flow boundaries, which was, again, not expected.
Figure 5.8 shows a representative subset of average velocity profiles ( , where Vx is the component of the velocity in the x or flow direction) normalized by the mean velocity (
 ). These normalized velocity profiles provide a more quantitative measure of the velocity distributions observed during Experiment B. The magnitude of the high-velocity channels along the edges of the fracture increases relative to ⟨V⟩ as the flow rate decreases. In addition, at the lowest flow rate, the velocity in the center region of the fracture also increases relative to ⟨V⟩. This behavior likely reflects a change in the distribution of solids across the aperture at the lowest flow rate. Because our experimental system does not measure velocity distributions across the fracture aperture, the source of this shift in measured velocities from the expected mean velocity is unclear. However, the process is readily reversible when the flow rate increases and the velocity profile at 1.5 ml min−1 is almost identical to that measured during the decreasing steps.
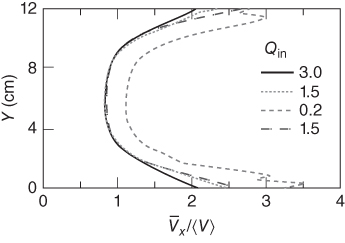
Fig. 5.8 Normalized velocity profiles corresponding to the velocity fields shown in Figure 5.7. These are average profiles (over the fracture length) measured perpendicular to the flow direction. The velocity near the no-flow boundaries is approximately twice the velocity in the middle of the fracture.
Computational simulations
In this section, we present results from simulations of flow through the fracture to test possible explanations for the strong velocity heterogeneities observed within the uniform-aperture fracture.
Flow of a homogeneous suspension in a Newtonian fluid
We used the rheological model developed by Lecampion & Garagash (2014) to predict the flow of concentrated suspensions. They considered the rheology of monodisperse solids suspended in a Newtonian carrier fluid. Their model reproduces experimentally observed rheologies over the entire range 0 < φ < φcr by combining an effective pressure-dependent yield stress (typical of granular media) with hydrodynamic stresses. Although they present a general model for developing pressure-driven flow, we use their simpler result for fully developed flow between parallel plates, which allows the depth integration (across the fracture aperture) of the momentum equation. In this limit, they demonstrated that the cubic law (e.g., Witherspoon et al. 1980)
predicts the total flow rate, Q, between horizontal parallel plates, where μ is the apparent viscosity of the slurry, h is the aperture, W is the width, L is the length of the fracture, and ΔP is the total pressure differential measured across the length of the fracture. The total pressure, P = Pf + Ps, includes contributions from the pressure acting on the fluid and solid, respectively, but for the relatively free-flowing conditions considered in our experiments, we expect Ps to be small such that P ≈ Pf. Figure 5.9 plots the unique relationship between μ/μf and φ developed by Lecampion & Garagash (2014) and used in our simulations. Note that this relationship assumes a Newtonian carrier fluid.
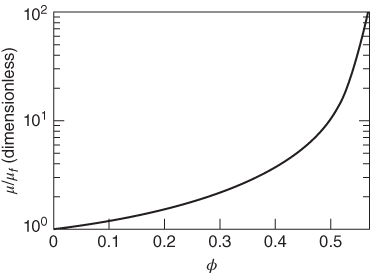
Fig. 5.9 The apparent Newtonian viscosity, μ, of fully developed slurry flow between two plates can be predicted given the Newtonian viscosity (μf) of the carrier fluid and the solid concentration (φ) of the slurry (Lecampion & Garagash 2014).
The measurements of carrier-fluid rheology in Figure 5.3 demonstrate that our carrier fluid was non-Newtonian, except at the lowest shear rates. To determine the appropriate effective viscosity to use in our model, we must determine a shear rate that is representative of the experimental conditions. The characteristic shear rate,  , of the fluid between the plates will scale with

For our experiments, W  10 cm, h
  0.3 cm, and the flow rate varied from 0.2 to 3.0 ml min−1. The highest of these flow rates corresponds to
  0.05 s–1. Consequently, for our experiments, at all flow rates,
  was below the lowest measured shear rate in Figure 5.3, and we can assume that the guar-based carrier fluid was within its Newtonian regime with μf
  8 Pa s.
A homogeneous slurry, with φ = 0.5, flowing between two plates with Newtonian carrier fluid μf  8 Pa s results in a slurry with M
  84.3 Pa s (Fig. 5.9). Figure 5.6 compares experimental observations with the model predictions of ΔPf for the measured range of Qout. The predictions are in excellent agreement with the experimental results for decreasing flow rate (down triangles) for both Experiments A and B. However, the experimental results show evidence of a yield stress ∼0.05 psi (i.e., a nonzero pressure differential when the flow rate approaches zero), which is not predicted by the model.
While we are able to obtain good agreement for the relationship between Qout and ΔPf, the experimental results indicate significant variations in the velocity field within the fracture. In the following sections, we present an approach for capturing the details of a heterogeneous flow field that explains the experimentally observed flow structure.
Flow of a heterogeneous suspension
In this section, we describe our approach for simulating the flow of variable solid-concentration fluid within a fracture, which uses a Lagrangian particle-based approach for tracking the solid concentration within the fracture. We approximate the potentially three-dimensional geometry of the fracture with a two-dimensional array of locations where the local fracture aperture, h(x,y) is known

where Δx is the size of the Cartesian cells and x and y are coordinates lying in the midplane of the fracture (Fig. 5.10). Within each cell, we relate pressure gradient and slurry flow rate by assuming locally fully developed flow between the plates, which avoids the need to discretize between the fracture surfaces. This reduction from three-dimensional aperture space to a two-dimensional approximation significantly simplifies the solution of the resulting system of equations.
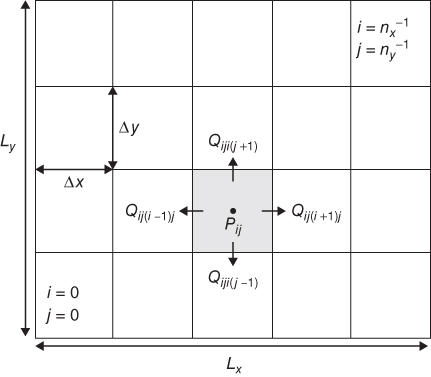
Fig. 5.10 The regular cell structure employed by the width-averaged flow solver. The domain Ωij of cell ij is highlighted in gray. The pressure, Pij, is cell centered, while fluxes into neighboring elements are face centered.
There are many options for tracking the interface between multiple phases (see Kothe & Rider (1995) for a review) including high-order advection (Alves et al. 2003), interface reconstruction (Youngs 1984), level sets (Sussman et al. 1994), and particle-based methods (Morris & Monaghan 1997; Monaghan 2012). We use Lagrangian particles that naturally track fluid-history-dependent variables (φ, time since injection, etc.) in a frame of reference tied to the fluid itself, which minimizes advection errors (Monaghan 2012). This method also makes it possible to track the evolution of variations in φ due to carrier-fluid loss into the matrix. Our approach resembles particle-in-cell (PIC) methods used for fluid dynamics simulations (Harlow et al. 1964) where Lagrangian marker particles representing parcels of fluid are placed throughout the computational domain. The particles carry information such as μf and φ for a given fluid parcel. At injector locations, source terms are introduced into the flow equations and Lagrangian marker particles are injected with the appropriate volume fractions of the components being injected at that time. Within each time step of length Δt, the Lagrangian particles contribute to the volume fractions of the various components within the Cartesian cell in which they are located. For example, φij, the solid concentration in cell i, j, can be estimated using a volume-weighted average across the particles present within the cell:
where Ωij is the region occupied by cell i, j (highlighted in gray in Fig. 5.10):

and Uα is the volume of the parcel of fluid tracked by particle α and φα is the solid concentration of the parcel of fluid tracked by particle α. Equation (5.6) provides solid concentrations, φij, at all points on the grid for each time step. Combining these values of φij with the relationship plotted in Figure 5.9 provides calculations of the effective slurry viscosity, μij within each cell.
Using Equation (5.3), we relate the flow rate Qijkl from cell i, j into cell k, l to the geometry and differential pressure between the two cells:

where hijkl and μijkl are the aperture and effective slurry viscosity averaged between cell i, j and cell k, l. We can now assemble a set of linear equations to be solved for the unknown pressures, Pij, by considering the total flux into each cell from its neighbors (see Fig. 5.10):

where qij is the local injection (positive) or withdrawal rate (negative) of fluid from cell i, j. In addition, depending on the flow geometry considered, there will be a number of cells with prescribed pressure according to applied pressure boundary conditions. The new flow field can then be used to update the location of all Lagrangian particles within the fracture. For example, if particle α occupies cell i, j, its change in position, Δxα Δyα is given by

where vxij, vyij are the current velocity components in cell i, j and Δt is the discrete time step used for integration. At this point, the model updates other history-dependent variables such as the solid concentration at each particle due to the rate of local carrier-fluid loss to the matrix. Although in our experiments there was no loss of carrier fluid into the matrix, this is not necessarily the case for natural systems, either because the fracture walls are not impermeable or because small fissures may take some fluid.
For simplicity, we have presented the equations for the case where buoyancy effects are neglected (horizontal fracture). This is sufficient for this study where gravity is acting perpendicular to the plane of the fracture and the timescale for settling of solids is considerably longer than the residence time of the slurry in the fracture. We have also implemented the more general case that accounts for potential slumping of denser fluids.
Simulations of heterogeneous flow in a fracture
Both experiments developed nonuniform flow fields, despite the homogeneous composition of the injected fluid (Fig. 5.7). In the case of Experiment A, clear stagnant zones developed at the lowest flow rates. However, both experiments clearly exhibited high-velocity zones along the edges of the fracture. In the case of Experiment B, these features were present and stable at all injection rates. In this section, we investigate what mechanisms might explain the development and stability of such high-velocity channels within the fracture. Using the numerical model described in the previous section, we consider the following possible sources of velocity-field heterogeneity within the fracture: (i) aperture variability; (ii) blockages in the manifold at the inlet and outlet; or (iii) heterogeneity of φ within the inlet manifold.
Our aperture-field measurements indicate variations within a few percent of the average at most and generally much less. Such small variations in aperture cannot explain doubling of the fluid velocity. Furthermore, the measured variations in aperture do not correlate with the high-velocity flow channels, thus ruling out the first hypothesis.
Figure 5.11 shows the results from simulations in which we introduced blockages within the upstream and downstream manifolds and assumed a constant-φ slurry throughout the fracture. This simulation captures the details of the velocity field resembling the experiment near the inlet and the outlet. However, the dissipative nature of flow between two plates results in the flow becoming essentially uniform (across the fracture width, W) in the middle of the fracture (Fig. 5.11).

Fig. 5.11 Numerical simulation of fully developed flow of high-solid-volume slurry in an attempt to match the experimentally observed heterogeneities by introducing blockages within the upstream and downstream manifolds through changes to the aperture field (A) while assuming the fluid remains homogeneous. The velocity field (B) and profiles (C) indicate that the flow midway along the fracture is essentially homogeneous due to the dissipative nature of flow within the fracture.
Finally, we considered the possibility that variations in upstream solid concentration can lead to stable heterogeneity in the flow field. This hypothesis assumes that changes induced either within the upstream tubing or within the upstream manifold induce systematic changes in the upstream solid concentration pumped into the fracture. While the precise mechanism controlling this segregation has not been identified, we can investigate the implications for flow within the observed portion of the fracture. For this hypothesis to be plausible, the induced changes should be relatively small. Furthermore, because the velocity distribution for Experiment B was independent of distance from the upstream inlet, the imposed changes in the upstream solid concentration must propagate downstream through the fracture without undergoing significant change.
We performed simulations assuming a prescribed distribution of φ at the upstream end of the fracture corresponding to approximately 2 cm width channels on either side (Fig. 5.12). Our simulations indicate that the imposed changes in the upstream φ values are indeed preserved during flow, leading to sustained variations along the entire length of the fracture, including the outlet manifold (see Fig. 5.12). In addition, our analysis indicates that a reduction of as little as 3% in φ can lead to a factor-of-two increase in velocity within the low-φ channels over that in the higher φ central flow region (see Figs 5.13 and 5.14).

Fig. 5.12 Numerical simulation of fully developed flow of high-solid-volume slurry in the fracture with imposed heterogeneity in φ at the upstream boundary. The gray scale represents the evolving values of φ within the fracture. In this example, we impose φ = 0.47 at the upstream boundary (at right) within high-speed channels of approximately 2 cm width. The central region has φ = 0.515, resulting in φ = 0.5 overall. Our numerical model indicates that prescribed upstream variations in φ will propagate from inlet to outlet in a stable manner.
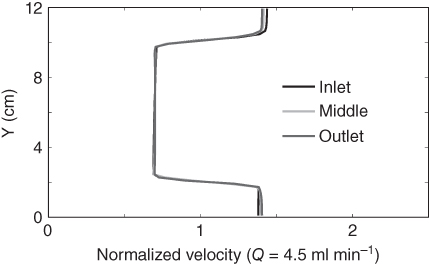
Fig. 5.13 Steady-state velocity profiles corresponding to the heterogeneous-solid-concentration model shown in Fig. 5.12. The model predicts that the slurry velocities are approximately doubled in regions of approximately 2 cm width, which is in good agreement with the experiment (Fig. 5.8)
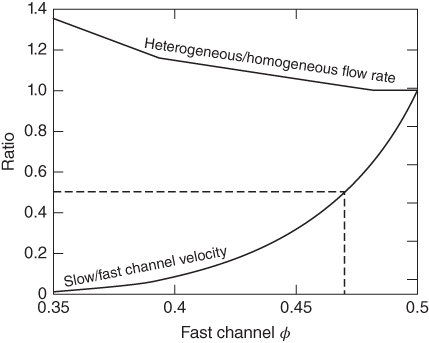
Fig. 5.14 This plot explores the influence of increasing solid-concentration contrast in the fracture on the heterogeneity in the flow field using the same geometry shown in Figure 5.12. The lower curve shows the predicted ratio of the velocity in the central portion of the fracture to the velocity in the two 2-cm-wide low-φ channels. As φ approaches 0.34 in the fast channel, the flow in the central region stagnates. A value of φ = 0.47 approximates the experimental observation of velocity doubling in the fast channel zones (a ratio of 0.5 on this plot). The upper curve shows the ratio of total flow rate in the heterogeneous scenario compared with the flow of a homogeneous solid concentration of 0.5 for the same pressure drop across the fracture. We see that even as the central region stagnates, the total flow rate differs from the homogeneous solution by only tens of percent.
Our simulations show that only the third hypothesis is consistent with the experimental observations. In our experiments, heterogeneity in the solid-concentration field induced within the upstream tubing and/or inlet manifold likely resulted in variations in φ within the fracture. However, in natural and engineered systems, particularly at larger scales, heterogeneities in φ are likely to be prevalent. Our results suggest that even small variations in φ are both stable and sufficient to induce large (factor of 2) velocity variations in flow channels within the fracture. Figure 5.14 explores the relationship between the velocity of the central region and the fast channels as we introduce progressively greater differences between the values of φ in the two regions, while maintaining the same φ0. For the same pressure drop across the fracture, we also calculated the corresponding total flow rate obtained for these heterogeneous scenarios compared with the total flow rate for a homogeneous slurry with φ = 0.5 (upper curve in Fig. 5.14). Even as the velocity ratio between the slow and fast channels approaches zero, the difference from the total flow rate predicted by the homogeneous theory is only tens of percent. We also investigated the effect of varying the width of fast channels assumed to have a solid concentration of 0.47 (Fig. 5.15) upon the flow and confirm that the homogeneous theory predicts a total flow rate in close agreement with the heterogeneous flow field. Even when the fast channels are enlarged to 4 cm and φ → φcr in the central channel (corresponding to 2/3 of the total area of the fracture) the total flow rate predicted for the homogeneous assumption is within 10% of the heterogeneous result. These two sets of simulations indicate that the reduction in flow within the slower central channel has offset the impact of the fast channels on the average flow field. As the central region stagnates, nonlinear effects become stronger and the homogeneous solution becomes less accurate. These results suggest that bulk measurements, such as ΔPf and Qout, provide only weak constraints upon the nature of the flow within the fracture. Specifically, very high-velocity channels may develop within the fracture while the total flow rate changes only slightly. However, other transport properties of the heterogeneous system, such as initial breakthrough of slurry and dispersion, will differ greatly from the homogeneous scenario.
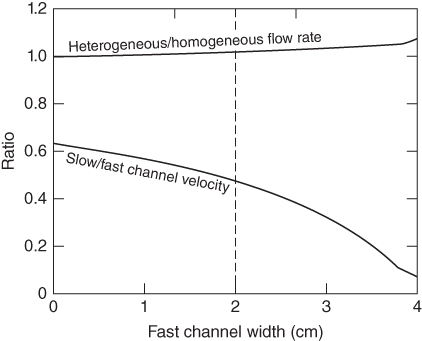
Fig. 5.15 We explore the influence of varying the width of fast channels with φ = 0.47, while maintaining the same average value of φ across the entire fracture using the same geometry as shown in Fig. 5.12. The upper curve shows the predicted ratio of the flow rate in the slower central portion of the fracture to two channels with φ = 0.47. As the width of the fast channels increases, the flow in the central region progressively slows due to increased solid concentration. Also, two channels of width 2 cm approximate the experimental observation of velocity doubling in the fast channel zones (a ratio of 0.5 on this plot). The upper curve shows the ratio of total flow rate in the heterogeneous scenario compared with the flow of a homogeneous solid concentration of 0.5 for the same pressure drop across the fracture. Even as the central region stagnates, the total flow rate is well approximated by the homogeneous solution.
Concluding remarks
We have demonstrated that the experimentally observed relationship between pressure drop and total flow rate through an idealized smooth-walled fracture is predicted well by the cubic law using a recently developed rheological model to represent the effective viscosity of the concentrated slurry. However, our experimental results revealed significant variations in the velocity field within the fracture though the cubic law assumes uniform velocity in the fracture plane. Further analyses demonstrated that small variations (∼3%) in the spatial distribution of φ were sufficient to induce large (factor of 2) velocity variations in channels within the fracture. As φ → φcr, very small changes in φ can result in large differences in the effective viscosity of the slurry and induce both high-velocity channels and immobile or jammed regions. Furthermore, once established, φ heterogeneity and the resulting velocity variations persisted through the length of the fracture; and, once formed, jammed regions persist, even after increasing the shear rate. Finally, while the actual flow within the fracture/fault may be highly heterogeneous, the average pressure drop and total flow rate through the system will remain close to that predicted for homogeneous flow. Consequently, while the assumption of uniform flow may match observations of pressure drop and total flow rates, it may greatly underestimate both the time of breakthrough and degree of dispersion of the slurry transported within the fracture.
In our experiments, the variations in φ that caused velocity-field heterogeneity were induced by upstream boundary conditions, despite efforts to maintain a uniform boundary condition of φ = φ0. In the subsurface, heterogeneity is ubiquitous and the potential for uniform-φ flows to persist in natural or engineered systems seems unlikely. For example, in real fractures, the rock matrix bounding the fracture may have a non-negligible permeability and the resulting loss of fluid to the matrix can cause nonuniform changes in φ. In addition, aperture variability caused by fracture surface roughness leads to velocity-field variability, even in the absence of solids. In the presence of high concentrations of suspended solids, we expect plug-flow behavior similar to that observed in our experiments when the amplitude of the surface roughness is significantly smaller than the fracture aperture. In fractures with regions with apertures that are on the order of the largest particle diameters, the likelihood of jamming will increase, resulting in relationships between flow and pressure gradient that are more difficult to predict than in our experiments.
Acknowledgments
The authors would like to thank Schlumberger for sponsoring this research and Luke Shannon for his assistance with developing the experimental system.
Supporting information
Additional supporting information may be found in the online version of this chapter, Geofluids (2015) 15, p. 24–36:
- Data S1.Animation of the absorbance fields calculated for the two experiments (Exp_A.avi)
- Data S2.Animation of the absorbance fields calculated for the two experiments (Exp_B.avi)

