Chapter 20
Transient permeability in fault stepovers and rapid rates of orogenic gold deposit formation
Steven Micklethwaite1, Arianne Ford1, Walter Witt1 and Heather A. Sheldon2
1Centre for Exploration Targeting, The University of Western Australia, Crawley, WA, Australia; 2Australian Resources Research Centre, Commonwealth Scientific and Industrial Research Organisation (CSIRO), Kensington, WA, Australia
Abstract
Fault stepovers are features where the main trace of a fault steps from one segment to the next in either an underlapping or overlapping manner. Stepovers exert a critical influence on crustal permeability and are known to control phenomena such as migration of hydrocarbons and location of geothermal fields. In the Kalgoorlie–Ora Banda greenstone district, Western Australia, we demonstrate a spatial association between stepovers and gold deposits. It is shown that although underlapping stepover geometries are typically rare in fault systems, they are anomalously associated with gold deposits. Furthermore, the along-strike and across-strike dimensions of both underlapping and overlapping fault stepovers fit, to a first-order approximation, the same self-similar trend. Boundary element modeling of Coulomb failure stress changes is used to explain these observations in terms of damage generated by rupture events on the bounding fault segments and associated aftershock sequences. Our models indicate that a larger region of damage and permeability enhancement is created around underlapping stepovers than around overlapping stepovers. By taking into account both the enhancement and decay of permeability during the seismic cycle, it is estimated that a 5Moz goldfield could feasibly form in 1–16 earthquake–aftershock sequences, potentially representing durations of just 10–8000 years. The existence of supergiant gold deposits is evidence that crustal permeability attains transiently high values in the order of 10−12m2. It should be expected that transient and time-integrated permeability values have a distinct three-dimensional structure in continental crust due to stepover-related channels.
Key words: fluid flow, gold, permeability, scaling, static stress change, stepovers, time-integrated fluid flux
Introduction
In earth materials, permeability is a dynamic and changing parameter that may potentially vary by 5–10 orders of magnitude over short timescales (Ingebritsen & Manning 2010; Micklethwaite et al. 2010; Rowland & Simmons 2012; Miller 2013). Active deformation of faults and shear zones is widely acknowledged as a critical agent for transient enhancement of permeability in the Earth's crust (e.g. Rojstaczer et al. 1995; Claesson et al. 2007). One important outcome is the migration of large volumes of fluid through narrow domains, resulting in the formation of hydrothermal ore deposits (Cox et al. 2001). In particular, fault stepovers have a documented spatial association with the distribution of ore deposits (e.g. Sibson 1987; Connolly & Cosgrove 1999; Ford et al. 2009; Micklethwaite et al. 2010; Witt et al. 2013), which act as a proxy for high time-integrated fluid flux (Sheldon & Micklethwaite 2007). Indeed, fault stepovers are recognised as playing a role in a wide range of fluid-related geological phenomenon, such as post-seismic fluid redistribution (Peltzer et al. 1996), the migration of hydrocarbons (Fossen et al. 2010) and the location of geothermal fields (e.g. Faulds et al. 2011). In this contribution, we provide a systematic examination of the relationship between fault stepovers and ore deposits, to provide insight into a primary control on permeability within continental crust at length scales of tens to thousands of kilometres, integrated over timescales of ore deposit formation (previously estimated at 103 to 105 years; Sanematsu et al. 2006; Rowland & Simmons 2012).
This study combines field observations, analysis and modeling to identify first-order principles controlling gold mineralisation and to obtain estimates for absolute permeability values and their temporal variation. As such, we take the unusual step of presenting the study in three parts, each with a ‘methods’ and ‘results’, with each part building on the last. In the first part, we establish a spatial relationship between fault stepovers and gold mineralisation, using data from the Eastern Goldfields Superterrane (EGS), Western Australia. In the second part of this study, we use accurate deposit-scale maps of stepovers associated with gold deposits from around the world to examine the geometry, aspect ratios and scaling properties of those stepovers. The data are compared against published fault stepover data, documented from non-mineralised, active and inactive fault systems (Aydin & Schultz 1990; Kim et al. 2004). In the third part, the results from the geometric analysis are used to inform 3D boundary element numerical models. Here, we assess the influence of stepover geometries on the shear and normal stress changes that occur during earthquake or fault creep events and the implications these have for fracturing. Finally, we review and discuss our results in terms of transient enhancement of permeability through the Earth's crust and the profound implications they have for time-integrated fluid fluxes.
Association between stepovers and mineralisation
Methods
Ad hoc observations of ore deposits from many different mineral provinces suggest that there is a spatial association between deposits and stepovers on adjacent shear zones or faults (e.g. Hagemann et al. 1992; Garza et al. 2001; Richards 2003; Weinberg et al. 2004; Bateman et al. 2008), although this relationship has never been quantitatively measured. We first establish whether this association has a statistical significance by an assessment of the proximity of ore deposits to stepovers.
It should be noted that the term stepover is not common in economic geology literature but subtypes of stepovers, such as jogs, pull-aparts or relay zones, are routinely referred to and all these features are classified as stepovers in this study. In two dimensions, stepover zones may or may not be linked (hard and soft linkages, respectively) but adjacent segments kinematically interact with one another (Soliva & Benedicto 2004) and sometimes merge into a single fault surface in three dimensions (Walsh et al. 2003).
Fault map data from the Kalgoorlie–Ora Banda district of the EGS, Yilgarn Craton, Australia (Fig. 20.1), were analysed using unpublished digital files from the Geological Survey of Western Australia (representing faults at the 1:100,000 scale), combined with 1:10,000 scale structural maps from a database originally derived by the exploration company AurionGold Ltd (Witt et al. 2013). The data set comprises thousands of individual fault segments, and stepovers were automatically identified with the geographic information system package Maplnfo™. Deposit locations were derived from MINE-DEX (the web URL for this data source is provided in the references).
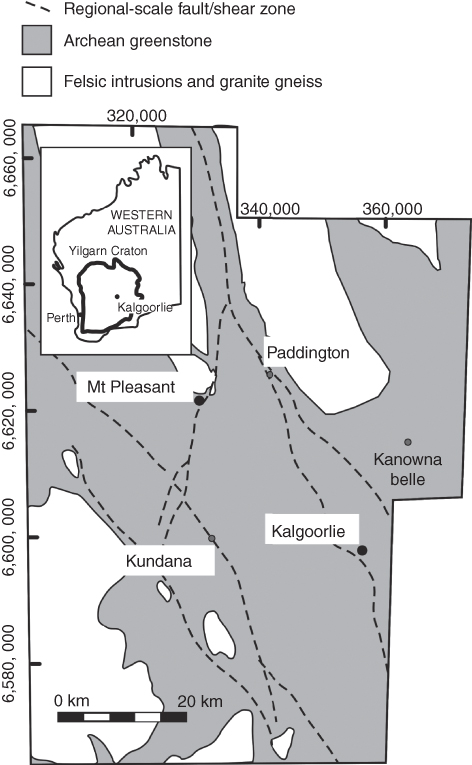
Fig. 20.1 Simplified map showing the dimensions and location of the Ora Banda–Kalgoorlie district, Western Australia. Inset shows the location of the district within the Yilgarn Craton. Included are the locations of selected major gold deposits present in the data set. Deposits labelled in grey and black are part of the data set used for the spatial analysis in the first part of this study. A map of the full data set is available as Supporting Information (Fig. S1). Deposits labelled in black have map data of high enough quality to be incorporated in the scaling and geometry analysis (second part of this study). Australian grid GDA94.
Fault stepovers were identified using the geometries summarised in Figure 20.2. Specifically, the parameters used to define the stepovers included the following: the maximum separation or width (2s) between adjacent fault segments was 2500 m; the maximum underlap/overlap distance (2λ) was 2500 to −2500 m; the allowable deviation in angle (α) linking two segments relative to the normal to the strike of the regional structure was 5°–45°. The process automatically identified 2656 stepovers within the district (see Fig. S1 in Supporting Information). Following the identification of stepovers, the number of deposits within a given buffer distance (radius) of the stepovers was measured in successive increments. Buffer distances were concentric around the centroid point of each stepover (e.g. Fig. 20.2C). Buffer distances began at 100 and 250 m and then increased in 250 m increments up to a buffer distance of 1 km. Beyond 1 km, buffer distances were incremented at every kilometre. This process of defining successive buffer distances was based on the examination of statistical measures derived during analysis of data in the Yilgarn (Witt et al. 2013). In this manner, the spatial relationship between deposits and stepovers was quantified per square kilometre.
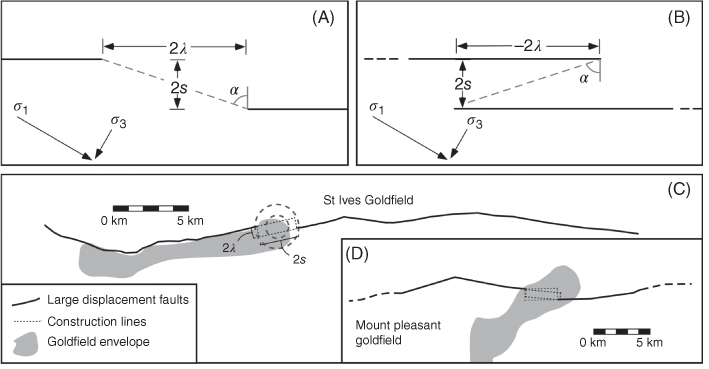
Fig. 20.2 Stepover geometries used for both the GIS-based spatial analysis and the geometric scaling analysis. Parameters explained in text. (A) Underlapping fault stepover, with positive along-strike distance (2λ). (B) Overlapping fault stepover, with negative along-strike distance (−2λ). (C,D) Examples of stepovers associated with orogenic-type gold mineralisation from the Kalgoorlie greenstone terrain. Two sets of construction lines for the geometric scaling analysis are given for the Mount Pleasant example, due to different strikes of the fault segments either side of the stepover. Concentric circles in the St Ives example are a schematic representation of the buffer distances used in the spatial analysis at distances of 1000 and 2000 m.
There are two main limitations to the analysis presented here. First, results are dependent on the quality of the original structural data. Although outcrop is poor, the structural data sets are considered reliable because they are derived from multiple approaches (field mapping, interpretation of potential field data and direct drill core sampling) and multiple sources (industry and Geological Survey of Western Australia). Second, the analysis does not take into account the size of deposit (endowment) but is a statistical measure of the proximity of deposits to a stepover. For example, a result of 2.5 deposits km−2 with a 100 m buffer is a measure of the average density of deposits within that buffer distance. Additional statistics that take into account endowment are presented in Witt et al. (2013). A map of the district documenting faults, deposits, endowments, stepovers and buffers is available in Figure S1, in the Supporting Information to this study.
Results
Results (Fig. 20.3) are presented in terms of (i) the number of deposits per square kilometre relative to stepovers and (ii) a normalised ratio of observed (O) to expected (E) deposits relative to stepovers (e.g. O–E/E, where E is the number of deposits expected within a buffer region if deposits are randomly distributed). Values of O–E/E > 1 indicate a positive relationship between the location of stepovers and deposits.
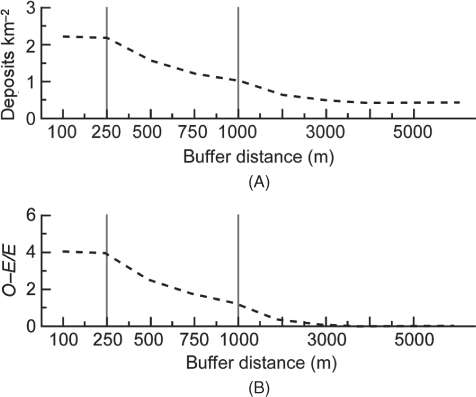
Fig. 20.3 Evidence for a strong spatial relationship between gold deposits and fault stepovers, Kalgoorlie–Ora Banda district. (A) Stepover curves for deposit density relative to distance from the stepover. (B) Ratio of observed (O) to expected (E) deposits relative to stepovers. Values of O–E/E > 1 indicate a positive correlation between the location of stepovers and deposits. Grey vertical lines mark changes in the scale of the horizontal axis, for ease of visualising the results.
Figure 20.3A demonstrates an increase in the density of gold deposits at distances <3 km from stepovers and that this relationship is statistically significant compared with a random distribution at distances less than ∼1.5 km (Fig. 20.3B). These results indicate a strong positive relationship between the presence of stepovers and the location of gold deposits within the Ora Banda–Kalgoorlie district. The relationship equates to a maximum endowment of 83.8% of the total gold in 30.8% of the area at distances <1 km from stepovers.
Although the absence of gold deposits does not imply the absence of hydrothermal fluid flow, gold deposits are themselves good proxies for hydrothermal fluid flow. Given the spatial association between stepovers and gold deposits, the analysis indicates that, on the scale of a mineralised district (tens of thousands square kilometres), stepovers are important controls on fluid flux through the Earth's continental crust.
Geometry and scaling properties of stepovers
Methods
The geometry and scaling properties of stepovers were investigated following a methodology modified from Aydin & Schultz (1990) and data from fault systems mostly dominated by strike-slip movement. In the first instance, data were compiled from stepover studies of active fault systems (Aydin & Schultz 1990) and inactive but well-exposed fault systems (e.g. Kim et al. 2004). These data are used as a control population for comparison against data compiled from well-constrained structural maps of ore camps (e.g. Fig. 20.2C,D; Table 20.1). The sample size is necessarily small as high-quality structural maps of gold camps associated with stepovers are rare in the published literature. The data used in this geometric analysis of mineralised stepovers comprise goldfields from the Kalgoorlie–Ora Banda domain (orogenic-type deposits) and also the North Carlin Trend, Nevada (Carlin-type deposits), and a porphyry deposit, Chile, which is associated with a strike-slip fault (Garza et al. 2001).
Table 20.1 Dimensions of well-constrained fault stepovers associated with gold camps
| Deposit | Country | Along-strike separation, 2λ (m) | Across-strike separation, 2s (m) | Stepover type | Reference |
| Mt Pleasant 1 | Australia | 2369 | 822 | u, rel. | Micklethwaite et al. (2010) |
| Mt Pleasant 2 | Australia | 3071 | 823 | u, rel. | Micklethwaite et al. (2010) |
| New Celebration | Australia | 6310 | 380 | u | Based on propriety industry data from SM's files |
| Golden Mile | Australia | 4400 | 1550 | u | Based on propriety industry data from SM's files |
| St Ives | Australia | 2460 | 700 | u, restr. | Micklethwaite et al. (2010) |
| North Carlin 1 | USA | 2311 | 536 | u | Thompson et al. (2002) |
| North Carlin 2 | USA | 2487 | 986 | u | Thompson et al. (2002) |
| Escondida | Chile | 9521 | 2419 | u, rel. | Garza et al. (2001) |
All the stepovers examined in this study are underlapping (u) but a mixture of both releasing (rel.) or restraining (restr.) modes.
The domain between interacting fault segments was quantified by the modified aspect ratio (R) of the along-strike (2λ) and across-strike separation (2s) between the tips of the segments. The aspect ratio here is modified from previous conventions (e.g. Aydin & Schultz 1990; Acocella et al. 2000; Gürbüz 2010; Long & Imber 2011) in that underlap configurations have positive values and overlap configurations have negative values, as indicated in Figure 20.2.
Three problems affect the quality of the results when quantifying the geometric properties of stepovers:
- Ore fields are typically poorly exposed such that interpretations are affected by an incomplete understanding of structural relationships and are dependent on drill core and geophysical imaging. As a result, a survey of stepovers associated with ore fields is subject to small population statistics due to the limited number of published studies with sufficient quality.
- Maps of non-mineralised fault systems, used as the control population, vary in accuracy and scale. The data sourced in this study were from high-resolution maps (e.g. Kim et al. 2004) and subject to strict quality control (e.g. Aydin & Schultz 1990).
- A degree of ambiguity is introduced during analysis due to the non-parallelism of adjacent fault segments. For example, the strike of fault segments on either side of a stepover may show small differences in orientation. In these cases, more than one length (2λ) and width (2s) measures were taken from the stepovers, determined by the orientation of each fault tip (e.g. Fig. 20.2D). Measurements are straightforward for fault traces that are parallel (e.g. Fig. 20.2C).
Results
Several key results emerge from the geometric analysis of the field data. (i) For any given fault system, overlapping stepover geometries dominate, with releasing stepovers being the most common. (ii) However, the mineralised stepovers are anomalously associated with underlap stepover configurations (Fig. 20.4A). (iii) The overlapping stepover configurations follow a linear trend over several orders of magnitude. When directly compared with these overlapping geometries, mineralised underlapping stepovers fit the same trend (Fig. 20.4B). (iv) The aspect ratio of the mineralised underlapping stepovers is approximately 3:1 (a modified aspect ratio value of R = −3), which matches that for overlapping stepovers. Whether a stepover is restraining or releasing does not appear to affect the aspect ratio.
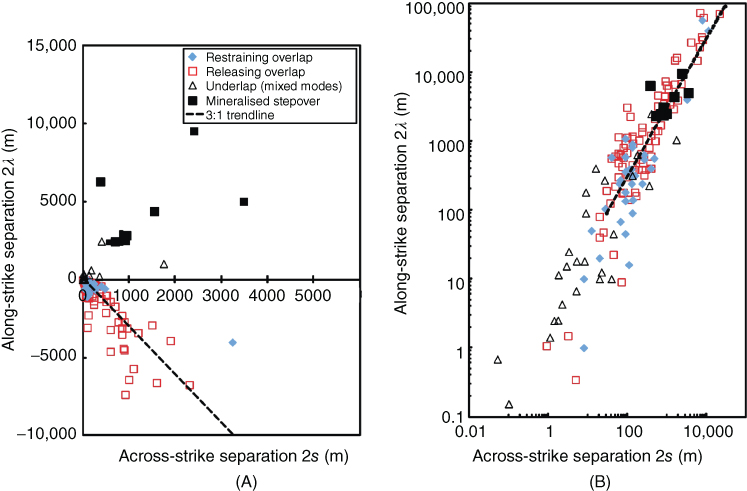
Fig. 20.4 Comparison of along-strike (2λ) versus across-strike (2s) separation between mineralised stepovers and examples from well-constrained strike-slip fault data (Aydin & Schultz 1990; Kim et al. 2004). (A) 2λ versus 2s demonstrating that mineralised stepovers investigated were all underlapping (positive R) in contrast to the majority of data (negative R). The mineralised stepovers for the most part had larger dimensions than other underlapping stepovers previously measured. (B) log 2λ versus log 2s. When compared directly with one another, underlapping mineralised stepovers maintain an aspect ratio ∼3:1, similar to their overlapping counterparts (for along-strike dimensions >100 m). Restraining or releasing overstep data show no appreciable difference in geometry and scaling properties. For the sake of brevity, the releasing or restraining modes of underlapping stepovers are not distinguished. (See color plate section for the color representation of this figure.)
These observations raise the issue of whether there is something special about underlapping fault stepover geometries in particular, which are conducive for the enhancement of crustal permeability in relatively localised zones.
Numerical analysis of the relationship between stepover geometry and fault damage
Methods
The field data show a multi-scale, linear trend for stepover aspect ratios, which is one that is well documented for non-mineralised fault systems (e.g. Aydin & Schultz 1990; Soliva & Benedicto 2004; Long & Imber 2011). Fault systems are also dominated by overlapping stepover configurations (Aydin & Schultz 1990; Acocella et al. 2000). For pull-apart basins between strike-slip fault segments, typical geometries are overlapping with an aspect ratio of 3:1 (Gürbüz 2010), for example R ≈ –3 in this study. For relay zones in normal fault systems, geometries are also overlapping with R ≈ –4.2 (Long & Imber 2011). Linear elastic fracture mechanics provides a mechanical rationale, suggesting that linked overlap fault configurations are a natural outcome arising from interaction between two propagating fault segments, over geological time (e.g. Aydin & Schultz 1990; Burgmann & Pollard 1994; Willemse 1997), and that stepovers should evolve from underlapping geometries to overlapping ones.
We recognise that stepovers from gold mineralised districts have, in our examples, the unusual characteristic of being underlapping. In this section, we use these results to inform boundary element modeling of fault slip events, in order to better understand how fault systems transiently generate permeability and explain the observed relationship between underlapping geometries and mineralisation.
We use the boundary element code COULOMB 3 to simulate three-dimensional deformation around two fault segments, according to the configurations in Figure 20.5. In particular, we test for Coulomb failure stress changes (Δσf) in and around fault stepovers arising from fault rupture events or creep. The methodology is fully described in King et al. (1994a) and only briefly outlined here. The faults are planar and discretised using rectangular elements (e.g. Fig. 20.5A). The mean slip (0.4 m) is appropriate to fault rupture events on 10-km-long segments (Wells & Coppersmith 1994) and corresponds roughly to an M6 earthquake. We prescribe tapered slip distributions that match compilations of earthquake data (Manighetti et al. 2005), which are triangular and asymmetric, with a maximum slip on each segment at ∼30% of the distance from the stepovers. Micklethwaite & Cox (2006) previously calculated Δσf for two orogenic gold camps associated with stepovers and showed that Δσf was an excellent proxy for mineralisation as opposed to mean stress (e.g. Connolly & Cosgrove 1999), because it maps regions where damage was triggered by static stress changes following ancient fault rupture or creep events.
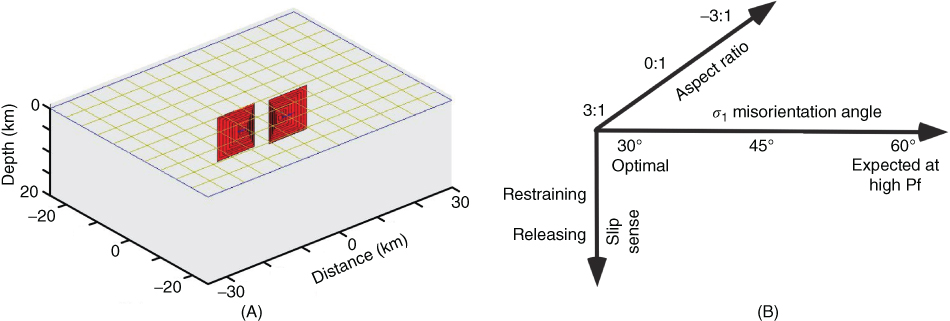
Fig. 20.5 (A) Example model of the three-dimensional boundary element modeling configuration. In this case, two underlapping fault segments are shown with aspect ratio R = 3 and a tapered slip distribution with maximum slip ∼30% of the strike length from the stepover. (B) A 3-3-2 matrix of parameters was investigated to understand the impact of stepover geometry on Δσf, including the orientation of maximum principal stress (σ1) relative to the fault strike. In some cases, we also ran additional models with aspect ratio R = 1. (See color plate section for the color representation of this figure.)
We test the impact of changes in stepover geometry on Δσf and achieve this by varying a number of parameters (Fig. 20.5B). Both releasing and restraining stepovers are examined and geometries are systematically altered from underlapping, to neutral, to overlapping. The data from stepovers associated with gold mineralisation are presently too small to quantify their aspect ratio with any statistical significance. However, the data are consistent with the 3:1 trend for strike-slip fault systems (e.g. Fig. 20.4B) defined by Gürbüz (2010), indicating that underlapping stepovers may be self-similar to a first-order approximation. On this basis, we choose to test stepover geometries that have aspect ratio values of R = −3, 0, 3. In some cases, we tested additional stepover geometries with aspect ratio values of R = 1. Boundary stress conditions are such that the angle between the maximum principal stress and the faults vary in different models between (i) 30° for conditions where faults are optimally oriented for failure, (ii) 45° for conditions at the upper limits of where poroelastic changes may drive fault failure (Micklethwaite 2008) and (iii) 60° for conditions at high fluid pressures (Sibson et al. 1988; Cox et al. 2001; Sibson 2007; Micklethwaite 2008).
In addition, one important feature of A calculations is that they can be performed for faults of a chosen orientation and rake. This functionality allowed stress changes to be calculated to test for activation of adjacent damage zone structures with reverse, normal and strike-slip fault characteristics, depending on whether the model was a releasing or restraining stepover.
Results
We investigated a broad range of models, and selected results are presented in Figures 20.6–20.8. Figure 20.6 highlights the influence of stepover mode (restraining or releasing) on damage zone distribution, relative to stepover geometry. Figure 20.7 reproduces the results of Figure 20.6B to demonstrate the influence of variations in the orientation of the maximum principal stress.
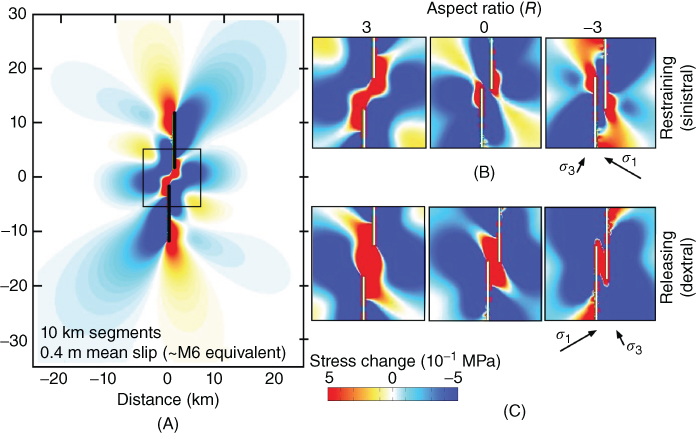
Fig. 20.6 Horizontal distributions of change in Coulomb failure stress (Δσf) for two models, with stepover geometries varying from underlapping, to neutral, to overlapping (modified aspect ratios of R = 3, 0, −3). The remote maximum and minimum principal stresses are σ1 and σ3, respectively, with σ1 = 60° relative to fault strike, representative of mineralised systems affected by high fluid pressures (e.g. Sibson et al. 1988; Cox et al. 2001; Micklethwaite 2008). In both cases, Δσf is calculated for triggering of strike-slip faults. (A) Results for an underlapping, restraining stepover. Subsequent stresses are sampled from the more restricted domain shown around the stepover. (B) Model 1 – restraining stepovers (sinistral fault slip). (C) Model 2 – releasing stepovers (dextral fault slip). In Models 1 and 2, underlapping geometries have significantly larger areas of positive Δσf, relative to neutral and overlapping geometries. (See color plate section for the color representation of this figure.)
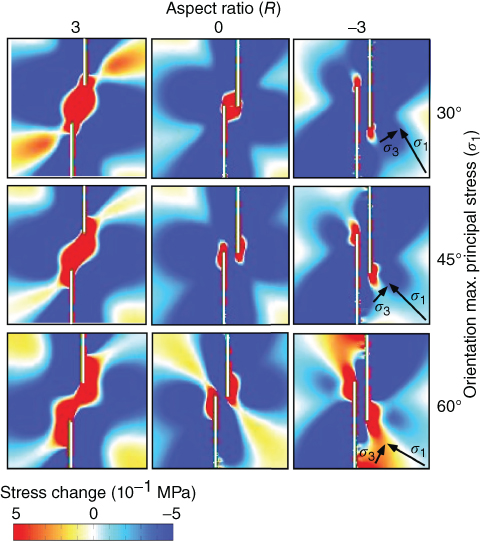
Fig. 20.7 The impact of stepover geometry (modified aspect ratios of R = 3, 0, −3) on Δσf, under conditions of varying remote stress orientation. The remote maximum and minimum principal stresses are σ1 and σ3, respectively. In the examples shown, all models are for restraining stepovers. (See color plate section for the color representation of this figure.)
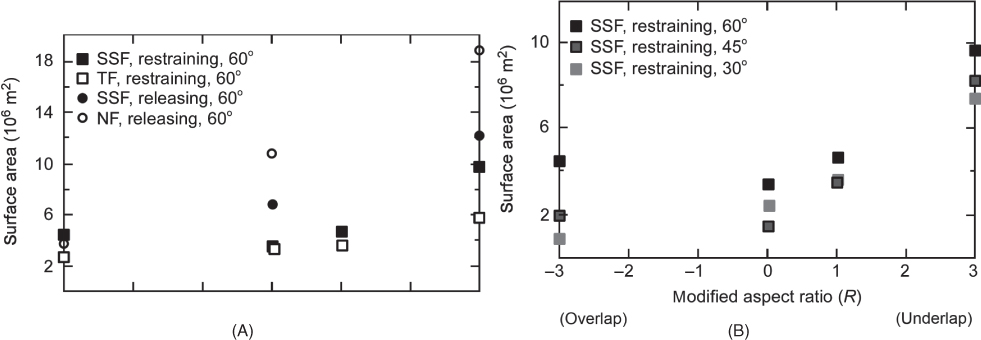
Fig. 20.8 Areas of positive Δσf relative to stepover geometry. In each case, underlapping geometries of R = 3 potentially trigger damage over an area that is an order of magnitude greater than neutral or overlapping geometries. Results were derived from models where Δσf was calculated for the triggering of strike-slip (SSF), normal (NF) and thrust faults (TF). Areas were measured for stepover stresses directly connected to each stepover at Δσf > 4 × 10⁻¹ MPa. (A) Comparison between restraining and releasing stepovers, respectively, under uniform remote principal stress (60°). (B) Influence of changes in the orientation of the remote principal stress for a restraining stepover at different aspect ratios.
The most critical result to emerge is that the area of positive stress change differs dramatically between underlap and overlap configurations. Underlapping stepovers are able to generate positive stress changes over areas that are one order of magnitude greater in size relative to overlapping stepovers, irrespective of slip sense or orientation of the remote principal stress. Therefore, consistent with our field observations, underlapping stepovers may favour mineralisation because they have the ability to generate static stress–triggered damage and permeability enhancement over a larger area than other stepover geometries. The results also show that releasing stepovers tend to generate Δσf over greater areas than restraining stepovers (Figs 20.6B,C, 20.8A). Similarly, larger areas of positive Δσf are associated with large angles of misorientation of the maximum principal stress (σ1), relative to the strike of the fault segments (Figs 20.7, 20.8B). This result is important, because fault systems associated with orogenic gold mineralisation are typically misoriented due to high fluid pressures and are therefore likely to develop larger regions of damage around stepovers. Figure 20.8A also indicates that damage zone faults of normal dip-slip characteristics can be triggered over even larger surface areas around underlapping releasing stepovers, although strike-slip damage zone faults are expected to dominate in strike-slip systems. In all the underlapping models, positive stress changes are not confined to the domain between fault segments but have a footprint that includes the rocks surrounding the fault stepover.
Discussion
In this study, we have reviewed the relationship between fault stepovers and gold mineralisation as a proxy for fluid flux in the Earth's crust. It has been demonstrated that stepovers have a positive relationship with the distribution of orogenic gold deposits over tens of thousands of square kilometres. Careful studies of fault stepovers, from well-constrained goldfields, indicate that such stepovers have the unusual characteristic of being underlapping. We have shown, using boundary element modeling of static stress changes, that the underlapping nature of fault stepovers associated with gold mineralisation can be understood when damage development around stepovers (and therefore permeability enhancement) is linked to earthquake or creep events and the seismic cycle. Indeed, linkages between gold mineralisation and seismogenic processes have been demonstrated in many independent studies (Sibson 1987; Sibson et al. 1988; Robert et al. 1995; Cox et al. 2001). We conclude that stepovers are critical ‘channels’ for the communication of fluid between crustal reservoirs at the plate scale, acting as zones of high time-integrated fluid flux, and that underlapping stepovers may be particularly important because of their ability to enhance permeability over larger volumes during fault slip events.
The connection between mineralisation and the seismic cycle is a crucial one because it links two competing processes that relate to the concept of ‘dynamic permeability’ (Cathles & Adams 2005). Earthquakes or creep events trigger aftershocks or related seismicity that clearly enhance permeability (Miller 2013), but it is also well understood that hydrothermal fluids have a significant impact in healing a system, leading to permeability decay. Permeability decay can be very rapid, as evidenced by hydrothermal deformation experiments (Kay et al. 2006; Tenthorey & Fitz Gerald 2006; Giger et al. 2007), post-seismic monitoring of groundwater geochemistry (Rojstaczer et al. 1995; Claesson et al. 2007) and observations of changing seismic wave speeds around recently ruptured faults (Tadokoro & Ando 2002; Hiramatsu et al. 2005). Individual faults may heal in as little as 2–3 years but aftershock sequences around large earthquakes continue for at least a decade (Rolandone et al. 2004), potentially maintaining permeability for that period. Kitagawa et al. (2007) found that permeability decay lasted for a minimum of a 6-year period following the 1995 Hyogoken-Nanbu M7.3 earthquake on the Nojima fault zone, while Vidale & Li (2003) used changes in seismic wave speed around the Landers fault to infer healing over ∼10 years.
Given that fault systems heal rapidly, we estimate here the time-integrated fluid fluxes possible through damage zones developed in and around underlapping stepovers during a seismic cycle (i.e. involving transient enhancement then decay of permeability). The results are compared with the fluid volumes required to form the range of gold deposit sizes observed in regions such as the Kalgoorlie Terrane from Western Australia. On this basis, conclusions are drawn on the transient permeabilities that are necessary to form such gold deposits.
Fluid flux in stepovers
We estimate the time-integrated fluid flux through a fault stepover by assuming that fluid flow is governed by Darcy's law. In the case of underlapping stepovers in regional-scale strike-slip fault systems, the fluid pressure gradient is vertical and close to lithostatic, such that fluid flow is also vertical. The vertical fluid flux is given by
where k is permeability (m2), μ is fluid viscosity (Pa s), P is fluid pressure (Pa), z is the vertical coordinate (m; positive upwards), ρf is fluid density (kg m−3) and g (m s−2) is acceleration due to gravity (Table 20.2). The vertical fluid pressure gradient is equivalent to ρ, g, (where ρs is average density of overlying rock, kg m−3), provided it remains lithostatic throughout the period of flow, which requires a large, well-connected, overpressured fluid reservoir. This assumption is justified because large volumes of potentially aqueous fluid have been geophysically imaged in the mid-crust (e.g. Li et al. 2003), and overpressured fluid reservoirs at depth are known to contribute to earthquake–aftershock seismic sequences (e.g. Miller et al. 2004; Antonioli et al. 2005).
Table 20.2 Parameter values for fluid flux calculations
| Parameter | Value |
| Rock density, ρs | 2800 kg m3 |
| Fluid density, ρf | 1000 kg m3 |
| Fluid viscosity, μ | 0.0005 Pa s |
| Acceleration due to gravity, g | −9.81 m s2 |
Following an earthquake, permeability in the stepover damage zone is assumed to decay exponentially from a seismically enhanced value k0 to a background value k1 over a time period N years, according to the following equation:
where k (m2) is the permeability at time t (s) after the earthquake and r (1/s) is the decay rate, given by
Experimental measurements of the decay rate for pervasive flow through quartz fault gouges under hydrothermal conditions follow the form given in Eqs 20.2 and 20.3 (Giger et al. 2007). Substituting Eq. 20.2 into Eq. 20.1 and integrating with respect to time yields

where Qz (m3/m2) is the time-integrated vertical fluid flux through the stepover damage zone between t = 0 and t = t1. For this analysis, Qz is calculated for the period N years (i.e. with t1 = 31,536,000 N) after an earthquake. We investigated a range of values of N (N = 2, 5, 10, 20, 30 years).
Typical values of ‘background’ permeability in various crustal lithologies, at pertinent depths of 2–15 km, are in the range 10−22 to 10−18 m2 (e.g. Brace 1980; Rowland & Simmons 2012). However, where the crust is critically stressed and close to failure, deep drilling and induced seismicity experiments indicate values of 10−17 to 10−16 m2 (Townend & Zoback 2000) and permeability follows a profile linked to crustal depth (Manning & Ingebritsen 1999). In contrast, very large hydraulic changes occur during an earthquake sequence. Coseismic permeability increases have been measured by linking the migration of hypocentres over time to diffusion of a fluid pressure front. In situations where mainshocks have ruptured overpressured fluid reservoirs, permeability routinely attains 10−13 to 10−10 m2 (Miller et al. 2004; Waldhauser et al. 2012) and in extreme cases may reach values as high as 10−8 m2 (Noir et al. 1997). On the basis of these field constraints, time-integrated fluid fluxes were calculated using permeability values that decay from coseismic values of 10−13 to 10−9 m2 back to intrinsic background value of 10−18 m2.
The calculations show that an enormous range of time-integrated fluid fluxes are possible (Fig. 20.9, Table 20.3), which are highly sensitive to the initial coseismic permeability value and to a lesser extent the period of time over which healing occurs (i.e. the value of N). There is an order-of-magnitude difference in flux depending on the order of magnitude of permeability enhancement (Fig. 20.9). Furthermore, even in scenarios where healing occurs over a 30-year period, 90% of the fluid flux has accessed the system within ∼5 years or less (∼15% of the healing period).
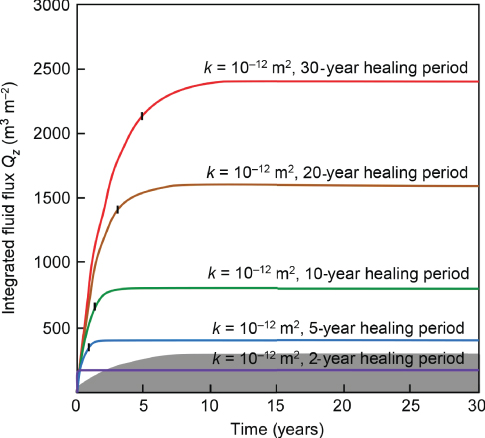
Fig. 20.9 Time-integrated fluid flux derived from initial coseismic permeabilities of 10−12 m2 decaying to 10−18 m2 over time periods of 2, 5, 10, 20 and 30 years (N). For comparison, the field in grey is the range of flux values if coseismic permeabilities were 10−13 m2, illustrating the sensitivity of time-integrated fluid flux to transient coseismic permeability. The marked inflection points are 90% of the total time-integrated fluid flux for each curve – which occurs at ∼15% of the healing period (N). (See color plate section for the color representation of this figure.)
Table 20.3 Time-integrated fluid flux due to different values of coseismic permeability enhancement (k0) that decay to a background value (k1), over different periods of time (N)
| k0 (m2) | k1 (m2) | N (years) | Qz (m3 m−2) |
| 10−9 | 10−18 | 30 | 1,612,283 |
| 10−9 | 10−18 | 20 | 1,074,855 |
| 10−9 | 10−18 | 10 | 537,428 |
| 10−9 | 10−18 | 5 | 268,714 |
| 10−9 | 10−18 | 2 | 107,486 |
| 10−10 | 10−18 | 30 | 181,382 |
| 10−10 | 10−18 | 20 | 120,921 |
| 10−10 | 10−18 | 10 | 60,461 |
| 10−10 | 10−18 | 5 | 30,230 |
| 10−10 | 10−18 | 2 | 12,092 |
| 10−11 | 10−18 | 30 | 20,729 |
| 10−11 | 10−18 | 20 | 13,820 |
| 10−11 | 10−18 | 10 | 6,910 |
| 10−11 | 10−18 | 5 | 3,455 |
| 10−11 | 10−18 | 2 | 1,382 |
| 10−12 | 10−18 | 30 | 2,418 |
| 10−12 | 10−18 | 20 | 1,612 |
| 10−12 | 10−18 | 10 | 806 |
| 10−12 | 10−18 | 5 | 403 |
| 10−12 | 10−18 | 2 | 161 |
| 10−13 | 10−18 | 30 | 290 |
| 10−13 | 10−18 | 20 | 194 |
| 10−13 | 10−18 | 10 | 97 |
| 10−13 | 10−18 | 5 | 48 |
| 10−13 | 10−18 | 2 | 19 |
Duration of goldfield formation and transient permeability in the Earth's crust
Table 20.3 shows the time-integrated fluid fluxes that could arise due to transient coseismic changes in permeability from single earthquake–aftershock sequences. These constraints allow us to calculate the number of seismic cycles and overall time duration that may be necessary to form a goldfield associated with a stepover, and draw conclusions regarding which values of coseismic permeability are sensible. In what follows, we base our estimates on a 10-year permeability decay period, because this matches the healing periods observed for large earthquake sequences.
Gold solubility in hydrothermal fluids typical of orogenic gold deposits is expected to exist across the range 1–1000 ppb (Micucki 1998), whereas Simmons & Brown (2007) measured slightly undersaturated solubilities directly from geothermal fluids in the order of 10 ppb. Under these conditions, aqueous fluid volumes of 1.6 × 10¹⁰ m3 are required to form a moderately large goldfield with 5 Moz of gold. Given that the area of damage triggered by static stress changes around an underlapping stepover is in the order of 10–12 × 10 m2 (Fig. 20.8), ranging up to ∼16 × 106 m2 for results from the Mount Pleasant and St Ives goldfields (Micklethwaite & Cox 2006), then it is possible to use the results of Table 20.3 to estimate the number of seismic sequences necessary to generate a 5 Moz goldfield. We divide the fluid volume required by the product of the time-integrated flux and the surface area (i.e. calculating for permeability integrated uniformly over the area of the damage zone).
For transient permeabilities at even moderate values of the geophysically determined spectrum (k0 = 10−12 m2), 5 Moz of gold can precipitate extremely rapidly, within one or two earthquake sequences (using the directly measured but conservative gold solubility value of 10 ppb). This is assuming that >99% of dissolved gold precipitates, which has been observed in geothermal fields (Brown 1986). Even for coseismic permeabilities at the lower end of the spectrum (k0 = 10−13 m2), the 5 Moz goldfields still form rapidly, within 10–16 earthquake sequences. Therefore, it is feasible that many orogenic goldfields form in as little as 10–8000 years.
In order to assess the validity of these estimates, it is important to understand the concept of stepover lifespan. Fault stepovers are ephemeral geometric features within a fault system and are not expected to exist for the duration of a fault system. On regional-scale faults, stepovers may exist for 105 years (Parsons et al. 2003; Walker et al. 2005) although constraints are poor. Recurrence intervals of individual fault segments on regional-scale strike-slip fault systems, such as the San Andreas fault system, are in the order of 100–500 years (Smith-Konter & Sandwell 2009), which suggests a stepover may be shortcut within hundreds of regional-scale fault rupture events. Therefore, even the lower end of estimated coseismic permeability (k0 = 10−13 m2) is enough to allow a 5 Moz goldfield to form around stepovers before the stepover ceases to exist.
A further consideration in this argument is the existence of truly supergiant deposits, such as Kalgoorlie with >68 Moz gold. Based on the same aforementioned logic, supergiant deposits provide a further constraint on coseismic damage zone permeabilities. At coseismic permeability of 10−13 m2, they require several hundred earthquake sequences and are unlikely to form within the lifespan of a stepover, unless derived from high gold solubility fluids. In contrast, they are comfortably generated if their hosting damage zone structures attain transient permeability values of 10−12 m2, when triggered by >30 mainshock events on the regional-scale structure.
Conclusions
This study has demonstrated that fault stepovers have a distinct and quantifiable spatial relationship with goldfields, over distances approaching the plate scale. Underlapping stepovers, although rarer components of fault systems, appear to have a particular association with mineralisation. The examples studied here hold to an approximate aspect ratio of 3:1, which fits a first-order self-similar global trend for both overlapping and underlapping stepovers. Boundary element modeling indicates that underlapping stepovers may favour mineralisation because rupture events around such stepovers have the ability to generate static stress–triggered damage and permeability enhancement over a larger area than overlapping or neutral stepover geometries.
In fault systems undergoing mineralisation, slip events on regional-scale fault segments trigger damage around stepovers and rupture overpressured fluid reservoirs at depth. A pulse of gold-bearing fluid, under high pressure, then migrates through the system at remarkably high but transient permeabilities, during multiple fracture and fault slip events in the damage zone.
Time-integrated fluid flux calculations that take into account both the transient enhancement and decay of permeability indicate that 90% of the fluid flux is attained in ∼15% of the healing period, when fluid flow is driven by a lithostatic fluid pressure gradient. The fluid fluxes involved suggest that moderately large goldfields of 5 Moz could form in as little as 1–16 seismic sequences, representing a potential duration of 10–8000 years. Similar rapid durations for goldfield formation have been inferred from different environments (e.g. volcano sector collapse, Lihir, Papua New Guinea, Heinrich 2006; convective circulation, Taupo Volcanic Zone, Rowland & Simmons 2012; earthquake events, North Carlin goldfield, Nevada, Hickey et al. 2014). We have shown that supergiant goldfields can be explained if crustal permeability transiently reaches values of 10−12 m2 or less. Extreme permeability values in the upper limits of those estimated from seismological studies of earthquake sequences (e.g. 10−10 to 10−8 m2) are not required to explain the formation of orogenic goldfields.
The permeability values discussed in this study are likely most relevant for the mid- to upper-crust, at depths of 15 to ∼2 km. In stepover regions, permeability enhanced by fault rupture events is expected to be channel-like and independent of depth, until the fracturing related to seismicity has begun to heal and decrease in intensity. Instead, the permeability enhancement will depend on the degree of coseismic damage. As demonstrated by Figures 20.6 and 20.7, these permeability channels will not necessarily be confined to the volume of rock between overlapping or underlapping fault stepovers but also extend into the wall rock adjacent to the stepover.
Acknowledgements
We are extremely grateful for the diligence of the editors Steven Ingebritsen and Mark Person. Philipp Weis substantially improved the manuscript and detected an error in one of the initial calculations. Both Weis and Tom Gleeson (guest editor) provided excellent and thorough reviews. S.M. was supported by the Hammond-Nisbet Endowment at the Centre for Exploration Targeting during completion of this study.
Supporting information
Additional supporting information may be found in the online version of this chapter, Geofluids (2015) 15, p. 240–251.
- Figure S1.Map of the Kalgoorlie–Ora Banda district, showing the distribution of faults and deposits used in this analysis, as well as different buffer distances. Greenstone rocks are in black, granite-gneiss in pink.


