Drop-down inputs function exactly the same as radio inputs. The former is used when the selection is huge and you do not want the list of choices to unnecessarily clutter the entire page. The http_uri field has numerous results, so this makes a dropdown the ideal candidate for input here.
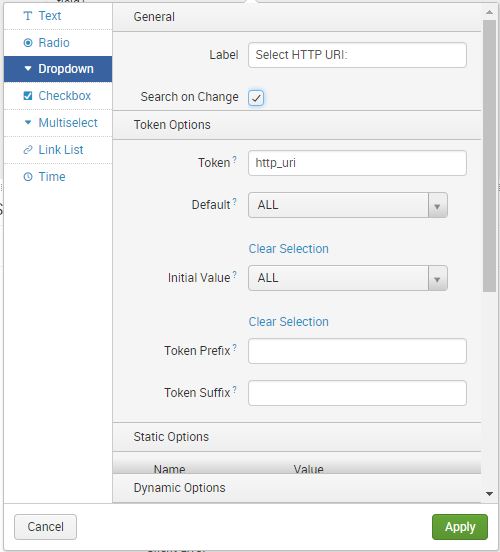
Follow the same procedure as for radio input creation, but make sure you have selected Dropdown instead. Use the following information and screenshots as guides to complete the task:
- Click on Edit
- Select Add Input | Dropdown
- Click the Edit icon for the newly created input
- In the Label field, type in Select HTTP URI: to name your new dropdown
- As you did when you created a radio button, enable Search on Change by checking the checkbox
- In the Token field, type http_uri
- For Static Options, type ( Name: ALL, Value: * )
- Under Token Options section, in Default, select ALL
- Under Token Options section, in Initial Value, select ALL
- Under Dynamic Options, be sure the search icon is selected
- In the search string, type the following to designate that you want the index labeled main and top zero to designate that you want to return all values of http_uri:
SPL> index=main | top 0 http_uri
- For the time range, specify Last 60 minutes
- In Field for Label, type http_uri
- In the Field for Value, also enter http_uri
- Click on Apply to save your changes:


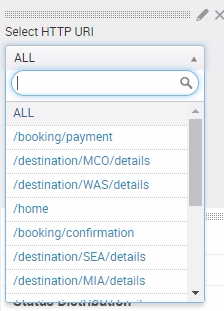
If done correctly, the newly created drop-down input will look like this:

Now that you have created the drop-down input, go ahead and associate its token with the search panels. The same procedure applies; you have to edit each search string to include the new token:
- Add the new Dropdown token you have created to the Status Types by URI panel, which will return the top 10 (by default) status types, along with their status descriptions, http_uri values, and server_ip values: http_uri=$http_uri$:
SPL> index=main status_type=$status_type$ http_uri=$http_uri$
     server_ip=$server$ | top status_type, status_description,
     http_uri, server_ip
- Also add the same token to the Status Types Over Time panel, which will then return a timechart of the top 10 counts for http_status_code:
SPL> index=main status_type=$status_type$ http_uri=$http_uri$
     server_ip=$server$ | timechart count by http_status_code
- And finally, add the token to the Hits vs Response Time panel, which will return a timechart showing the top 10 counts and average values of http_response_time (labeled as response_time):
SPL> index=main status_type=$status_type$ http_uri=$http_uri$
    server_ip=$server$ | timechart count, avg(http_response_time) as
    response_time
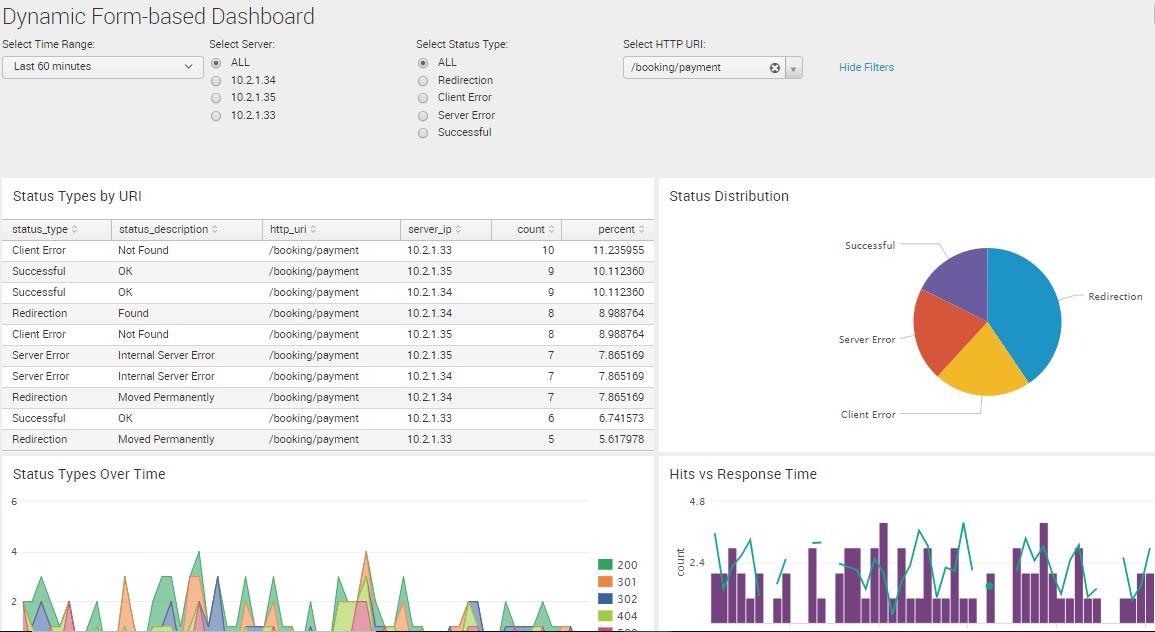
When all the form inputs are done, this is how it should look. We first show the heading, where you can filter:

This is now a fully functional, dynamic, form-based dashboard:
