Now, we are going to create radio inputs with dynamic searches used to drive the input value choices. This will allow users to select server and status types, and will affect the information rendered by the panels:
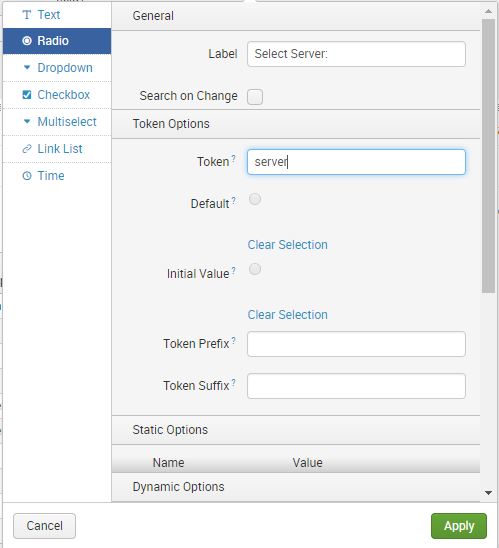
- Click on Edit.
- Select Add Input | Radio.
- Click on the Edit icon in the newly created input.
- In the Label field, type in Select Server:.
- Enable Search on Change by checking the checkbox.
- In the Token field, type server:

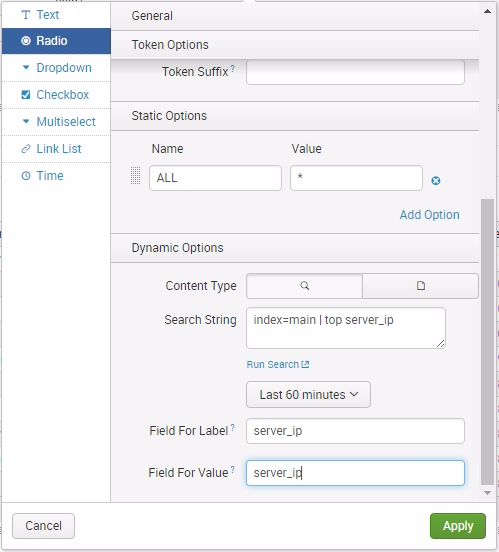
- Scroll down to Static Options and click on it. In Static Options, add Name as ALL and Value as *.
- Click on Dynamic Options, then fill in Search String, entering the following search command:
SPL> index=main | top server_ip
- Update the time range to Last 60 minutes.
- In Field For Label, type in server_ip.
- In Field For Value, type in server_ip:

- Now, scroll back up to Token Options.
- For Default, select ALL.
- For Initial Value, select ALL.
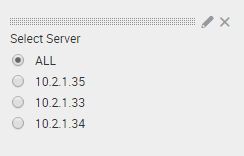
- Click on Apply and you're done:

Now that you have configured the radio input with dynamic search options, you will see that the selection has been populated, along with the static option that you created. This is a great way of creating selection inputs when you know that the items will regularly change, depending on a search query:

Try this exercise to reinforce what you have learned. Create a second radio input option, following the same steps as previously, with the following information:
- Label: Select Status Type:
- Search on Change: Check
- Token: status_type
- Static Options: (Name: ALL, Value: * )
- Search String: index=main | top status_type
- Time Range: Last 60 minutes
- Field For Label: status_type
- Field For Value: status_type
- Token Options Default: ALL
- Token Options Initial Value: ALL
Click on Apply to save your changes.
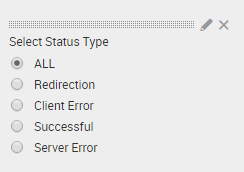
If you did it correctly, the newly created radio input will look similar to this:

Similar to when we first created the Time input, the panels will not react to these new inputs until we associate them. In order for the new inputs to change the values in the panels, we have to modify each panel search string to include the new tokens, server and status_type:
- For the Status Types by URI panel, click on the Edit Search icon.
- Carefully update the Search string, adding the highlighted changes, which are as follows. This will filter the search results to show information for the selected status_type and server_ip:
SPL> index=main status_type=$status_type$ server_ip=$server$
           | top status_type, status_description, http_uri, server_ip
- Click on Apply to save the changes to the form input.
- Click on Done to exit out of Edit mode.
- Refresh the entire page using your browser's refresh icon.
- Now, change the selections of both the Select Server input and the Select Status Type input, and make sure that the data on the first panel is changing. If it is not, ensure you refresh your browser.
Here is an example of data being filtered to 10.2.1.34 and Redirection for data arriving in the Last 60 minutes:

At this point, you will appreciate what form input does to your dashboard. By simply introducing tokens in your search string, you are dynamically altering the panel charts so your users can filter the data in the ways they need, which allows them to answer many different questions with the same dashboard output. Continue editing the remaining panels using the following guide. Refresh your browser if the changes do not happen right away:
- Edit the Status Distribution panel to show the top 10 status types:
SPL> index=main status_type=$status_type$
     http_uri=* server_ip=$server$ | top status_type
- Edit the Status Types Over Time panel to show a timechart with counts reflecting status code and server input selections:
SPL> index=main status_type=$status_type$
    http_uri=* server_ip=$server$ | timechart count by http_status_code
- Edit the Hits vs Response Time accordingly:
SPL> index=main status_type=$status_type$
     http_uri=* server_ip=$server$ | timechart count,
     avg(http_response_time) as response_time