As mentioned earlier in this chapter, any configuration you make in the Splunk portal corresponds to a *.conf file written under the $SPLUNK_HOME directory. The same goes for the creation of data inputs; adding data inputs using the Splunk user interface creates a file called inputs.conf.
Now that you have an index to store Windows logs, let's create a data input for it, with the following steps:
- Go to the Splunk home page.
- Click on your Destinations app. Make sure you are in the Destinations app before you execute the next steps, or your configuration changes won't be isolated to your application.
- In the Splunk navigation bar, select Settings.
- Under the Data section, click on Data inputs.
- On the Data inputs page, click on Files & directories.
- In the next page, click on the New button.
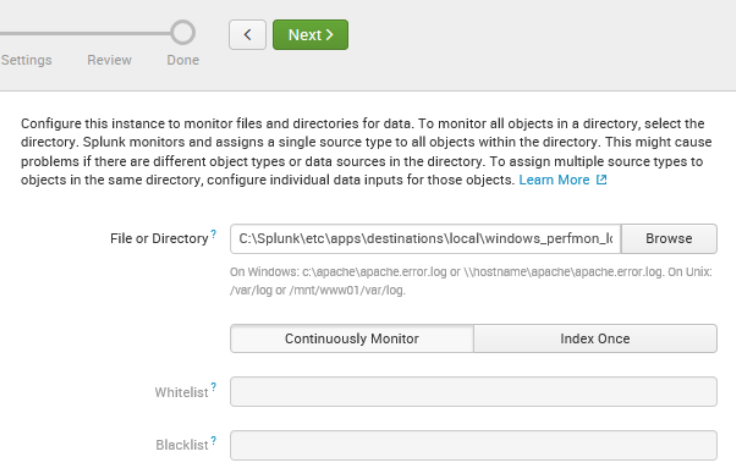
- Locate the windows_perfmon_logs.txt file from the Chapter 2/samples and select it.
- Ensure Continuously Monitor is selected. Your selections should resemble the following screenshot:

- However, if you're using a Linux machine, your selections should resemble the following screenshot:

- Click on Next to advance to the set source type screen. While not defaulting to a specific value, Splunk recognizes the files characters and applies proper line breaking for the source file in question.
- Click on Save As to enter the custom sourcetype as myperfmon. Ensure the category for the sourcetype is Custom and the app is your Destinations app. Finally, click on the Save button to save your new custom sourcetype.
- Click on the Next button at the top of the screen to proceed to the next step in the data input process.
- In the input setting window, ensure that the app context is Destinations (destinations) and set the index for this data input to the winlogs index we created earlier in this chapter.
- Click on the Review button to proceed to the final review step.
- Click on Submit to complete the data input setup process.
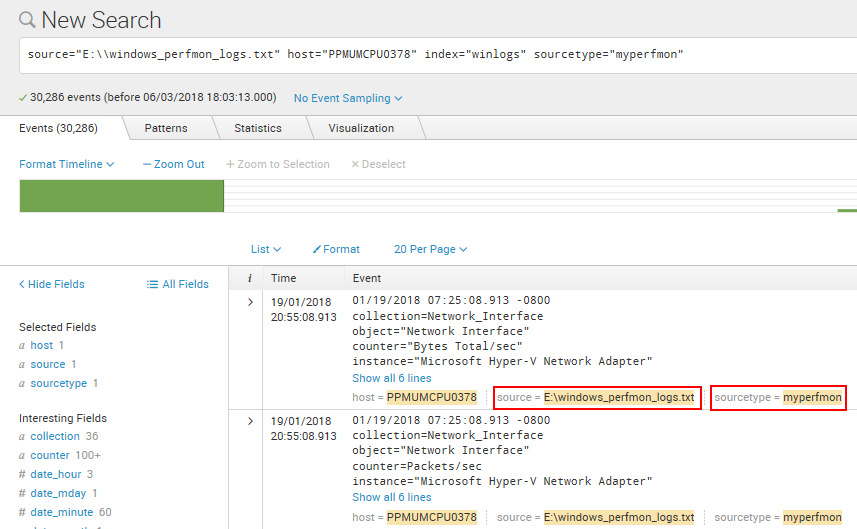
- Click on the Start Searching button on the following screen to ensure the data from the perfmon sample file is being loaded. As in the Windows example screenshot shown as follows, the source and the sourcetype associated with the raw events are called out as Selected Fields:

We have introduced a new concept here called sourcetype. A sourcetype is a type of classification of data that has been automatically made for you when you created the data input through the Splunk portal. There will be more about sourcetypes in Chapter 3, Search Processing Language. In our preceding example, classifying the data input as myperfmon would allow us to easily search as well as provide specific rules to this data, as opposed to other windows log data we may want to store in the same index.
Go ahead and inspect the inputs.conf file:
- View the following file:
$SPLUNK_HOME/etc/apps/destinations/local/inputs.conf
- Compare your results with this inputs.conf entry and ensure that it is the same (Windows first, and then Linux):
Windows: [monitor://C:Splunkwindows_perfmon_logs.txt]
          disabled = false
          index = winlogs
          sourcetype = myperfmon
  Linux: [monitor:///home/jp/windows_perfmon_logs.txt]
          disabled = fales
          index = winlogs
          sourcetype = myperfmon
Seasoned Splunk administrators may add data inputs directly to the inputs.conf file instead of using the user interface, and may require a Splunk restart.
The complete documentation for the inputs.conf file can be found at https://docs.splunk.com/Documentation/Splunk/latest/Admin/Inputsconf.
If you closely followed the instructions in this book, you should now have the data sources you need in your very own Splunk system used in the remainder of the book.