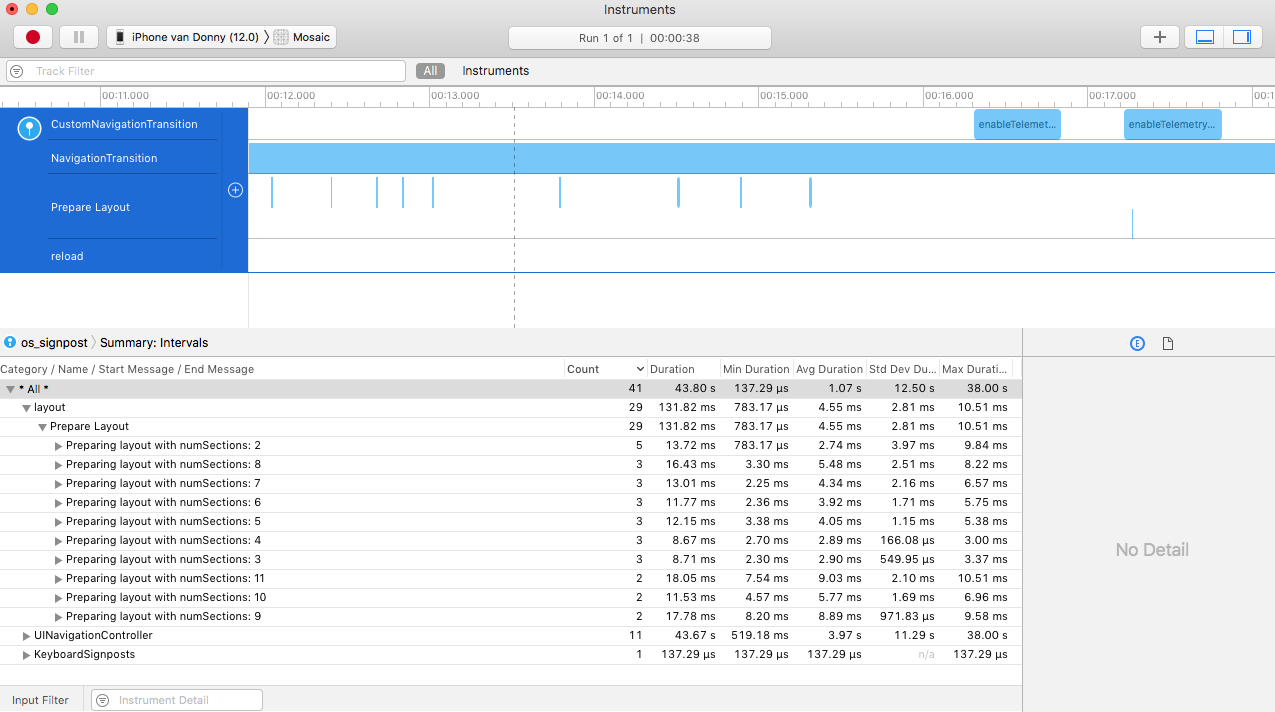
As a developer, you want to know exactly what your app is doing and how long your app spends on certain parts of your code. It's common to use breakpoints or print statements to do some basic debugging or logging in your app, but keeping track of many print statements in the console can be quite tedious. In iOS 12, you can use signpost logging to flag the beginning and end of a certain task and you can visualize these logs in Instruments using the built-in os_signpost instrument. The ossignpost instrument logs all signposts you track and shows them on a timeline. The following image shows an example of what signpost logging in Instruments looks like:

You can see a couple of timelines, one of them is labeled Prepare Layout. This timeline is a custom signpost that is sent from the Mosaic app. In the detail area, you can see more details about the signposts that were posted. The signposts that are posted by Mosaic correspond with the calls to prepare() on the custom collection view layout on the collection view page. Using signposts to track the performance of the prepare() method is more convenient in certain ways than using the Time Profiler; the Time Profiler provides a lot of detailed information that you might not always want to see right away. In this case, you would be more interested in making sure setting up the layout doesn't take too long. Additionally, you might want to make sure that prepare() performs well with many different amounts of sections.
Adding signposts to your app only takes a couple of minutes and they can give you fantastic new insights into what your app is doing. To add signposts to your app, you need an OSLog handle. An OSLog handle sounds very fancy, but it's just an instance of OSLog that is associated with your app. Go ahead and open ListCollectionViewLayout.swift in the Mosaic project and add the following code to this file:
import os.signpost

private let layoutLogger = OSLog(subsystem: "com.donnywals.layout", category: "layout")
The preceding code imports the os.signpost framework and creates a log handle that will be used to track the signposts. When you create a signpost, you can flag the signpost as one of three types:
- Begin
- End
- Point of interest
The begin and end signposts are used to flag the start and end of an operation. You will add these signposts to the prepare() method to track the performance of preparing the collection view layout. A point of interest signpost is a special kind of signpost that is used to flag interesting moments that can occur in your app. For instance, when a user taps on something or when you reach a certain special moment inside of an operation. To log a signpost, you need to obtain OSSignpostID. This object is used to link two begin and end signposts together so it's essential that you use the same signpost ID. To create a signpost ID, you can use one of the following two methods:
let one = OSSignpostID(log: layoutLogger, object: self)
let two = OSSignpostID(log: layoutLogger)
The first method can only be used if the object parameter you pass to the OSSignpostID initializer is a class. This way of creating a signpost ID will always return the same for any given object. So if you use this method, every time you use this initializer inside of a particular class instance, the ID will be the same.
The second method generates a random, unique signpost ID every time. So if you're using signposts with a struct, make sure to store the signpost ID so you can reuse it if needed.
Once you have obtained your signpost ID, you can begin logging signpost events. Update the code for prepare() in the collection view layout as follows:
override func prepare() {
  super.prepare()

  guard let numSections = collectionView?.numberOfSections, numSections != 0
    else { return }
  // 1
  let id = OSSignpostID(log: layoutLogger, object: self)
  // 2
  os_signpost(.begin, log: layoutLogger, name: "Prepare Layout", signpostID: id, "Preparing layout with numSections: %{public}@", "\(numSections)")

  // existing implementation

  // 3
  os_signpost(.end, log: layoutLogger, name: "Prepare Layout", signpostID: id, "Done preparing layout")
}
The first comment signals the creation of a signpost ID. Since the collection view layout is a class, it can be passed to the signpost ID initializer. Once the signpost ID is created, the begin signpost is added. Every signpost is attached to a logger and has a name. The name should be the same for the begin and end signpost so the system understands that they both relate to the same event in your app. The last argument for the signpost begin and end calls is the description of the event. The description is a formatted string so you can add metadata to it through format specifiers. In this case, the %{public}@ specifier is used to signal that a string will be added to the description. The end signpost does not have any variables associated with it.
To see your signposts in Instruments, you need to run your app for profiling like you have done before in this chapter. Instead of selecting one of the predefined templates, select a blank template when Instruments starts up. Use the + icon to find the os_signpost instrument:

After locating the os_signpost instrument, drag it to the timeline area. You can now begin profiling your app and your signposts should appear. While this is cool, the default view combines your signposts in the detail view. You can see that every time you log Preparing layout with numSections: 2, the count for this message is incremented and you can see the minimum, maximum, and average duration. Usually, this is plenty of information, but what if you want to see every individual signpost call in the detail view? You can achieve this by creating your own custom Instruments Package.